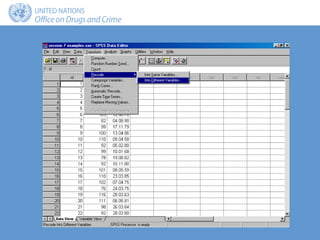
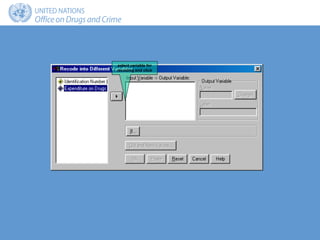
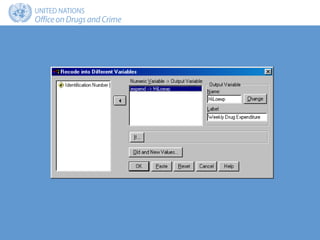
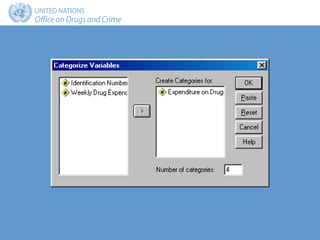
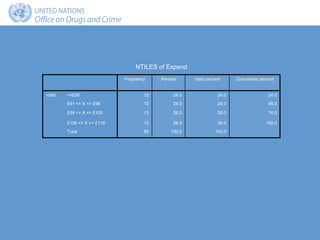
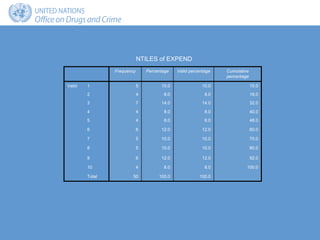
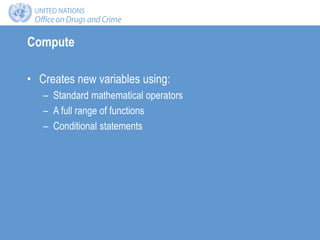
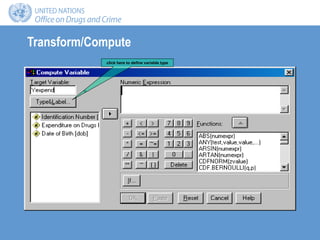
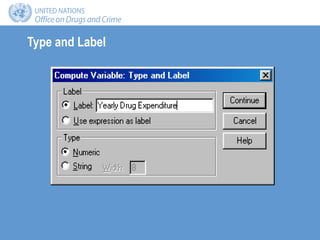
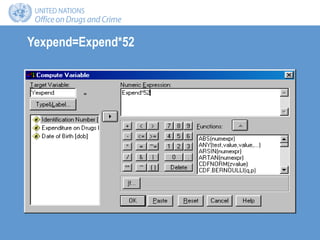
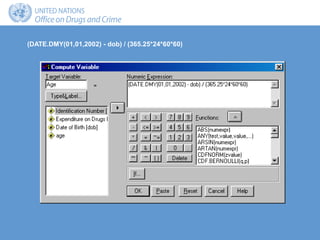
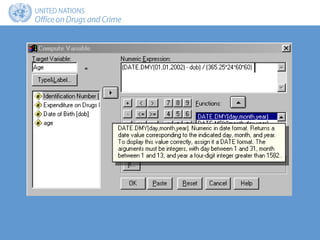
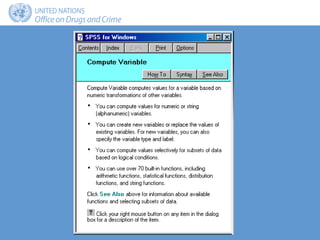
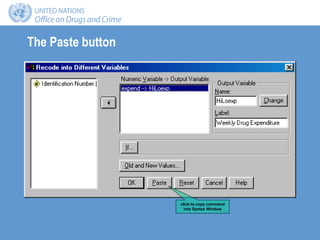
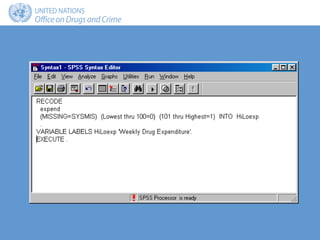
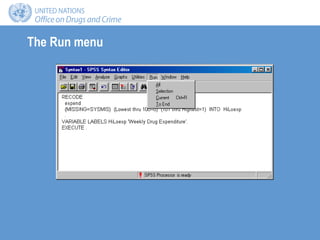
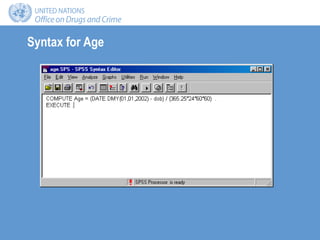
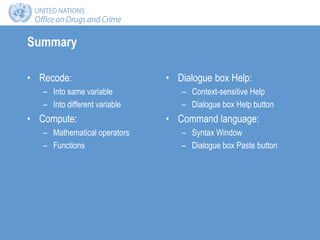
GAP Toolkit 5
Training in basic drug abuse data management
and analysis
Training session 7
SPSS: Recode and Compute
Objectives
• To introduce and demonstrate SPSS tools for recoding
variables and creating new variables
• To introduce and demonstrate the use of SPSS
command syntax
• To introduce and demonstrate Help features in SPSS
from a dialogue box
Types of recode
• A categorical variable into a new set of categories
• A continuous variable into a categorical variable
Recode approaches
• Into pre-defined categories of interest
• Into categories of equal size
Example: pre-defined categories
• Recode weekly expenditure on drugs into the following
categories:
– Low expenditure <= £100 a week
– High expenditure >= £101 a week
select variable for
recoding and click
click here to map
old  new values
Frequency Percent Valid
percent
Cumulative
percent
Valid Low 31 62.0 62.0 62.0
High 19 38.0 38.0 100.0
Total 50 100.0 100.0
Weekly drug expenditure
Example: quantiles
• Recode weekly expenditure into the following:
– 4 categories, each with approximately the same number of
cases (quartiles)
– 10 categories, each with approximately the same number of
cases (deciles)
Frequency Percent Valid percent Cumulative percent
Valid <=£90 12 24.0 24.0 24.0
£91 <= X <= £98 12 24.0 24.0 48.0
£99 <= X <= £105 13 26.0 26.0 74.0
£106 <= X >= £116 13 26.0 26.0 100.0
Total 50 100.0 100.0
NTILES of Expend
Frequency Percentage Valid percentage Cumulative
percentage
Valid 1 5 10.0 10.0 10.0
2 4 8.0 8.0 18.0
3 7 14.0 14.0 32.0
4 4 8.0 8.0 40.0
5 4 8.0 8.0 48.0
6 6 12.0 12.0 60.0
7 5 10.0 10.0 70.0
8 5 10.0 10.0 80.0
9 6 12.0 12.0 92.0
10 4 8.0 8.0 100.0
Total 50 100.0 100.0
NTILES of EXPEND
Compute
• Creates new variables using:
– Standard mathematical operators
– A full range of functions
– Conditional statements
Transform/Compute
click here to define variable type
Type and Label
Yexpend=Expend*52
Explore: Yexpend
Statistic Std. error
Yearly drug expenditure Mean 5062.72 77.468
95% Confidence Interval
for Mean
Lower Bound 4907.04
Upper Bound 5218.40
5% Trimmed Mean 5072.89
Median 5148.00
Variance 300062.3
Std. Deviation 547.779
Minimum 3848
Maximum 6032
Range 2184
Interquartile Range 754.00
Skewness -.333 .337
Kurtosis -.446 .662
Descriptives
Example 2: Age
• Convert date of birth to age in years
(DATE.DMY(01,01,2002) - dob) / (365.25*24*60*60)
Explore: Age
Statistic Std. error
AGE Mean 25.43 1.219
95% Confidence Interval
for Mean
Lower Bound 22.97
Upper Bound 27.88
5% Trimmed Mean 25.21
Median 22.84
Variance 72.867
Std. Deviation 8.536
Minimum 11
Maximum 44
Range 32
Interquartile Range 12.77
Skewness .579 .340
Kurtosis -.518 .668
Descriptives
Help
• Context-sensitive Help:
– Right click on any part of a dialogue box to obtain help
• Dialogue box Help button
Command language
• Command-line rather than Windows interface
• More flexible
• Reusable
• Saved as text files
Syntax window
• Enter SPSS commands:
– Type directly
– Paste from a dialogue box
• Run SPSS commands
• Save as a text file
The Paste button
click to copy command
into Syntax Window
The Run menu
Syntax for Age
Summary
• Recode:
– Into same variable
– Into different variable
• Compute:
– Mathematical operators
– Functions
• Dialogue box Help:
– Context-sensitive Help
– Dialogue box Help button
• Command language:
– Syntax Window
– Dialogue box Paste button

trs-7.ppt

  • 1.
    GAP Toolkit 5 Trainingin basic drug abuse data management and analysis Training session 7 SPSS: Recode and Compute
  • 2.
    Objectives • To introduceand demonstrate SPSS tools for recoding variables and creating new variables • To introduce and demonstrate the use of SPSS command syntax • To introduce and demonstrate Help features in SPSS from a dialogue box
  • 3.
    Types of recode •A categorical variable into a new set of categories • A continuous variable into a categorical variable
  • 4.
    Recode approaches • Intopre-defined categories of interest • Into categories of equal size
  • 5.
    Example: pre-defined categories •Recode weekly expenditure on drugs into the following categories: – Low expenditure <= £100 a week – High expenditure >= £101 a week
  • 7.
  • 9.
    click here tomap old  new values
  • 12.
    Frequency Percent Valid percent Cumulative percent ValidLow 31 62.0 62.0 62.0 High 19 38.0 38.0 100.0 Total 50 100.0 100.0 Weekly drug expenditure
  • 13.
    Example: quantiles • Recodeweekly expenditure into the following: – 4 categories, each with approximately the same number of cases (quartiles) – 10 categories, each with approximately the same number of cases (deciles)
  • 15.
    Frequency Percent Validpercent Cumulative percent Valid <=£90 12 24.0 24.0 24.0 £91 <= X <= £98 12 24.0 24.0 48.0 £99 <= X <= £105 13 26.0 26.0 74.0 £106 <= X >= £116 13 26.0 26.0 100.0 Total 50 100.0 100.0 NTILES of Expend
  • 16.
    Frequency Percentage Validpercentage Cumulative percentage Valid 1 5 10.0 10.0 10.0 2 4 8.0 8.0 18.0 3 7 14.0 14.0 32.0 4 4 8.0 8.0 40.0 5 4 8.0 8.0 48.0 6 6 12.0 12.0 60.0 7 5 10.0 10.0 70.0 8 5 10.0 10.0 80.0 9 6 12.0 12.0 92.0 10 4 8.0 8.0 100.0 Total 50 100.0 100.0 NTILES of EXPEND
  • 17.
    Compute • Creates newvariables using: – Standard mathematical operators – A full range of functions – Conditional statements
  • 18.
    Transform/Compute click here todefine variable type
  • 19.
  • 20.
  • 21.
    Explore: Yexpend Statistic Std.error Yearly drug expenditure Mean 5062.72 77.468 95% Confidence Interval for Mean Lower Bound 4907.04 Upper Bound 5218.40 5% Trimmed Mean 5072.89 Median 5148.00 Variance 300062.3 Std. Deviation 547.779 Minimum 3848 Maximum 6032 Range 2184 Interquartile Range 754.00 Skewness -.333 .337 Kurtosis -.446 .662 Descriptives
  • 22.
    Example 2: Age •Convert date of birth to age in years
  • 23.
    (DATE.DMY(01,01,2002) - dob)/ (365.25*24*60*60)
  • 24.
    Explore: Age Statistic Std.error AGE Mean 25.43 1.219 95% Confidence Interval for Mean Lower Bound 22.97 Upper Bound 27.88 5% Trimmed Mean 25.21 Median 22.84 Variance 72.867 Std. Deviation 8.536 Minimum 11 Maximum 44 Range 32 Interquartile Range 12.77 Skewness .579 .340 Kurtosis -.518 .668 Descriptives
  • 25.
    Help • Context-sensitive Help: –Right click on any part of a dialogue box to obtain help • Dialogue box Help button
  • 28.
    Command language • Command-linerather than Windows interface • More flexible • Reusable • Saved as text files
  • 29.
    Syntax window • EnterSPSS commands: – Type directly – Paste from a dialogue box • Run SPSS commands • Save as a text file
  • 30.
    The Paste button clickto copy command into Syntax Window
  • 32.
  • 33.
  • 34.
    Summary • Recode: – Intosame variable – Into different variable • Compute: – Mathematical operators – Functions • Dialogue box Help: – Context-sensitive Help – Dialogue box Help button • Command language: – Syntax Window – Dialogue box Paste button