Become a GC Hero
Ram Lakshmanan
Architect – GCeasy.io & fastThread.io
Confoo 2018
What is Garbage?
Garbage Collection is automatic.
Why should I worry about it?
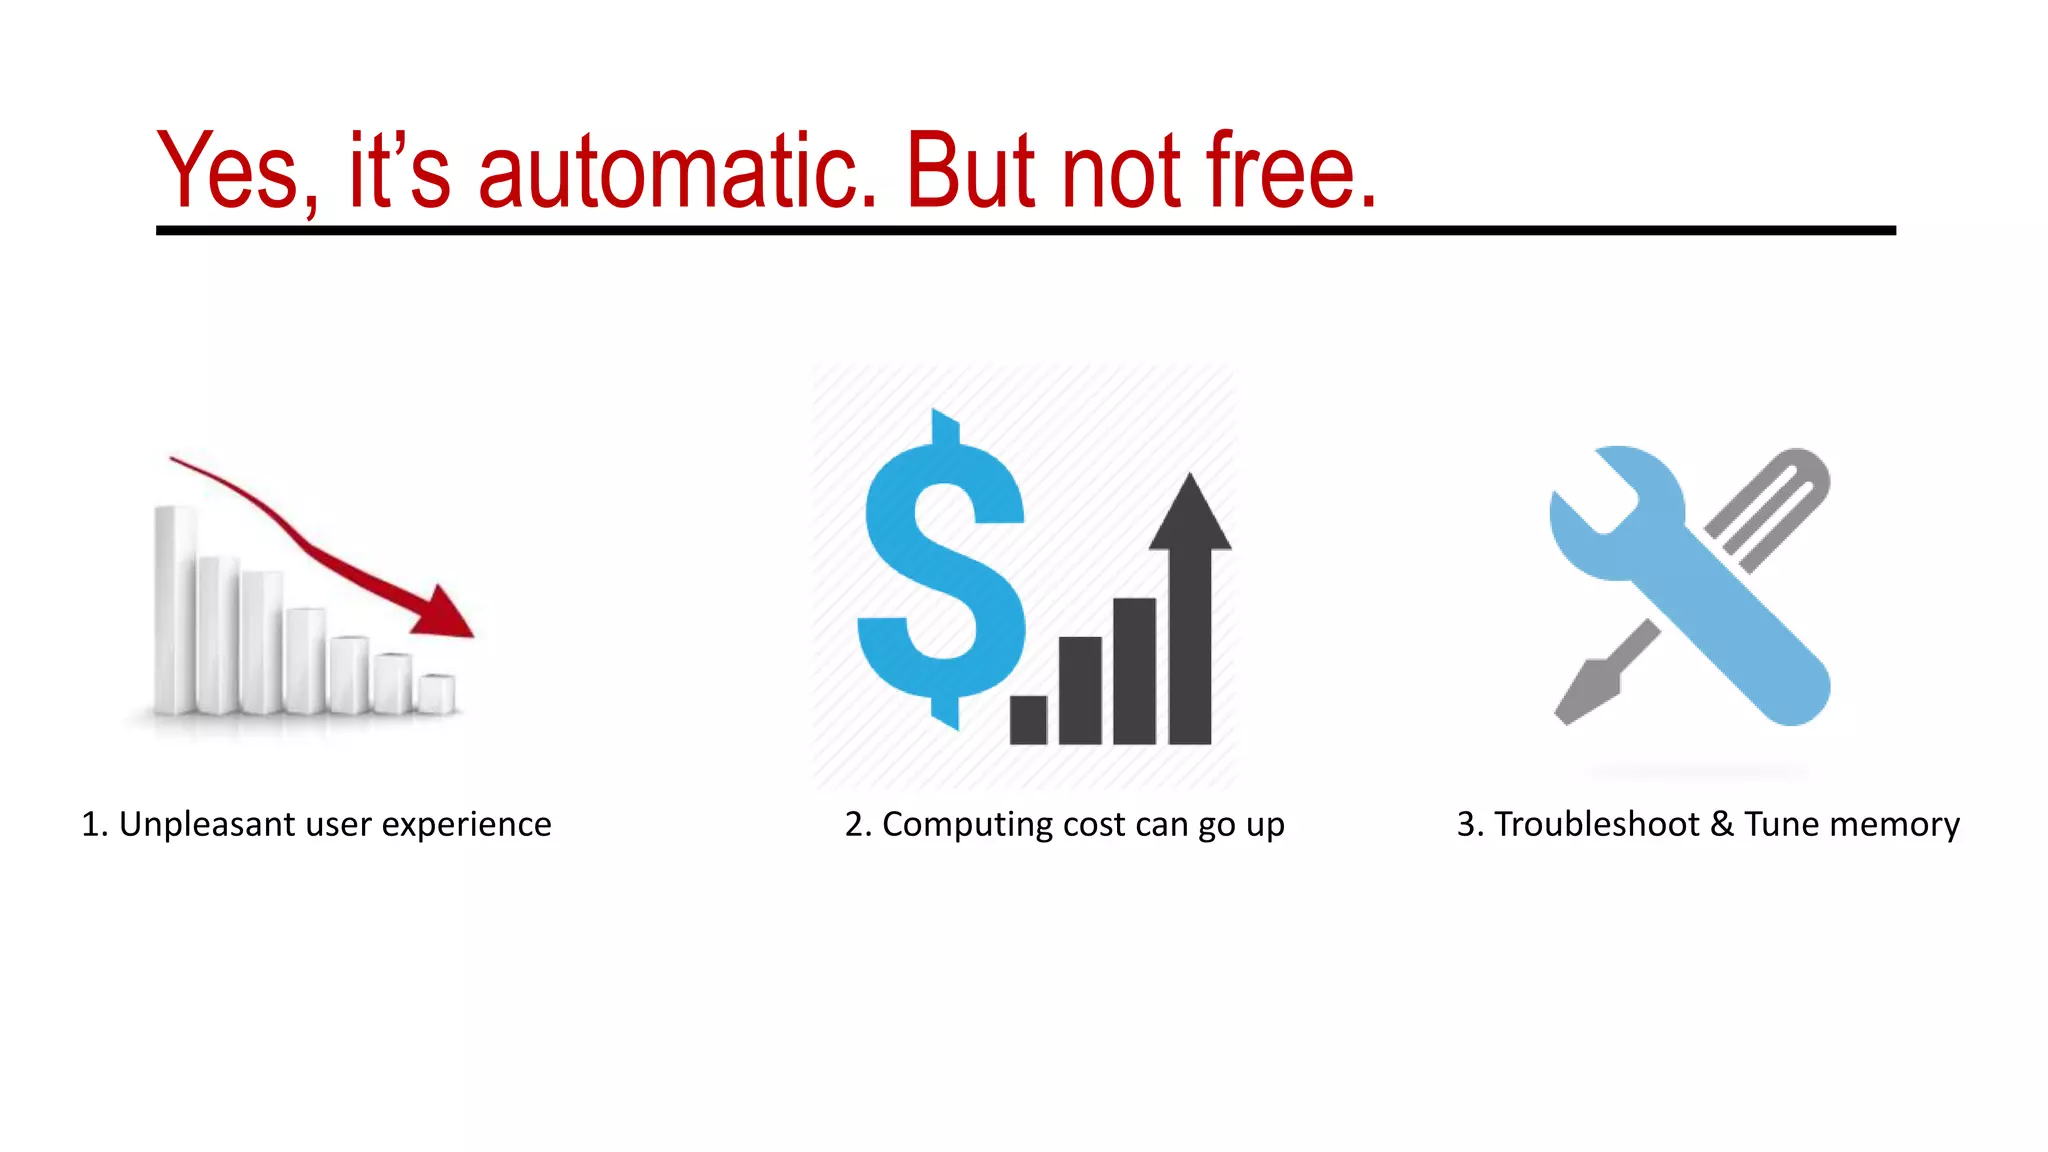
Yes, it’s automatic. But not free.
1. Unpleasant user experience 2. Computing cost can go up 3. Troubleshoot & Tune memory
You can't optimize, what you can't
measure
A famous saying
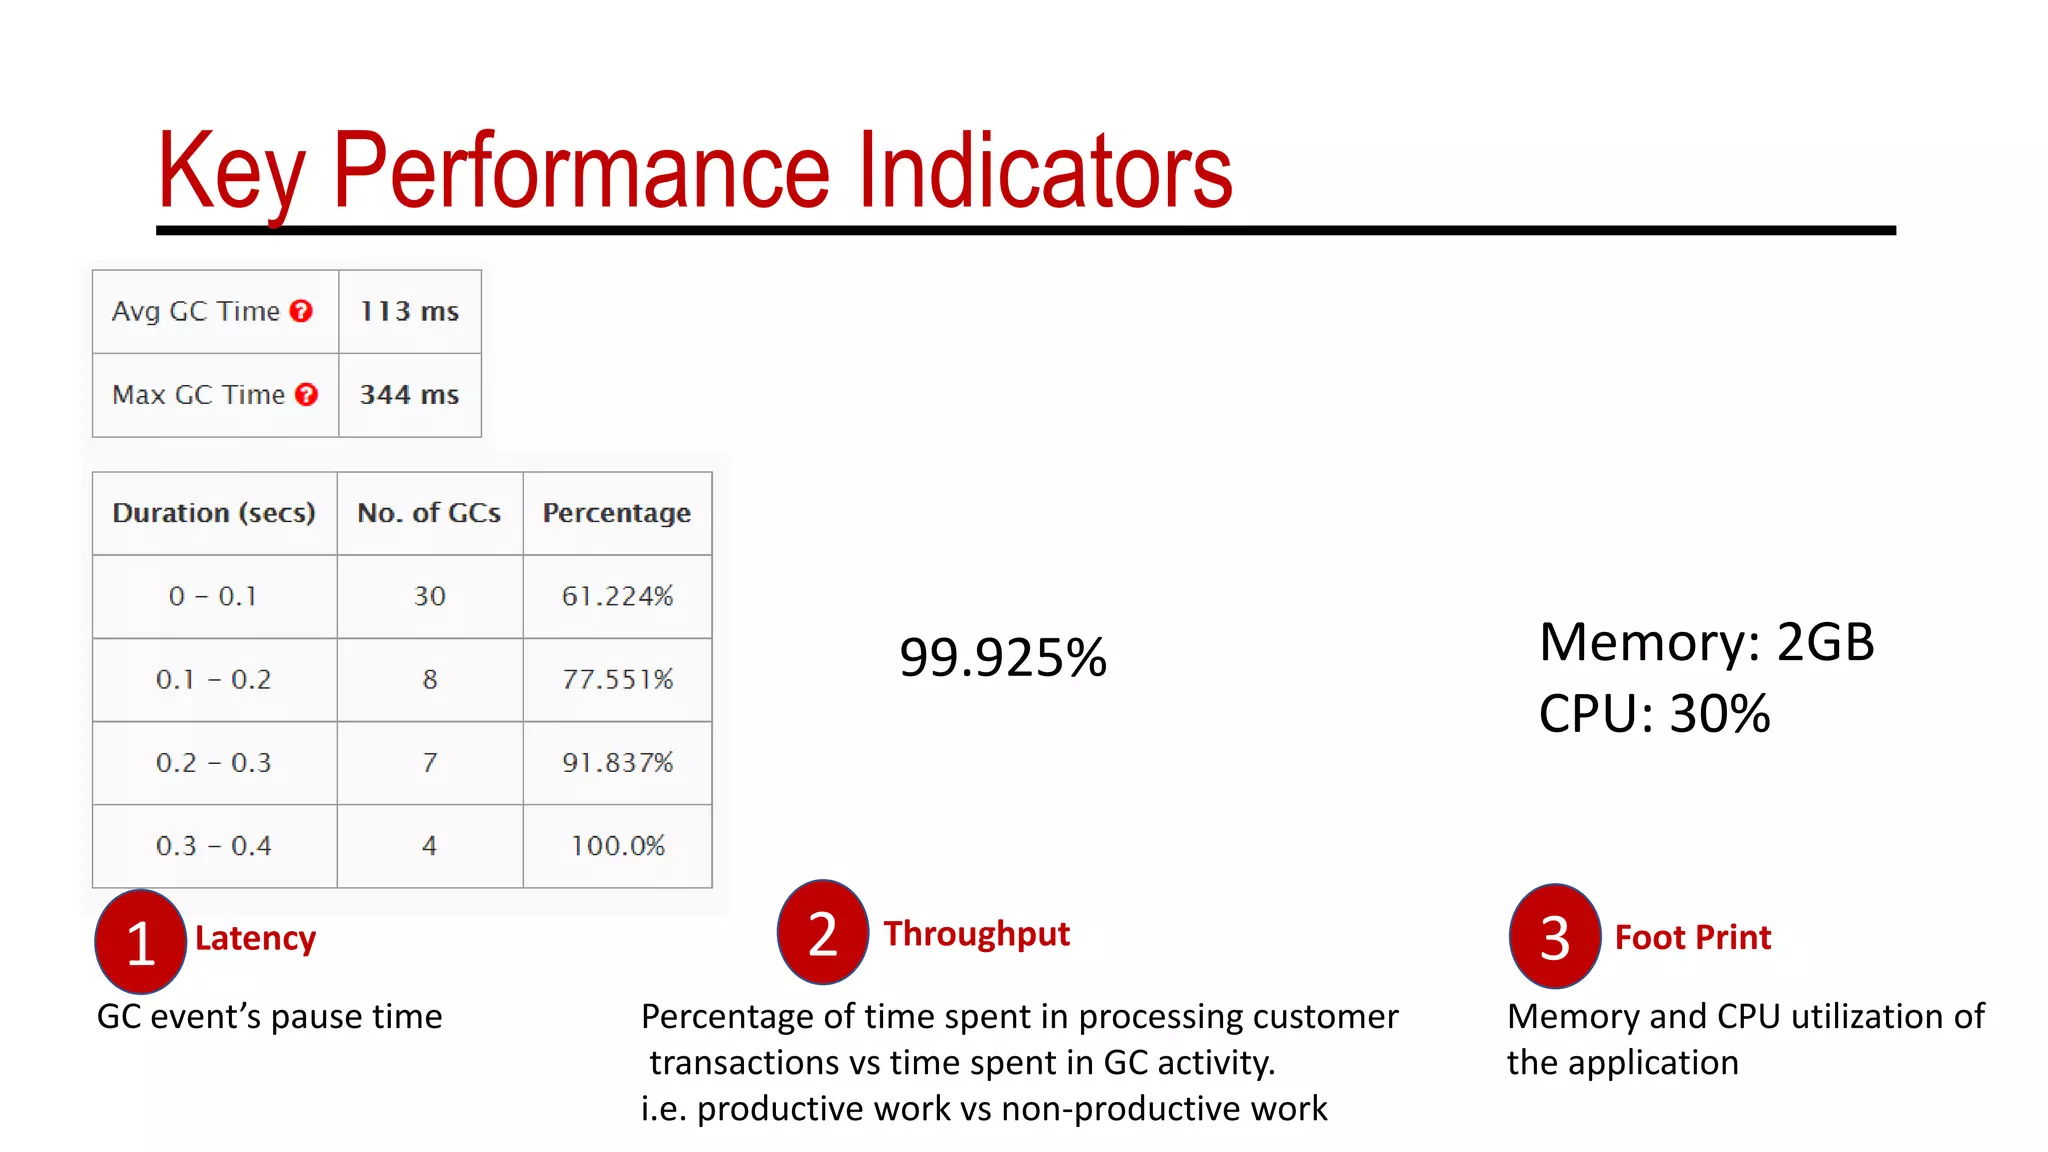
Key Performance Indicators
Latency Throughput
99.925%
Foot Print
Memory: 2GB
CPU: 30%
GC event’s pause time Percentage of time spent in processing customer
transactions vs time spent in GC activity.
i.e. productive work vs non-productive work
Memory and CPU utilization of
the application
1 2 3
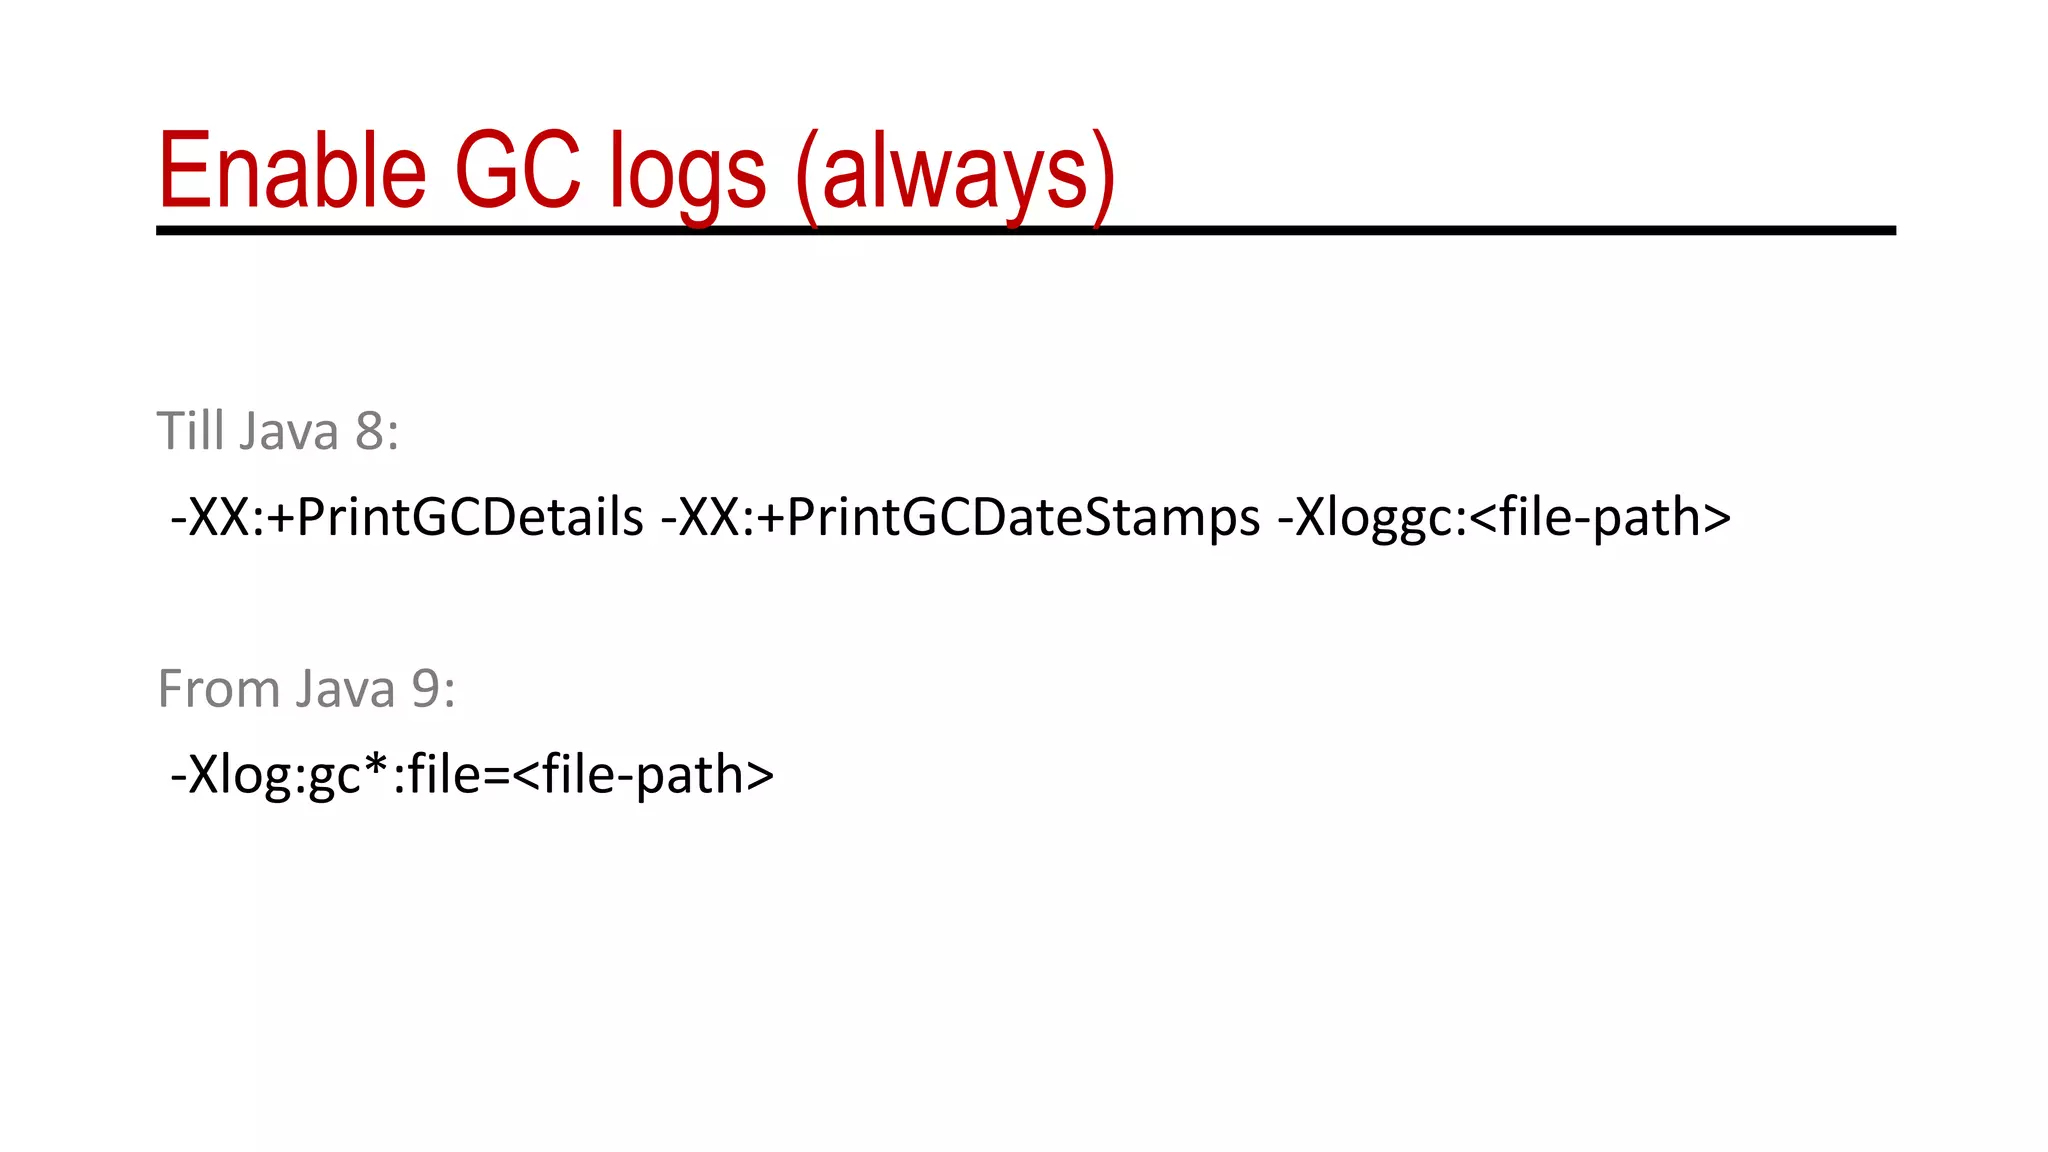
Enable GC logs (always)
Till Java 8:
-XX:+PrintGCDetails -XX:+PrintGCDateStamps -Xloggc:<file-path>
From Java 9:
-Xlog:gc*:file=<file-path>
Vanilla format
2016-08-31T01:09:19.397+0000: 1.606: [GC (Metadata GC Threshold) [PSYoungGen: 545393K->18495K(2446848K)] 545393K->18519K(8039424K),
0.0189376 secs] [Times: user=0.15 sys=0.01, real=0.02 secs]
2016-08-31T01:09:19.416+0000: 1.625: [Full GC (Metadata GC Threshold) [PSYoungGen: 18495K->0K(2446848K)] [ParOldGen: 24K->17366K(5592576K)]
18519K->17366K(8039424K), [Metaspace: 20781K->20781K(1067008K)], 0.0416162 secs] [Times: user=0.38 sys=0.03, real=0.04 secs]
2016-08-31T01:18:19.288+0000: 541.497: [GC (Metadata GC Threshold) [PSYoungGen: 1391495K->18847K(2446848K)] 1408861K->36230K(8039424K),
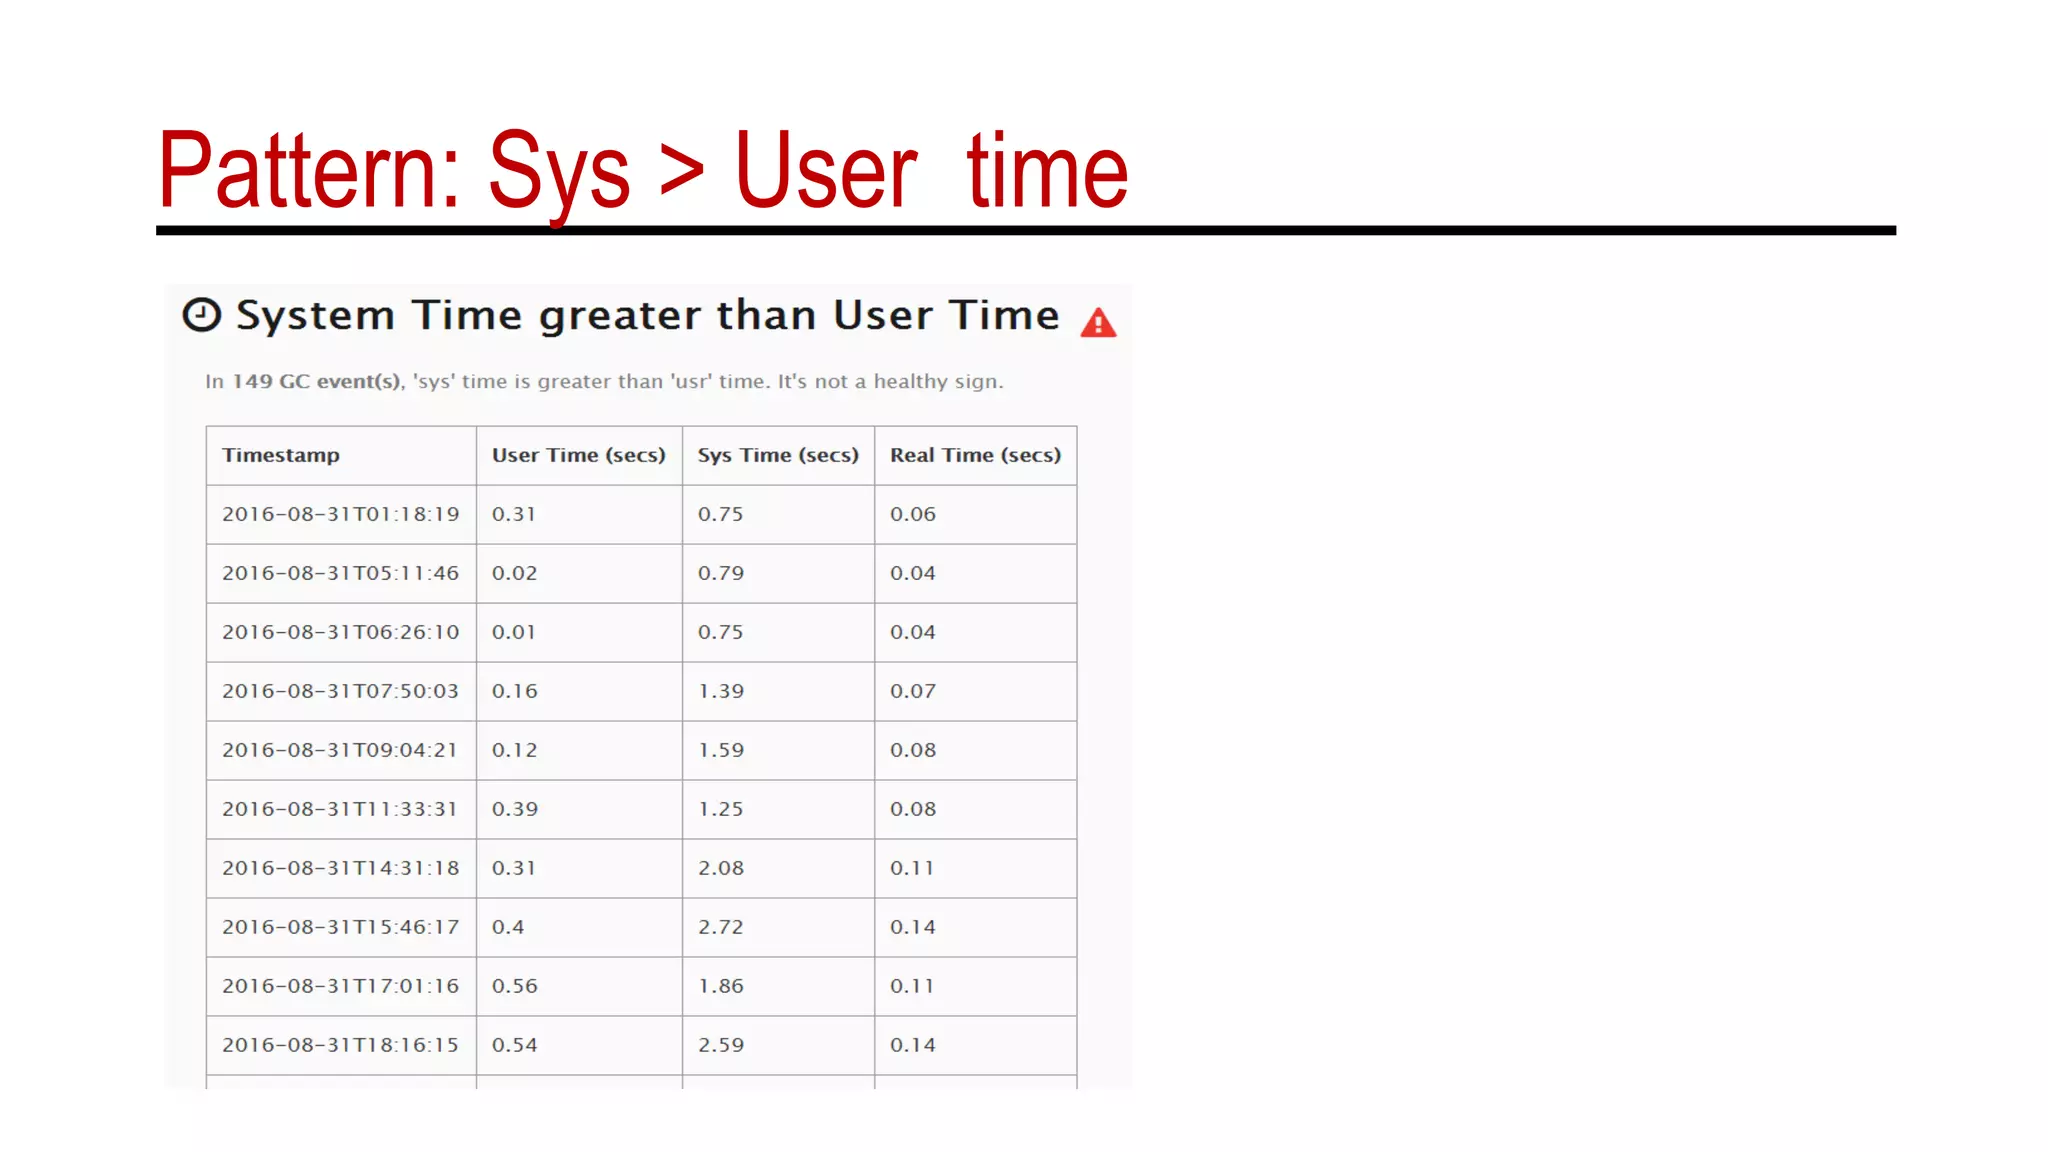
0.0568365 secs] [Times: user=0.31 sys=0.75, real=0.06 secs]
2016-08-31T01:18:19.345+0000: 541.554: [Full GC (Metadata GC Threshold) [PSYoungGen: 18847K->0K(2446848K)] [ParOldGen: 17382K-
>25397K(5592576K)] 36230K->25397K(8039424K), [Metaspace: 34865K->34865K(1079296K)], 0.0467640 secs] [Times: user=0.31 sys=0.08, real=0.04
secs]
2016-08-31T02:33:20.326+0000: 5042.536: [GC (Allocation Failure) [PSYoungGen: 2097664K->11337K(2446848K)] 2123061K->36742K(8039424K),
0.3298985 secs] [Times: user=0.00 sys=9.20, real=0.33 secs]
2016-08-31T03:40:11.749+0000: 9053.959: [GC (Allocation Failure) [PSYoungGen: 2109001K->15776K(2446848K)] 2134406K->41189K(8039424K),
0.0517517 secs] [Times: user=0.00 sys=1.22, real=0.05 secs]
2016-08-31T05:11:46.869+0000: 14549.079: [GC (Allocation Failure) [PSYoungGen: 2113440K->24832K(2446848K)] 2138853K->50253K(8039424K),
0.0392831 secs] [Times: user=0.02 sys=0.79, real=0.04 secs]
2016-08-31T06:26:10.376+0000: 19012.586: [GC (Allocation Failure) [PSYoungGen: 2122496K->25600K(2756096K)] 2147917K->58149K(8348672K),
0.0371416 secs] [Times: user=0.01 sys=0.75, real=0.04 secs]
2016-08-31T07:50:03.442+0000: 24045.652: [GC (Allocation Failure) [PSYoungGen: 2756096K->32768K(2763264K)] 2788645K->72397K(8355840K),
0.0709641 secs] [Times: user=0.16 sys=1.39, real=0.07 secs]
2016-08-31T09:04:21.406+0000: 28503.616: [GC (Allocation Failure) [PSYoungGen: 2763264K->32768K(2733568K)] 2802893K->83469K(8326144K),
0.0789178 secs] [Times: user=0.12 sys=1.59, real=0.08 secs]
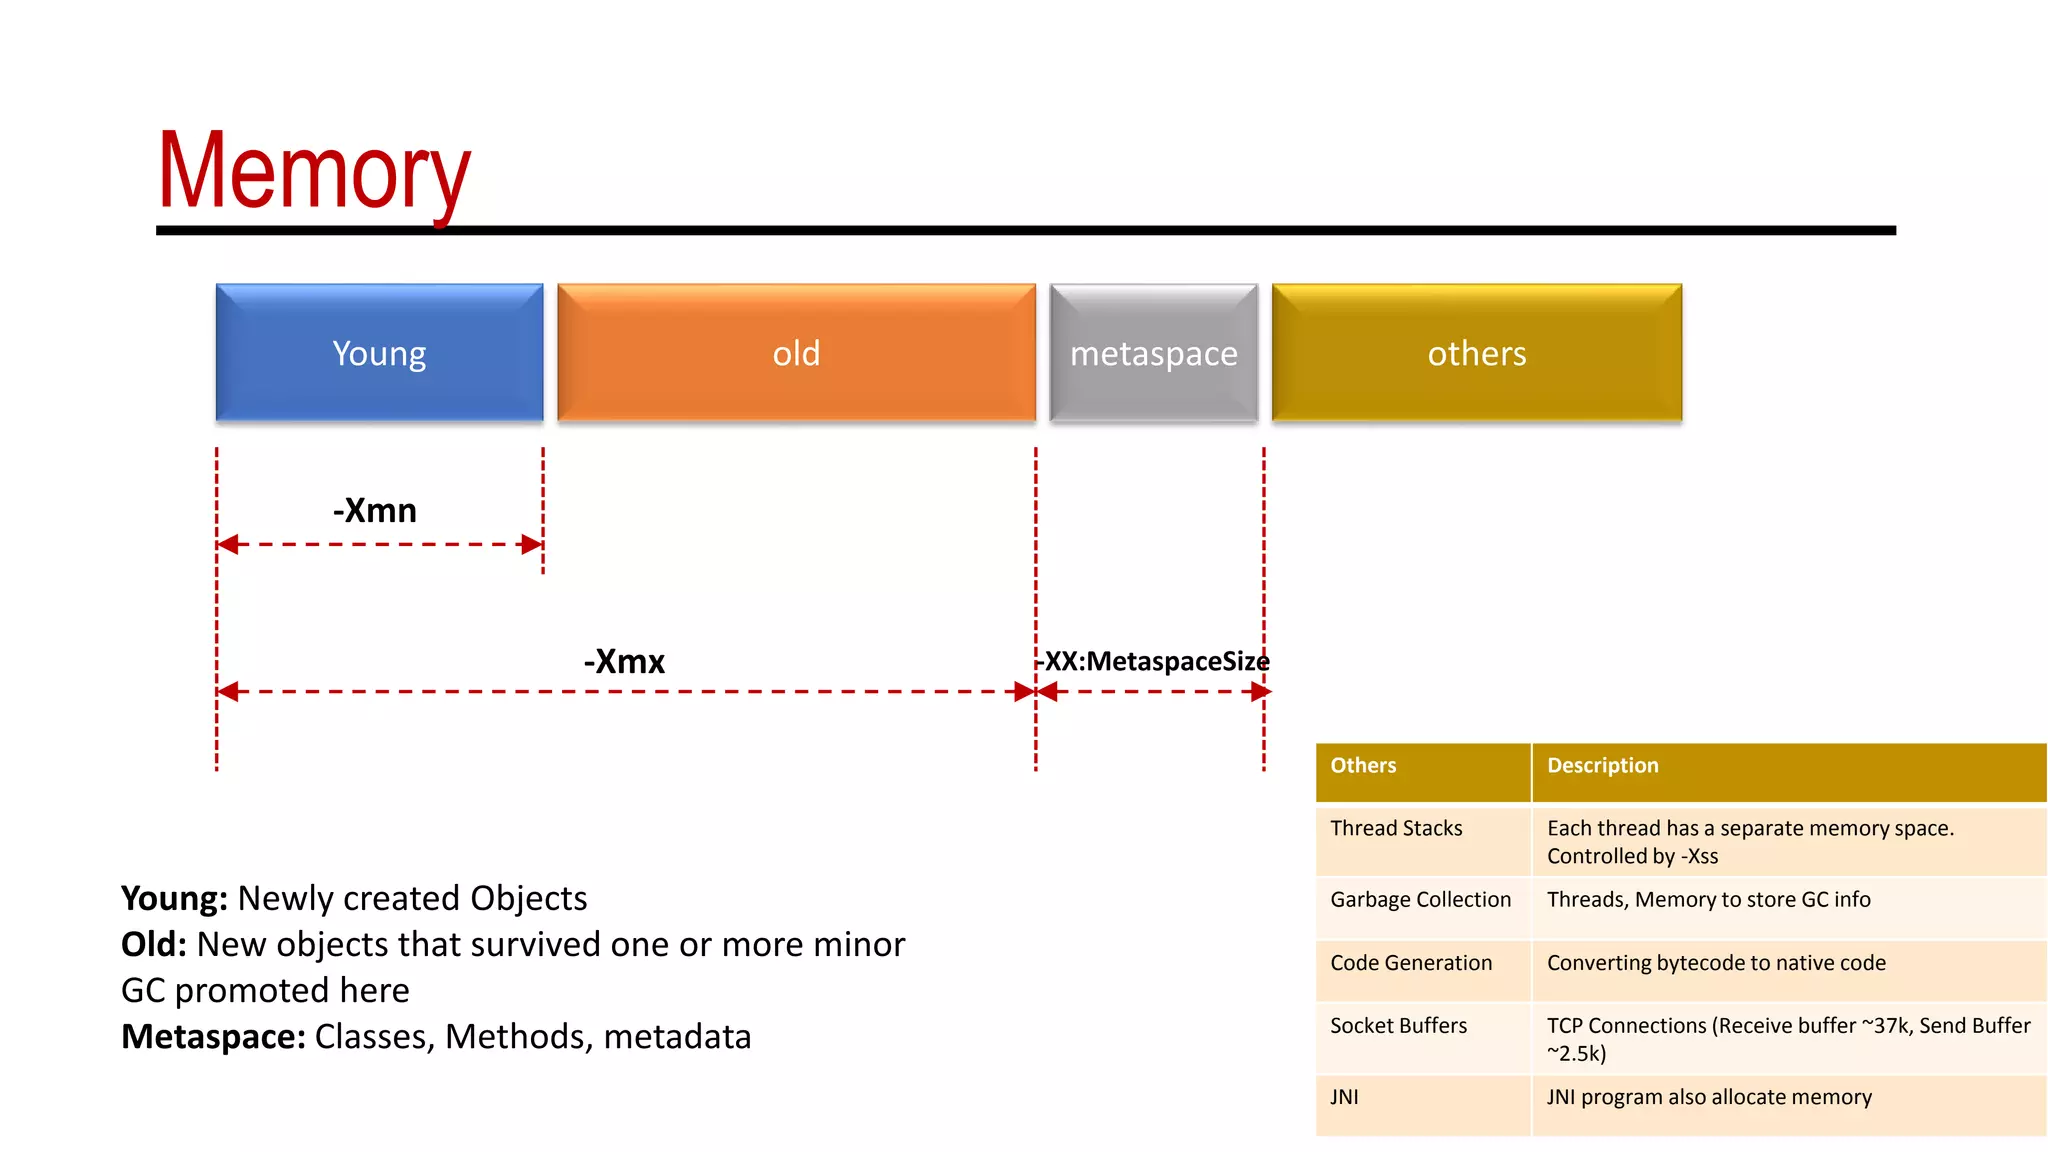
Memory
Young old metaspace others
-Xmn
-Xmx -XX:MetaspaceSize
Young: Newly created Objects
Old: New objects that survived one or more minor
GC promoted here
Metaspace: Classes, Methods, metadata
Others Description
Thread Stacks Each thread has a separate memory space.
Controlled by -Xss
Garbage Collection Threads, Memory to store GC info
Code Generation Converting bytecode to native code
Socket Buffers TCP Connections (Receive buffer ~37k, Send Buffer
~2.5k)
JNI JNI program also allocate memory
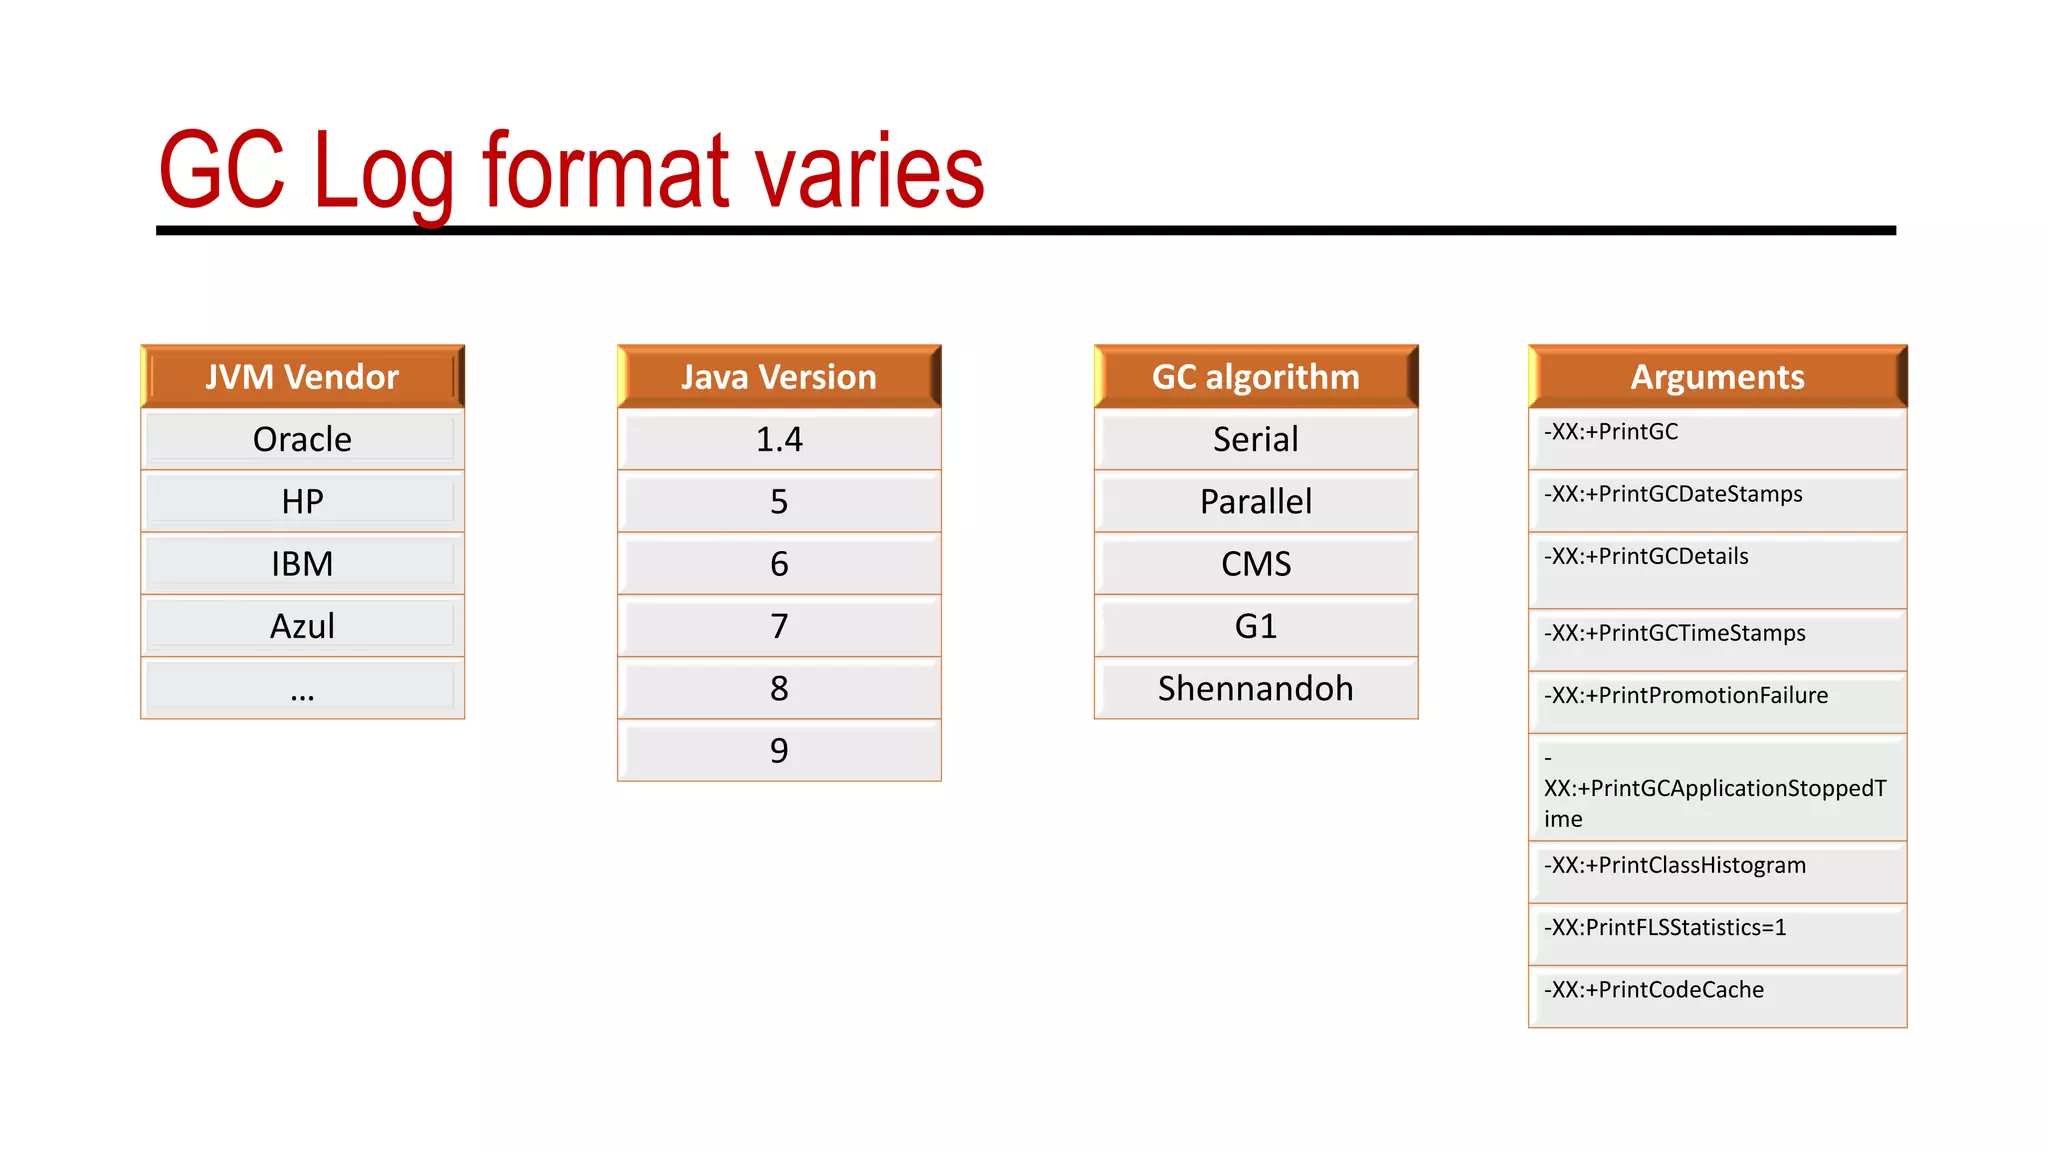
GC Log format varies
JVM Vendor
Oracle
HP
IBM
Azul
…
Java Version
1.4
5
6
7
8
9
GC algorithm
Serial
Parallel
CMS
G1
Shennandoh
Arguments
-XX:+PrintGC
-XX:+PrintGCDateStamps
-XX:+PrintGCDetails
-XX:+PrintGCTimeStamps
-XX:+PrintPromotionFailure
-
XX:+PrintGCApplicationStoppedT
ime
-XX:+PrintClassHistogram
-XX:PrintFLSStatistics=1
-XX:+PrintCodeCache
G1 GC Format2015-09-14T11:58:55.131-0700: 0.519: [GC pause (G1 Evacuation Pause) (young), 0.0096438 secs]
[Parallel Time: 7.9 ms, GC Workers: 8]
[GC Worker Start (ms): Min: 519.4, Avg: 519.6, Max: 520.6, Diff: 1.3]
[Ext Root Scanning (ms): Min: 0.0, Avg: 2.9, Max: 7.3, Diff: 7.3, Sum: 23.4]
[Update RS (ms): Min: 0.0, Avg: 0.0, Max: 0.0, Diff: 0.0, Sum: 0.0]
[Processed Buffers: Min: 0, Avg: 0.0, Max: 0, Diff: 0, Sum: 0]
[Scan RS (ms): Min: 0.0, Avg: 0.0, Max: 0.0, Diff: 0.0, Sum: 0.0]
[Code Root Scanning (ms): Min: 0.0, Avg: 0.0, Max: 0.1, Diff: 0.1, Sum: 0.1]
[Object Copy (ms): Min: 0.0, Avg: 4.2, Max: 7.2, Diff: 7.2, Sum: 34.0]
[Termination (ms): Min: 0.0, Avg: 0.2, Max: 0.4, Diff: 0.4, Sum: 1.7]
[Termination Attempts: Min: 1, Avg: 7.9, Max: 18, Diff: 17, Sum: 63]
[GC Worker Other (ms): Min: 0.0, Avg: 0.0, Max: 0.1, Diff: 0.1, Sum: 0.4]
[GC Worker Total (ms): Min: 6.4, Avg: 7.4, Max: 7.7, Diff: 1.3, Sum: 59.6]
[GC Worker End (ms): Min: 527.0, Avg: 527.1, Max: 527.1, Diff: 0.1]
[Code Root Fixup: 0.0 ms]
[Code Root Purge: 0.0 ms]
[Clear CT: 0.5 ms]
[Other: 1.3 ms]
[Choose CSet: 0.0 ms]
[Ref Proc: 0.7 ms]
[Ref Enq: 0.0 ms]
[Redirty Cards: 0.3 ms]
[Humongous Register: 0.0 ms]
[Humongous Reclaim: 0.0 ms]
[Free CSet: 0.0 ms]
[Eden: 24.0M(24.0M)->0.0B(34.0M) Survivors: 0.0B->3072.0K Heap: 24.0M(252.0M)->3338.0K(252.0M)]
[Times: user=0.06 sys=0.00, real=0.01 secs]
CMS Log formatBefore GC:
Statistics for BinaryTreeDictionary:
------------------------------------
Total Free Space: 2524251
Max Chunk Size: 2519552
Number of Blocks: 13
Av. Block Size: 194173
Tree Height: 8
2016-05-03T04:27:37.503+0000: 30282.678: [ParNew
Desired survivor size 214728704 bytes, new threshold 1 (max 1)
- age 1: 85782640 bytes, 85782640 total
: 3510063K->100856K(3774912K), 0.0516290 secs] 9371816K->6022161K(14260672K)After GC:
Statistics for BinaryTreeDictionary:
------------------------------------
Total Free Space: 530579346
Max Chunk Size: 332576815
Number of Blocks: 7178
Av. Block Size: 73917
Tree Height: 44
After GC:
Statistics for BinaryTreeDictionary:
------------------------------------
Total Free Space: 2524251
Max Chunk Size: 2519552
Number of Blocks: 13
Av. Block Size: 194173
Tree Height: 8
, 0.0552970 secs] [Times: user=0.67 sys=0.00, real=0.06 secs]
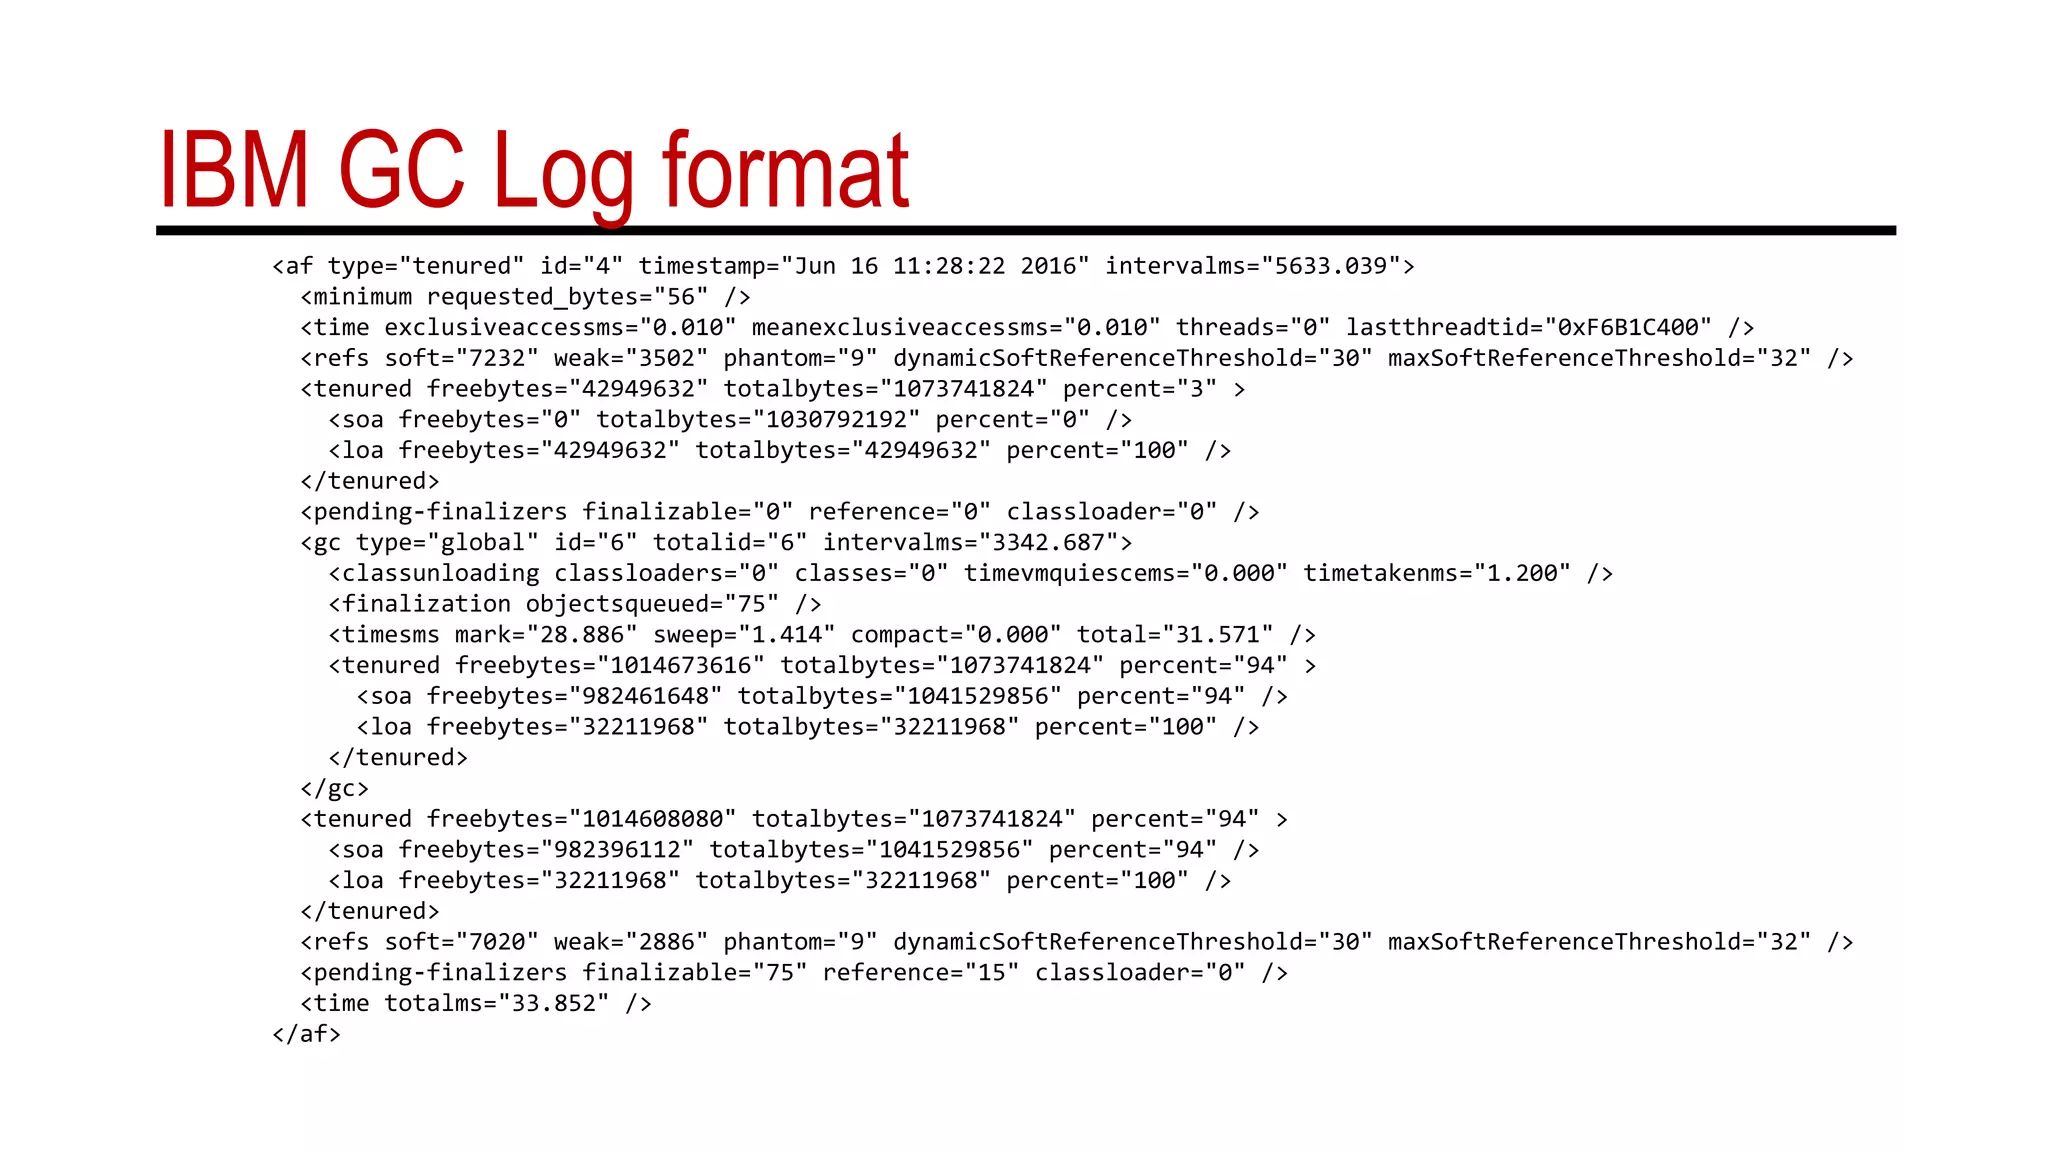
IBM GC Log format
<af type="tenured" id="4" timestamp="Jun 16 11:28:22 2016" intervalms="5633.039">
<minimum requested_bytes="56" />
<time exclusiveaccessms="0.010" meanexclusiveaccessms="0.010" threads="0" lastthreadtid="0xF6B1C400" />
<refs soft="7232" weak="3502" phantom="9" dynamicSoftReferenceThreshold="30" maxSoftReferenceThreshold="32" />
<tenured freebytes="42949632" totalbytes="1073741824" percent="3" >
<soa freebytes="0" totalbytes="1030792192" percent="0" />
<loa freebytes="42949632" totalbytes="42949632" percent="100" />
</tenured>
<pending-finalizers finalizable="0" reference="0" classloader="0" />
<gc type="global" id="6" totalid="6" intervalms="3342.687">
<classunloading classloaders="0" classes="0" timevmquiescems="0.000" timetakenms="1.200" />
<finalization objectsqueued="75" />
<timesms mark="28.886" sweep="1.414" compact="0.000" total="31.571" />
<tenured freebytes="1014673616" totalbytes="1073741824" percent="94" >
<soa freebytes="982461648" totalbytes="1041529856" percent="94" />
<loa freebytes="32211968" totalbytes="32211968" percent="100" />
</tenured>
</gc>
<tenured freebytes="1014608080" totalbytes="1073741824" percent="94" >
<soa freebytes="982396112" totalbytes="1041529856" percent="94" />
<loa freebytes="32211968" totalbytes="32211968" percent="100" />
</tenured>
<refs soft="7020" weak="2886" phantom="9" dynamicSoftReferenceThreshold="30" maxSoftReferenceThreshold="32" />
<pending-finalizers finalizable="75" reference="15" classloader="0" />
<time totalms="33.852" />
</af>
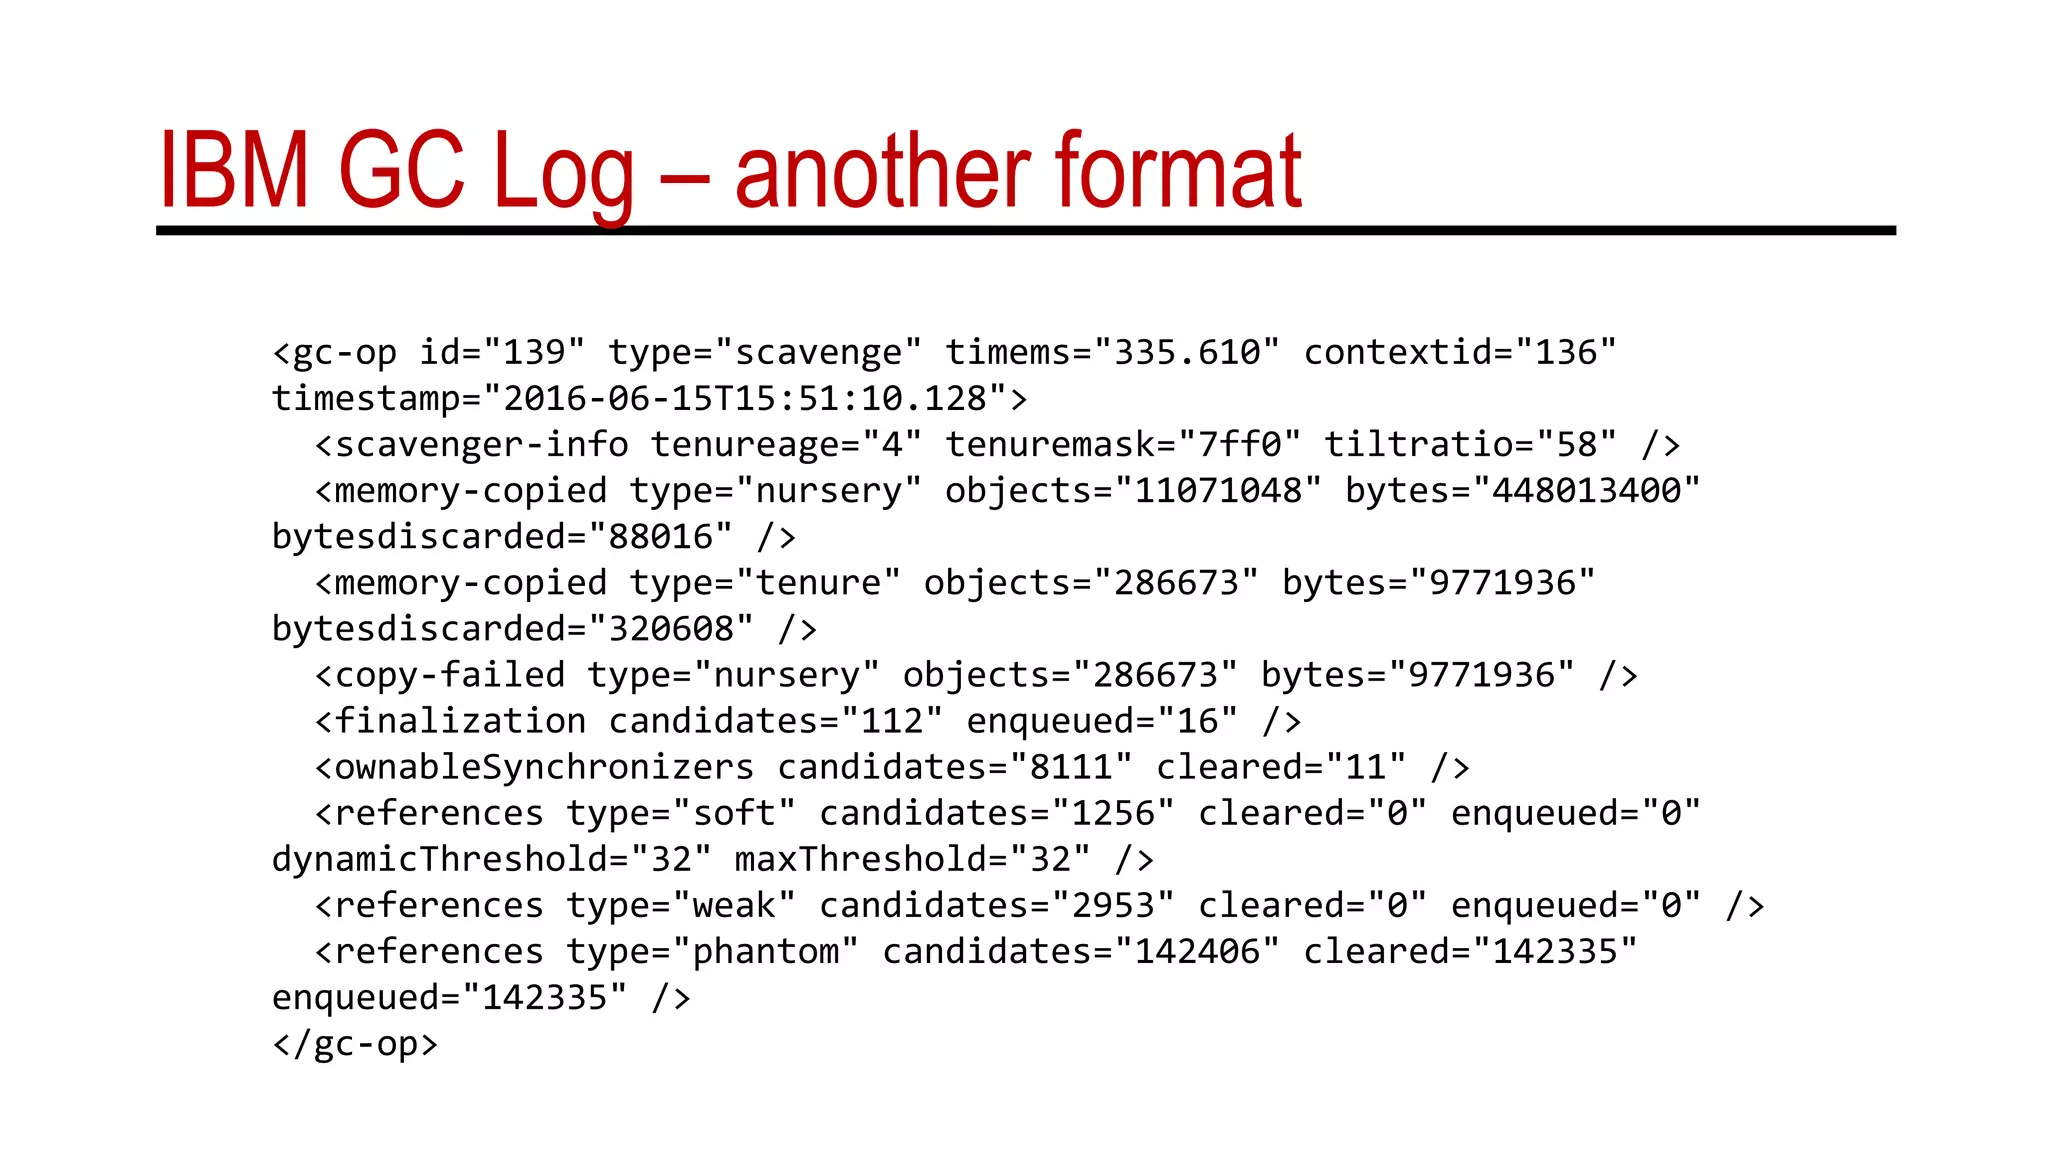
IBM GC Log – another format
<gc-op id="139" type="scavenge" timems="335.610" contextid="136"
timestamp="2016-06-15T15:51:10.128">
<scavenger-info tenureage="4" tenuremask="7ff0" tiltratio="58" />
<memory-copied type="nursery" objects="11071048" bytes="448013400"
bytesdiscarded="88016" />
<memory-copied type="tenure" objects="286673" bytes="9771936"
bytesdiscarded="320608" />
<copy-failed type="nursery" objects="286673" bytes="9771936" />
<finalization candidates="112" enqueued="16" />
<ownableSynchronizers candidates="8111" cleared="11" />
<references type="soft" candidates="1256" cleared="0" enqueued="0"
dynamicThreshold="32" maxThreshold="32" />
<references type="weak" candidates="2953" cleared="0" enqueued="0" />
<references type="phantom" candidates="142406" cleared="142335"
enqueued="142335" />
</gc-op>
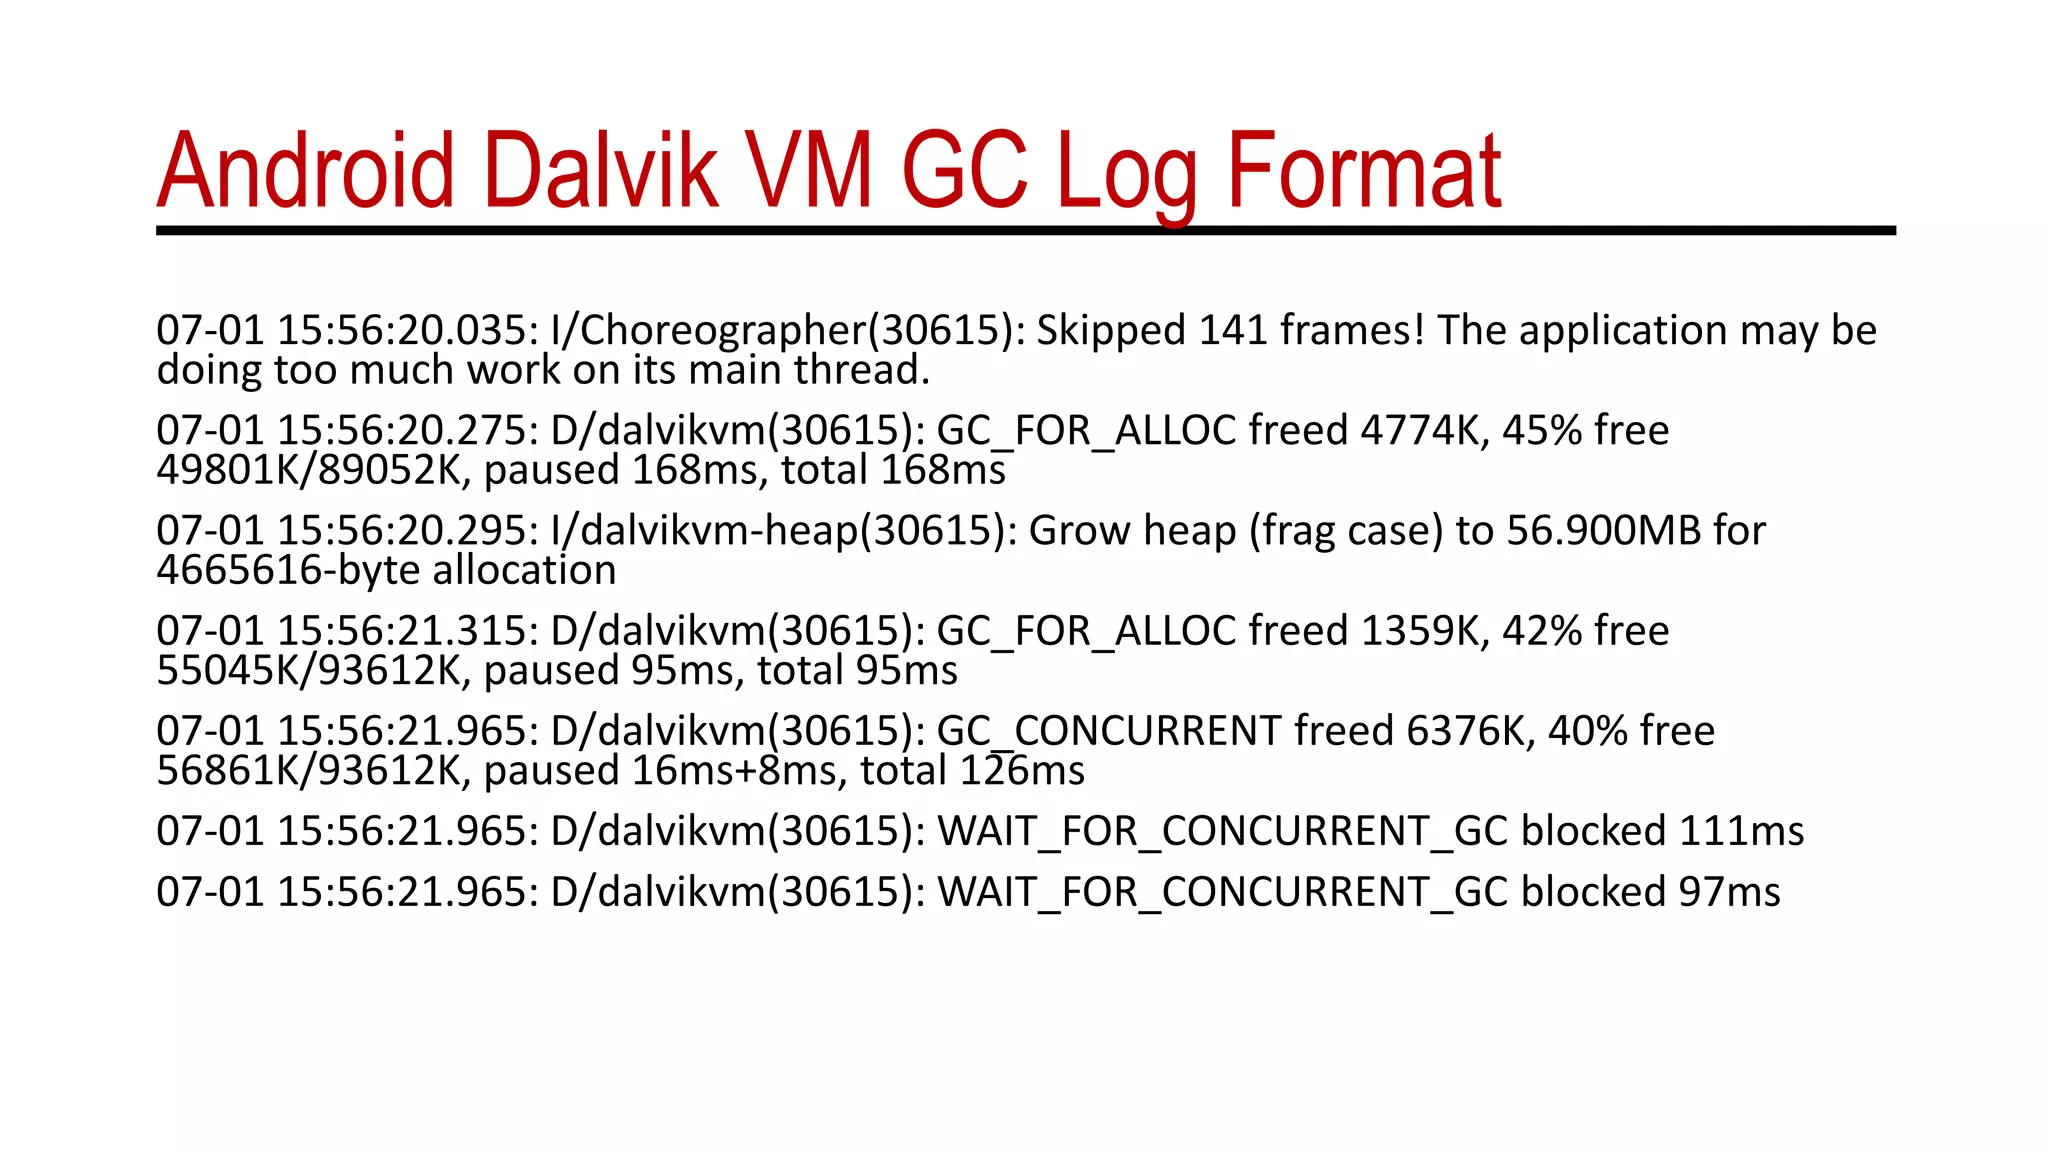
Android Dalvik VM GC Log Format
07-01 15:56:20.035: I/Choreographer(30615): Skipped 141 frames! The application may be
doing too much work on its main thread.
07-01 15:56:20.275: D/dalvikvm(30615): GC_FOR_ALLOC freed 4774K, 45% free
49801K/89052K, paused 168ms, total 168ms
07-01 15:56:20.295: I/dalvikvm-heap(30615): Grow heap (frag case) to 56.900MB for
4665616-byte allocation
07-01 15:56:21.315: D/dalvikvm(30615): GC_FOR_ALLOC freed 1359K, 42% free
55045K/93612K, paused 95ms, total 95ms
07-01 15:56:21.965: D/dalvikvm(30615): GC_CONCURRENT freed 6376K, 40% free
56861K/93612K, paused 16ms+8ms, total 126ms
07-01 15:56:21.965: D/dalvikvm(30615): WAIT_FOR_CONCURRENT_GC blocked 111ms
07-01 15:56:21.965: D/dalvikvm(30615): WAIT_FOR_CONCURRENT_GC blocked 97ms
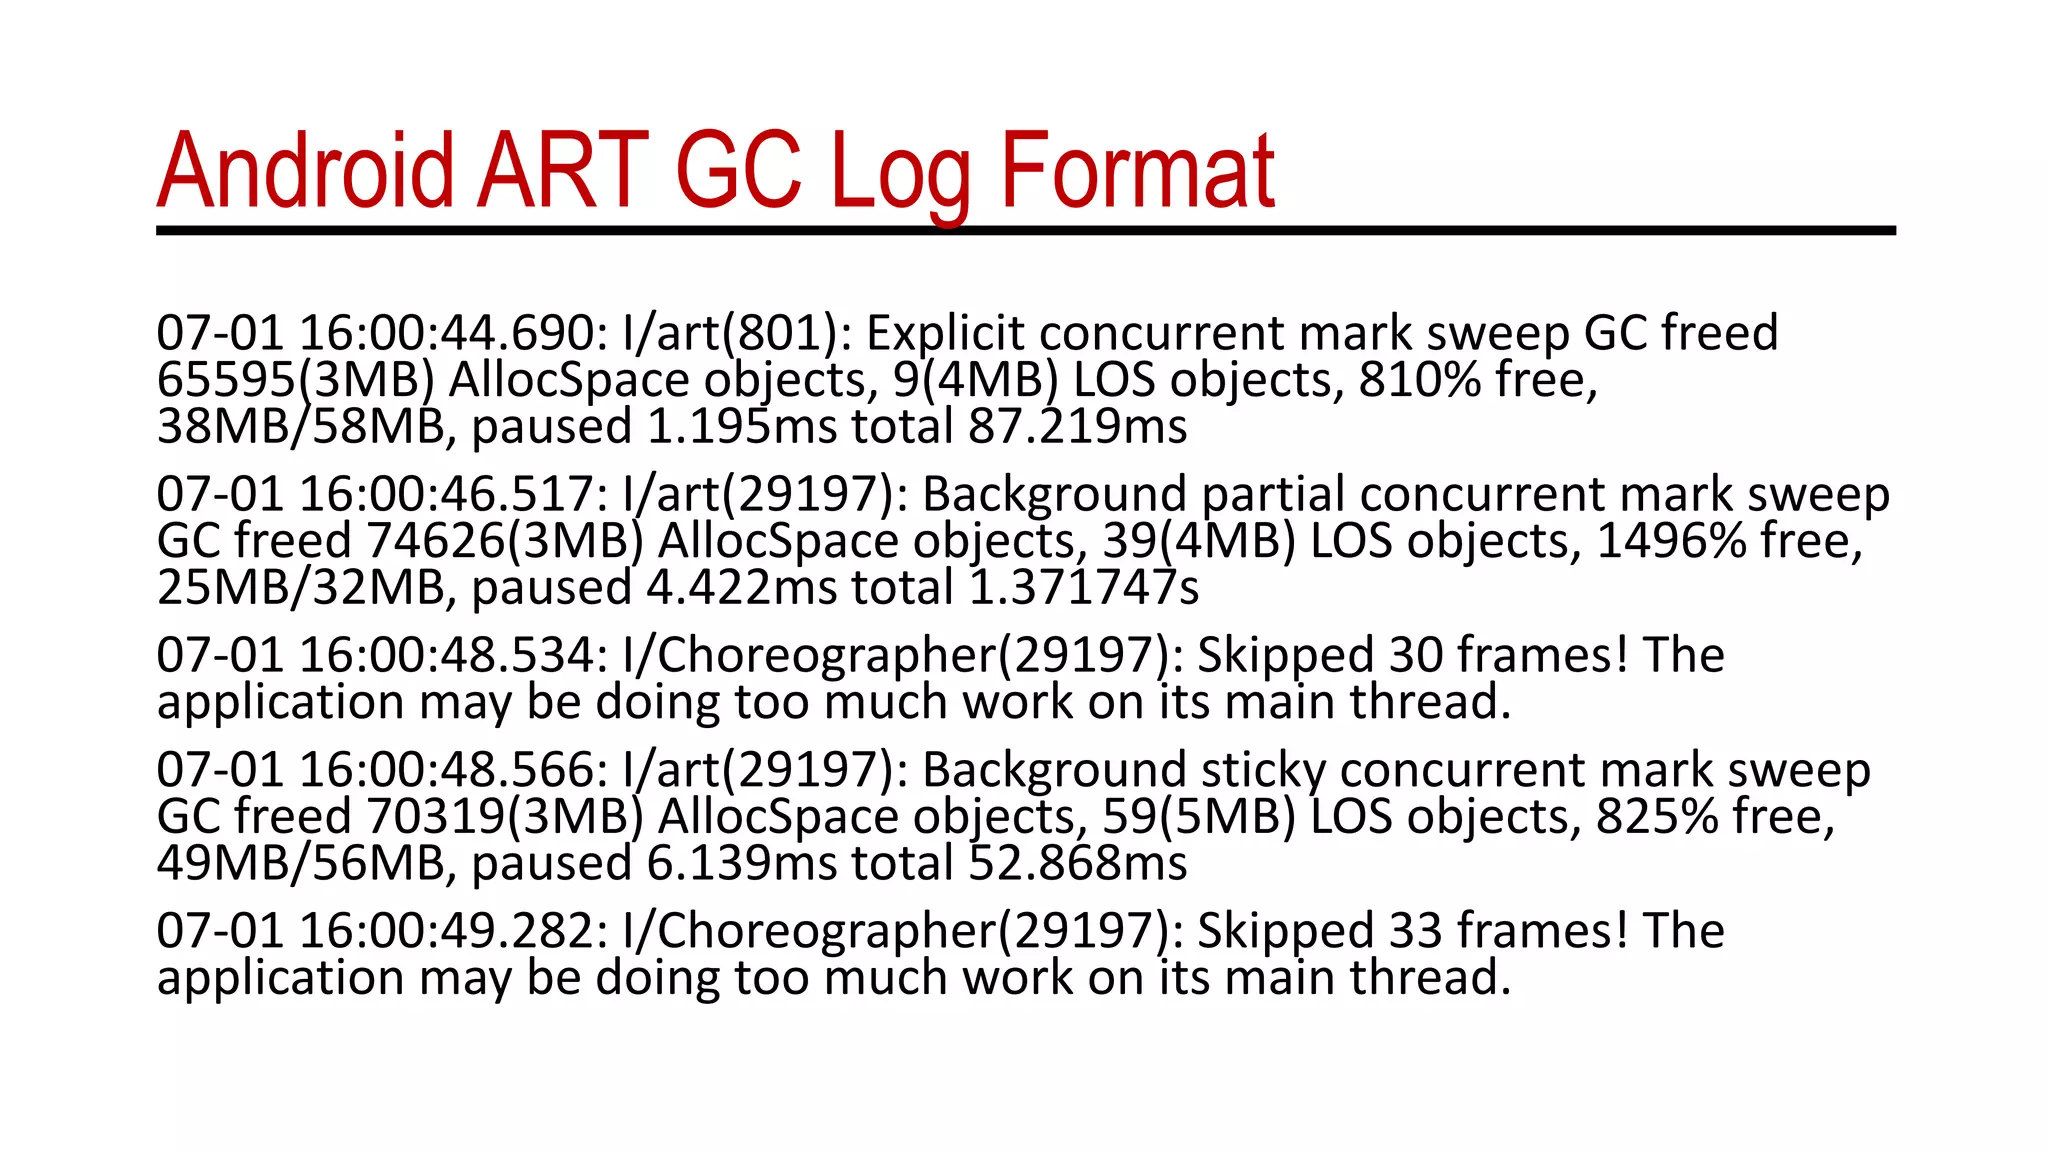
Android ART GC Log Format
07-01 16:00:44.690: I/art(801): Explicit concurrent mark sweep GC freed
65595(3MB) AllocSpace objects, 9(4MB) LOS objects, 810% free,
38MB/58MB, paused 1.195ms total 87.219ms
07-01 16:00:46.517: I/art(29197): Background partial concurrent mark sweep
GC freed 74626(3MB) AllocSpace objects, 39(4MB) LOS objects, 1496% free,
25MB/32MB, paused 4.422ms total 1.371747s
07-01 16:00:48.534: I/Choreographer(29197): Skipped 30 frames! The
application may be doing too much work on its main thread.
07-01 16:00:48.566: I/art(29197): Background sticky concurrent mark sweep
GC freed 70319(3MB) AllocSpace objects, 59(5MB) LOS objects, 825% free,
49MB/56MB, paused 6.139ms total 52.868ms
07-01 16:00:49.282: I/Choreographer(29197): Skipped 33 frames! The
application may be doing too much work on its main thread.
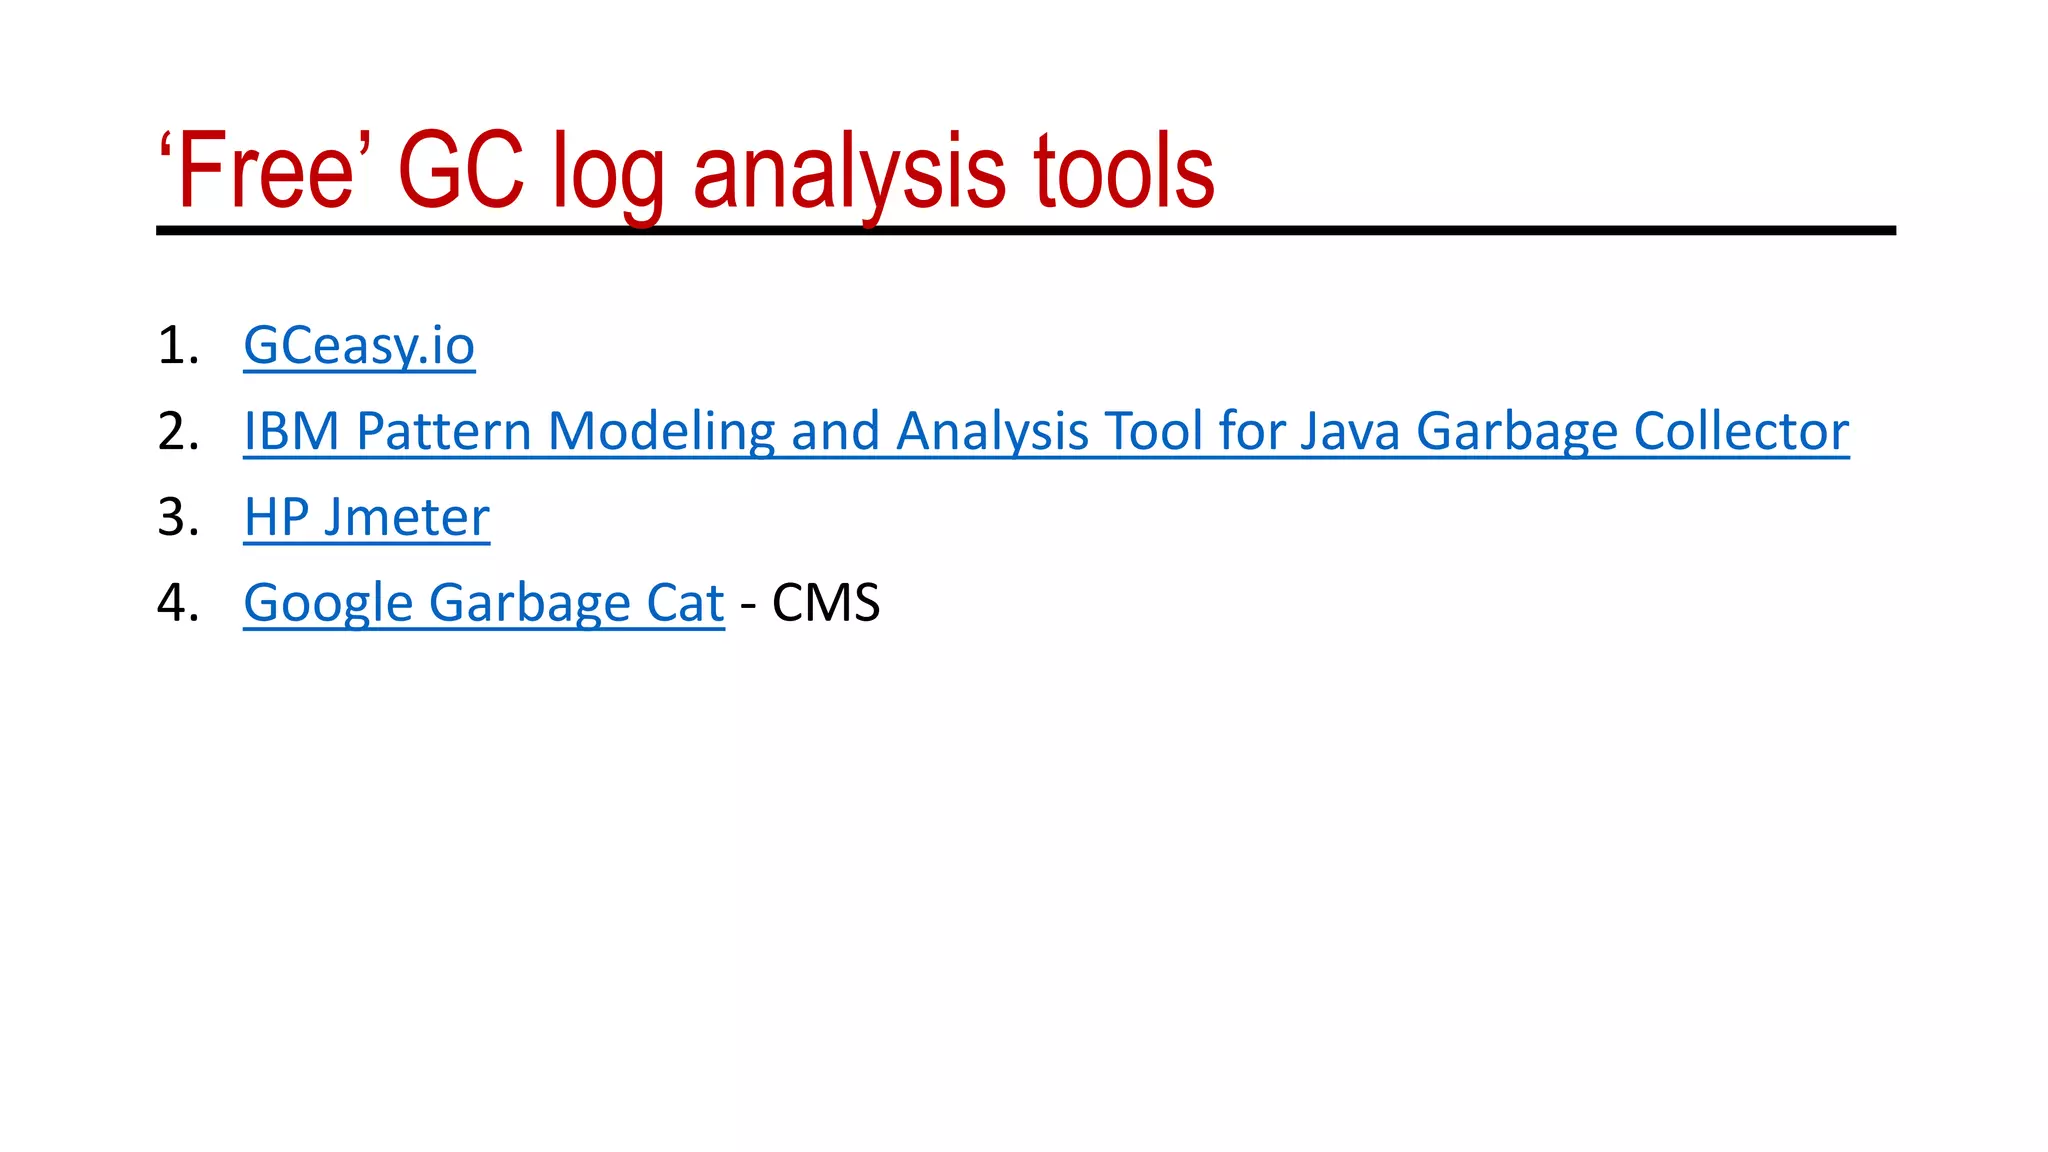
‘Free’ GC log analysis tools
1. GCeasy.io
2. IBM Pattern Modeling and Analysis Tool for Java Garbage Collector
3. HP Jmeter
4. Google Garbage Cat - CMS
Troubleshooting
Real world problems
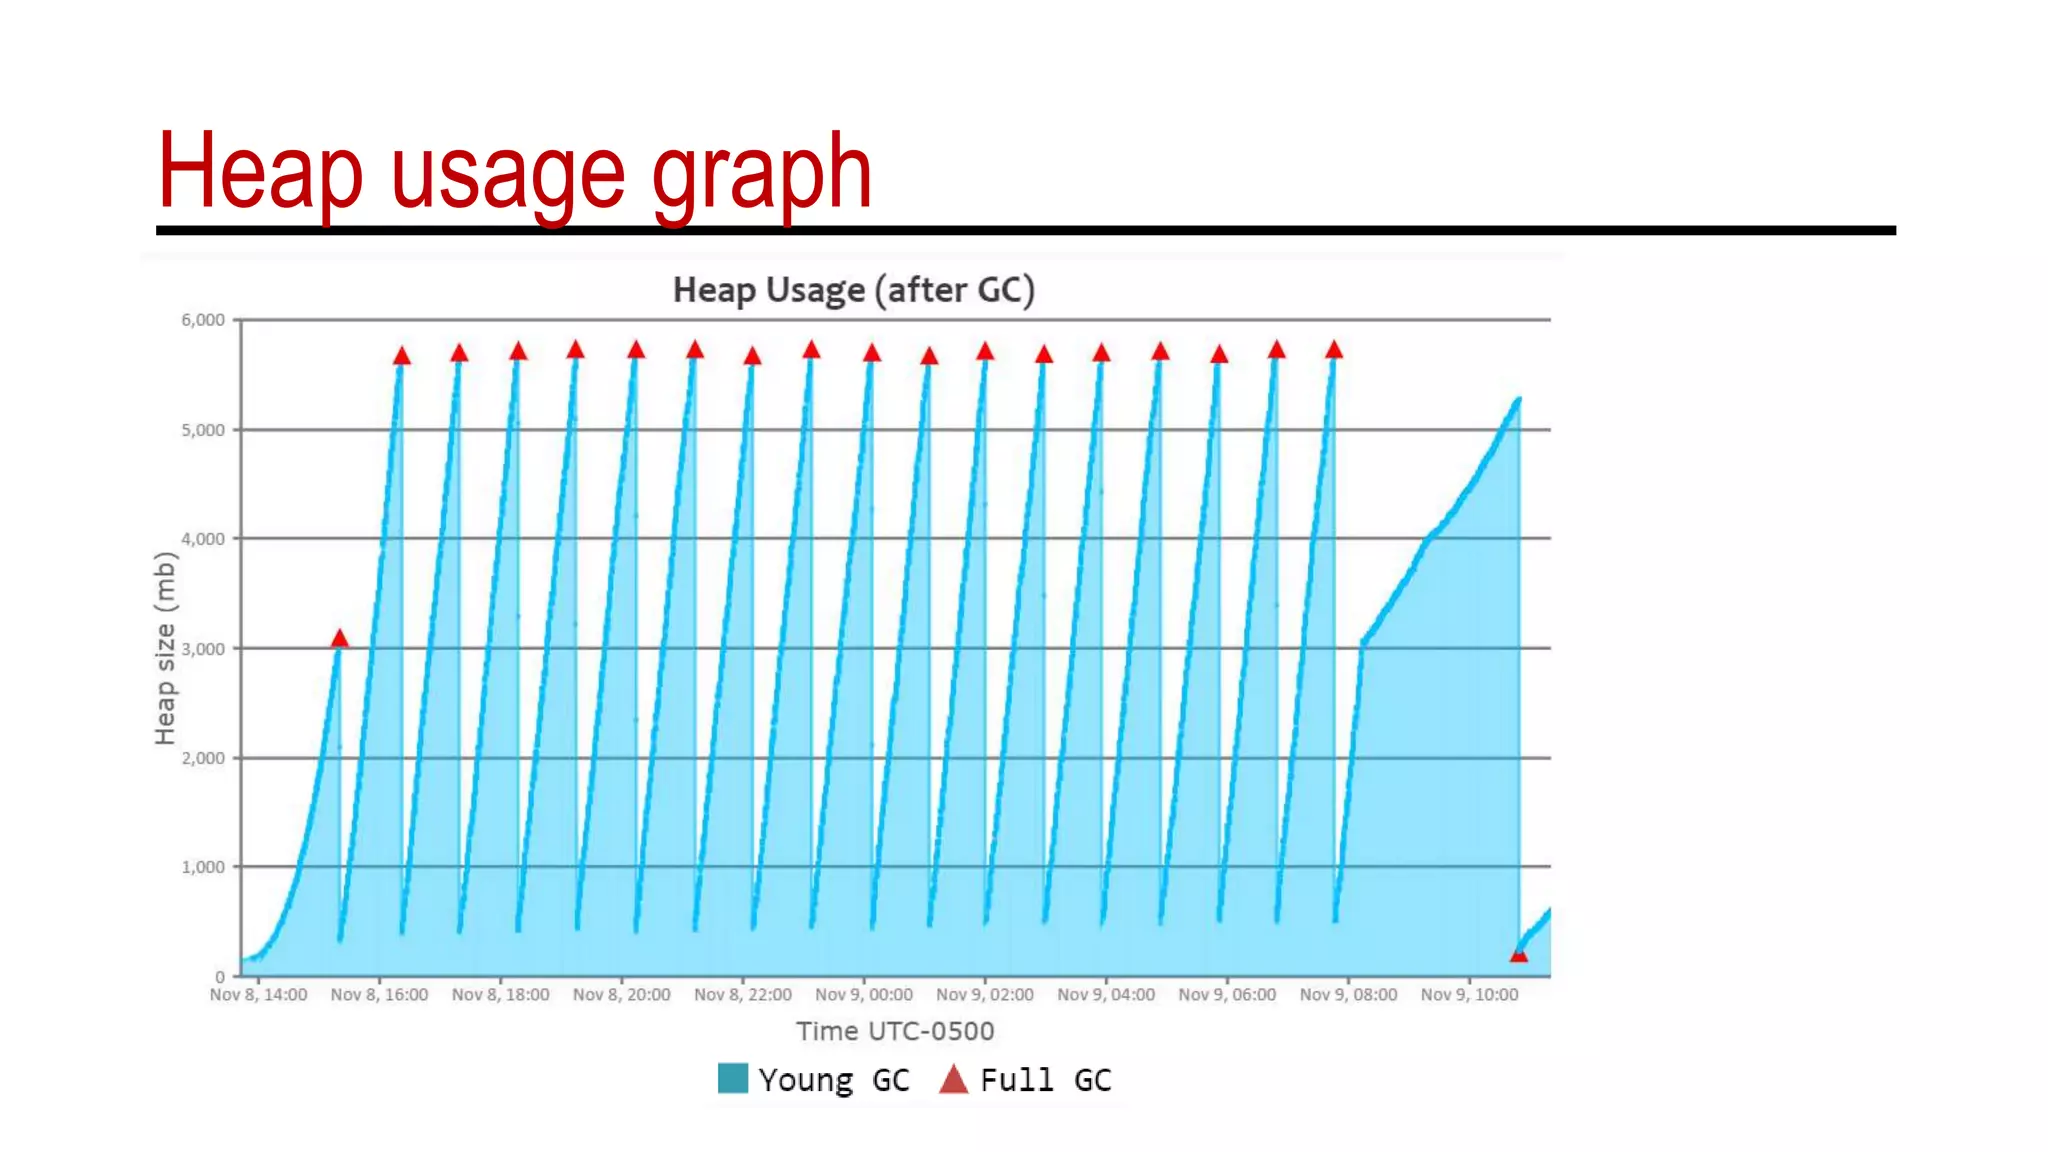
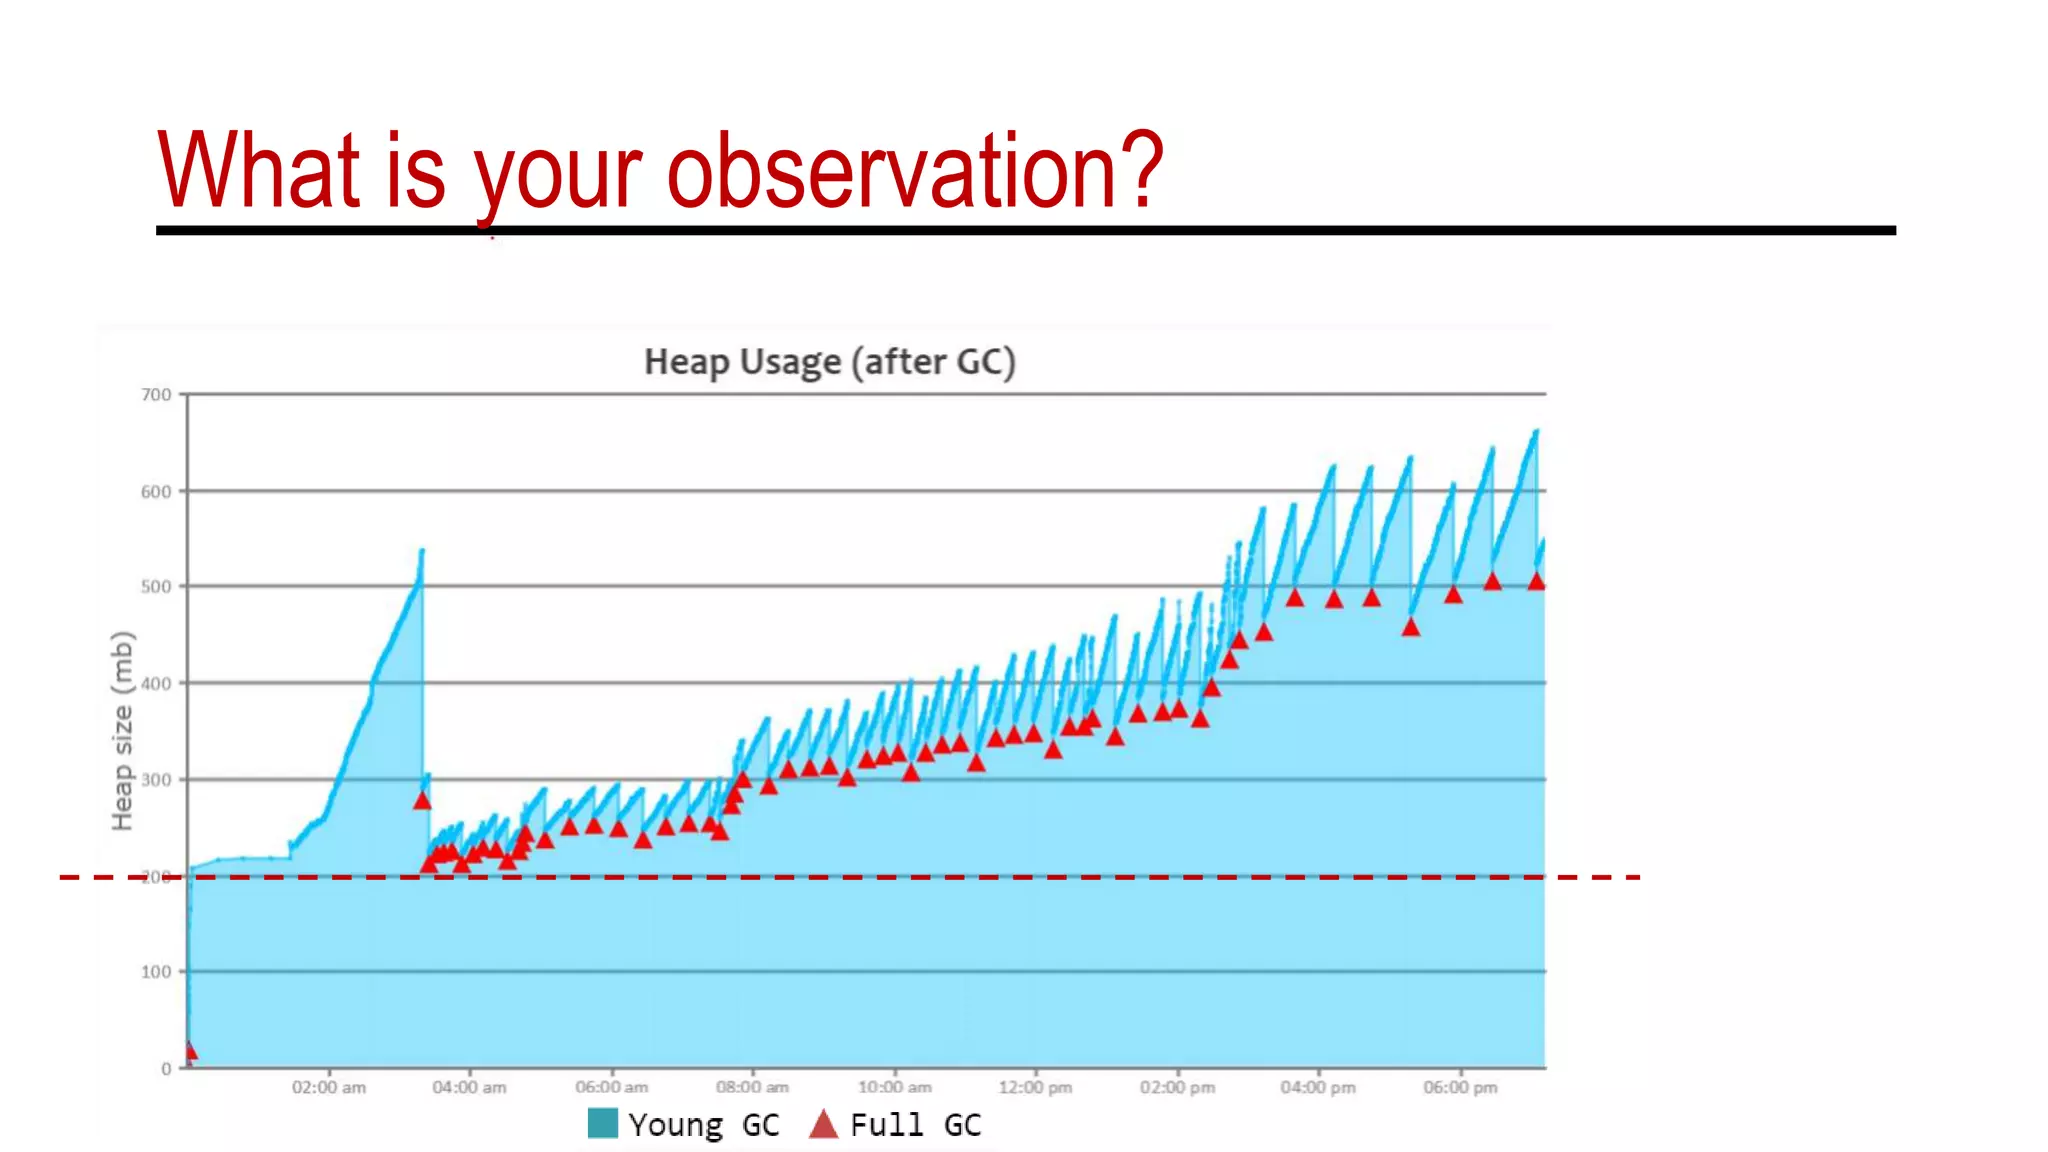
Heap usage graph
What is your observation?
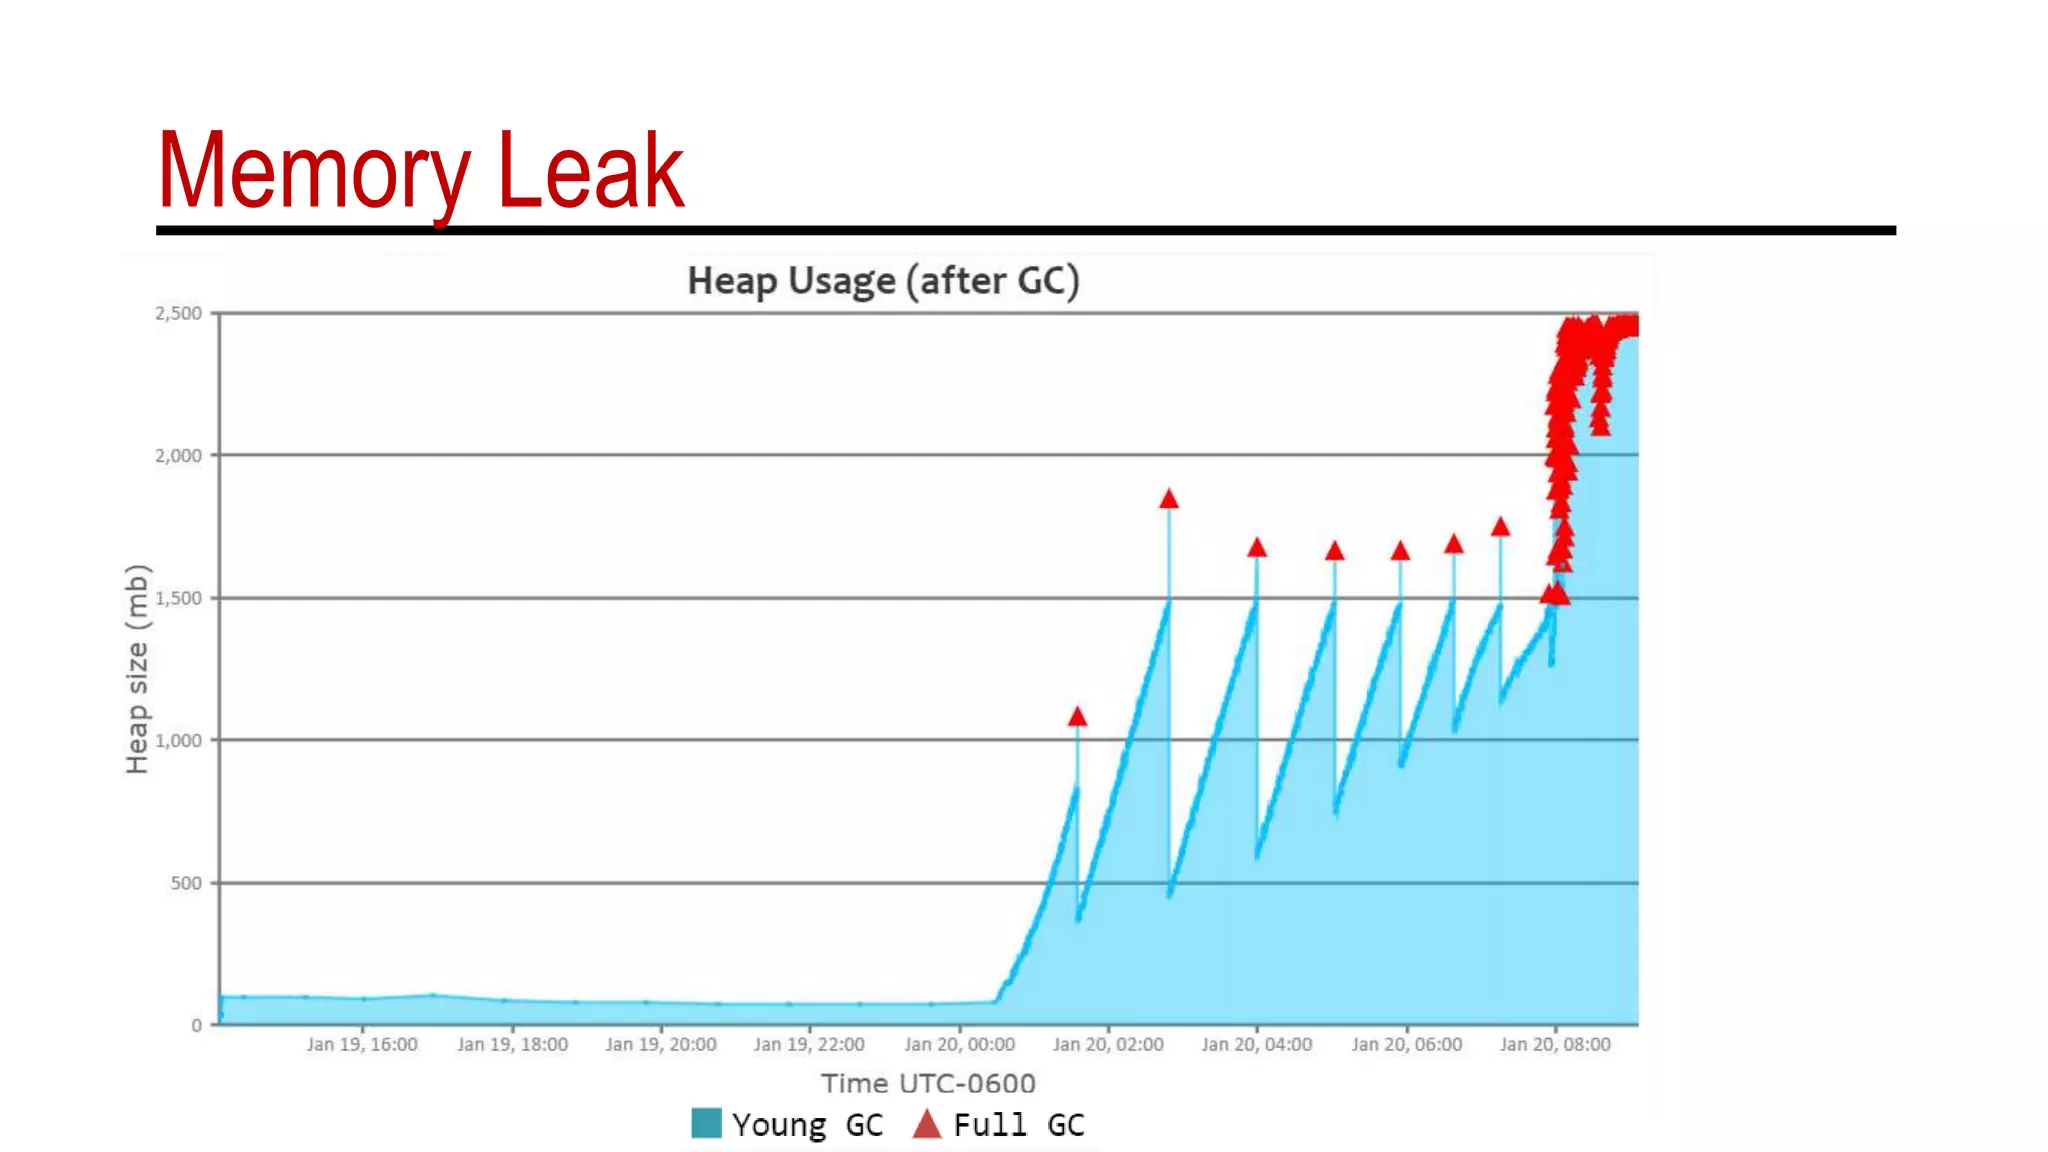
Memory Leak
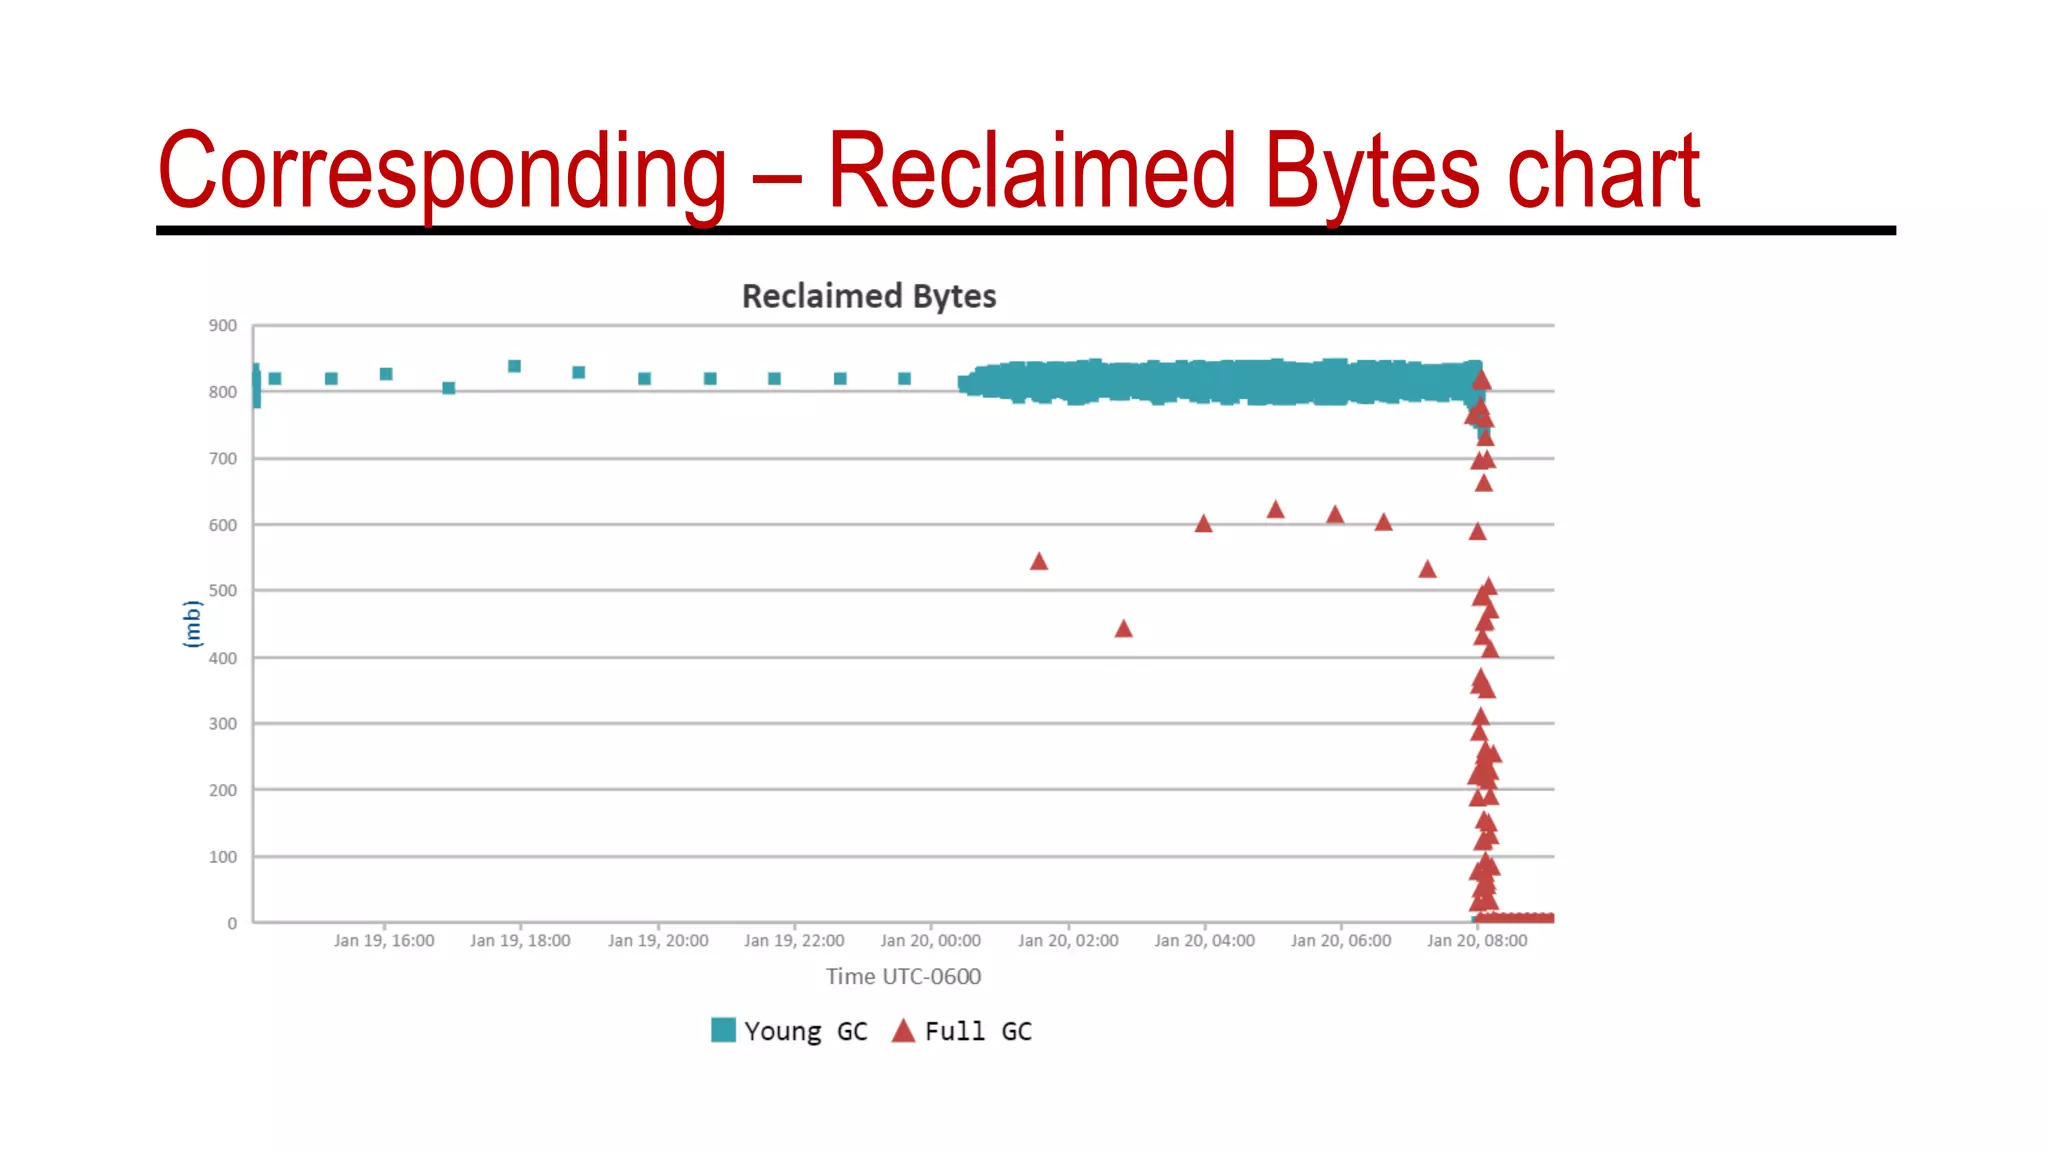
Corresponding – Reclaimed Bytes chart
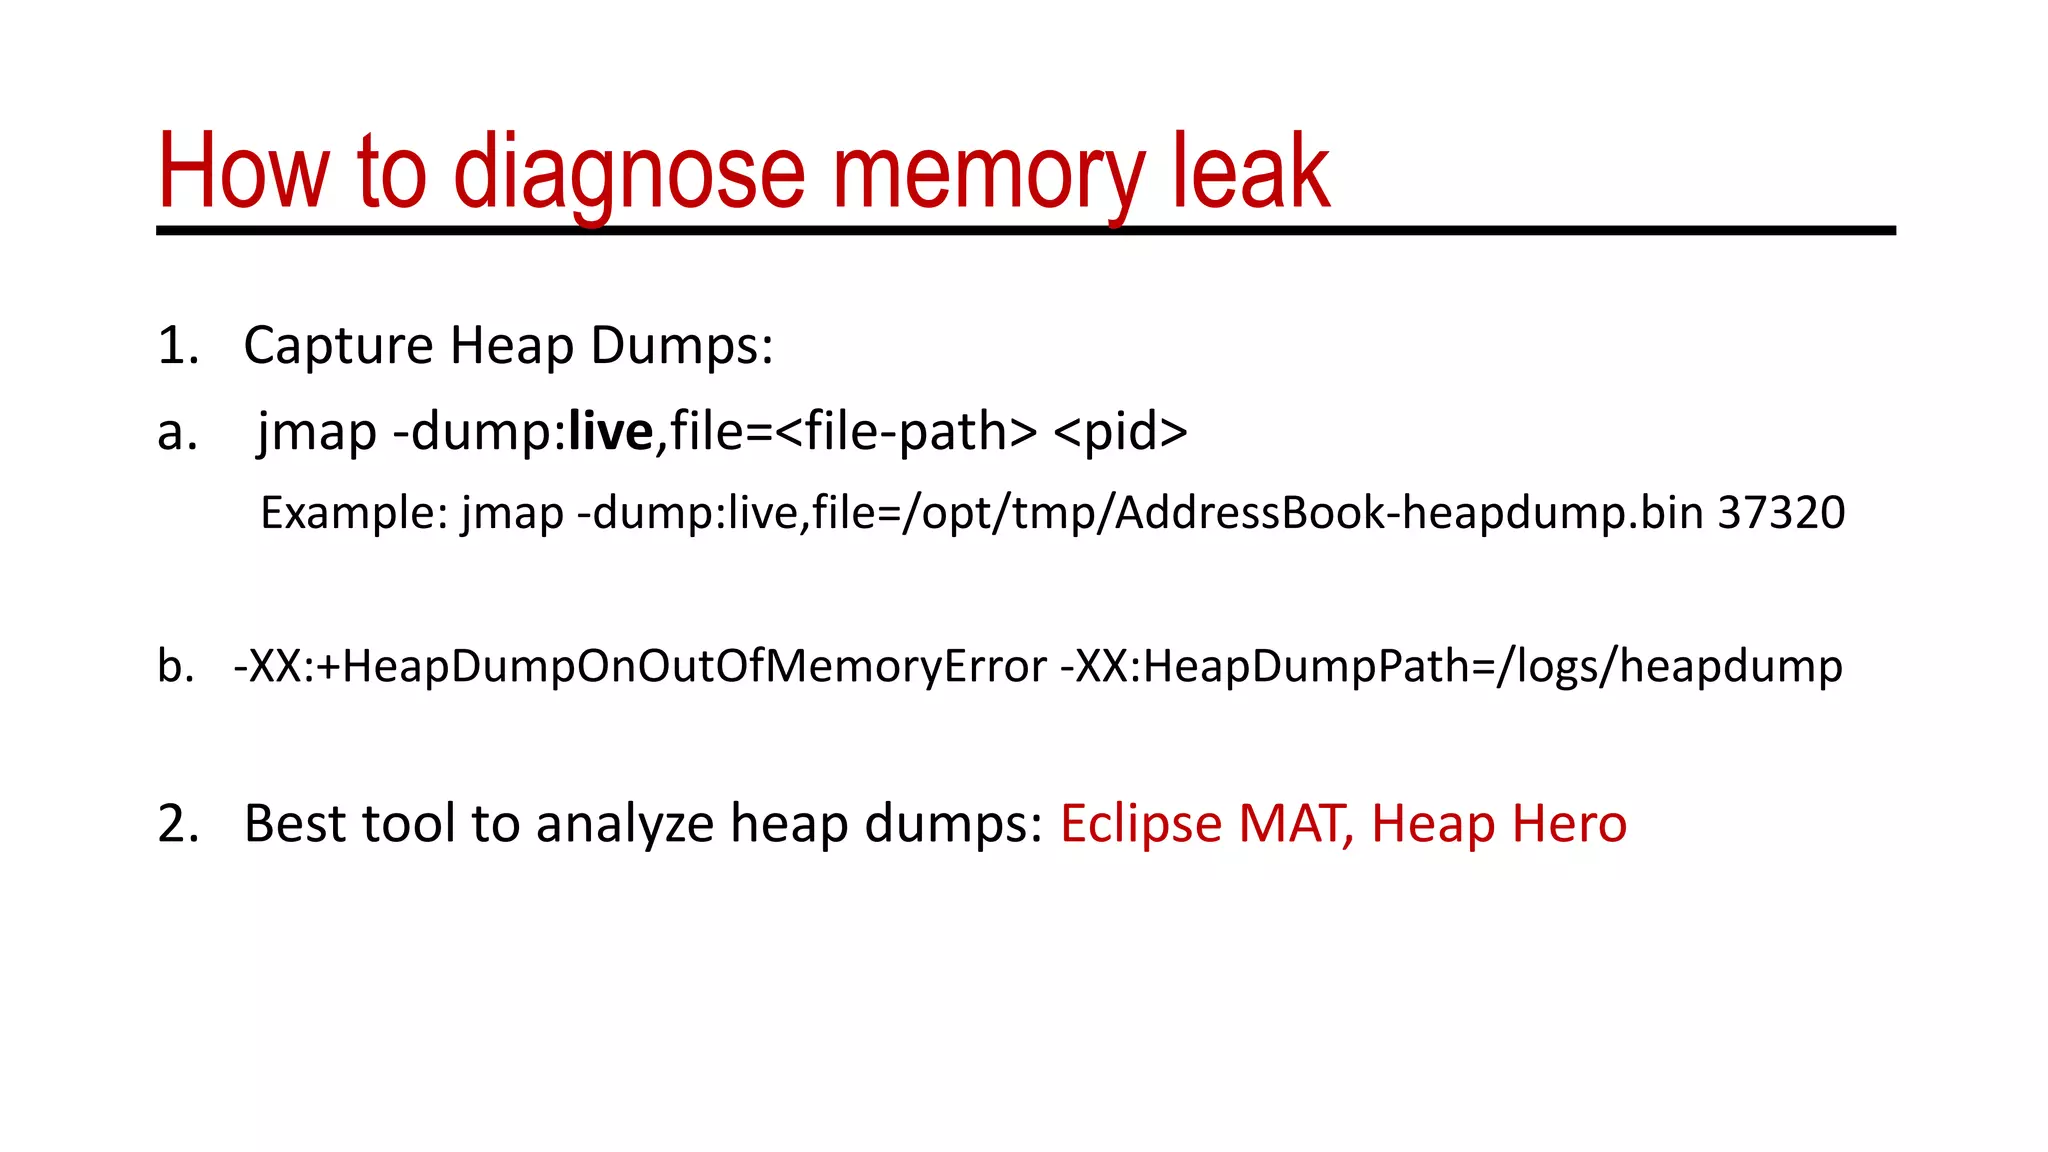
How to diagnose memory leak
1. Capture Heap Dumps:
a. jmap -dump:live,file=<file-path> <pid>
Example: jmap -dump:live,file=/opt/tmp/AddressBook-heapdump.bin 37320
b. -XX:+HeapDumpOnOutOfMemoryError -XX:HeapDumpPath=/logs/heapdump
2. Best tool to analyze heap dumps: Eclipse MAT, Heap Hero
Sample Memory leak Program
public class SampleLeakApp {
public static Map<String, String> myMap = new HashMap<>();
public static void main(String args[]) {
long counter = 0;
while (true) {
myMap.put("key" + counter++, UUID.randomUUID() + "");
}
}
}
Let’s analyze heapdump of this program
Reduce GC pause time
https://blog.gceasy.io/2016/11/22/reduce-long-gc-pauses/
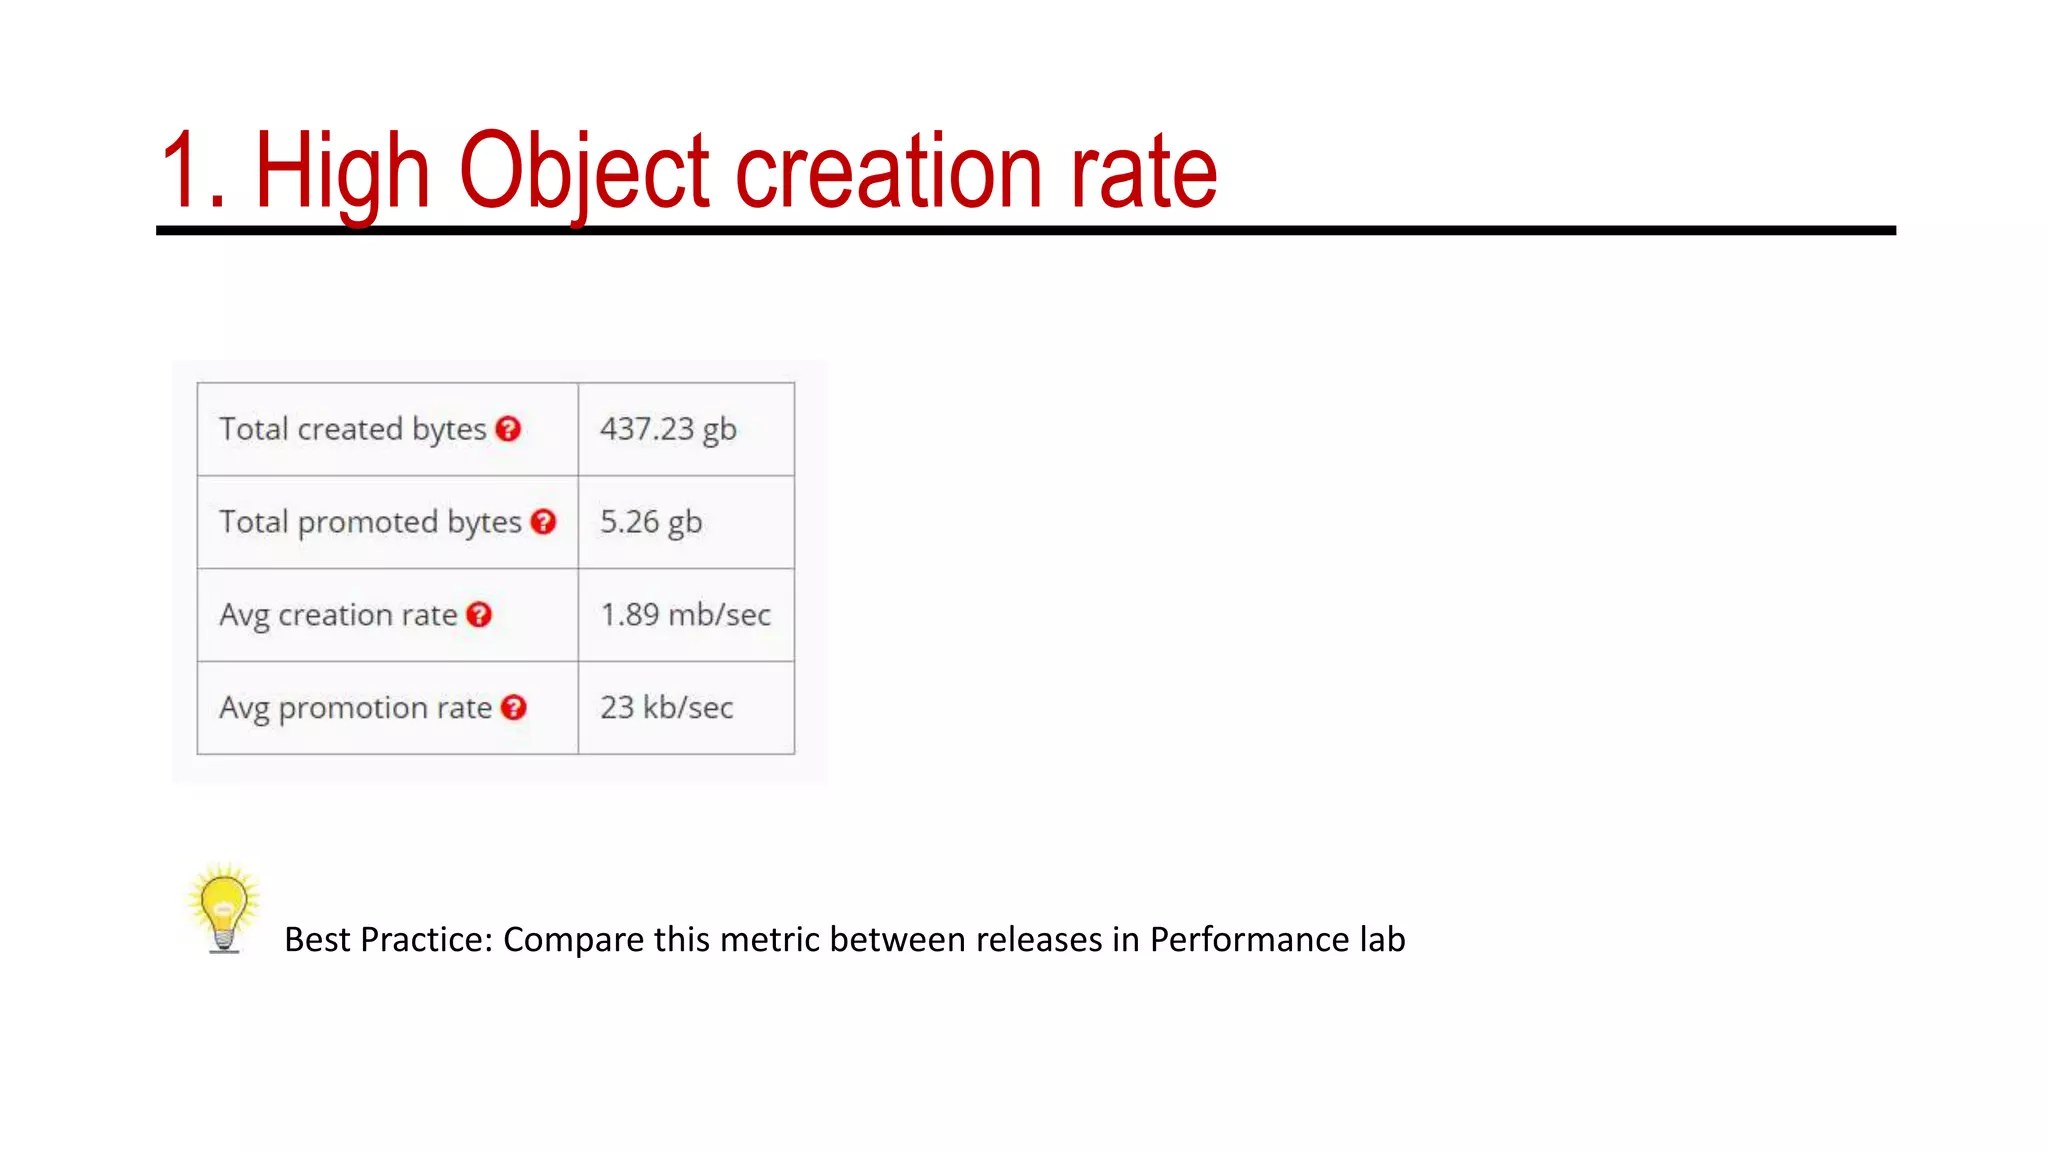
1. High Object creation rate
Best Practice: Compare this metric between releases in Performance lab
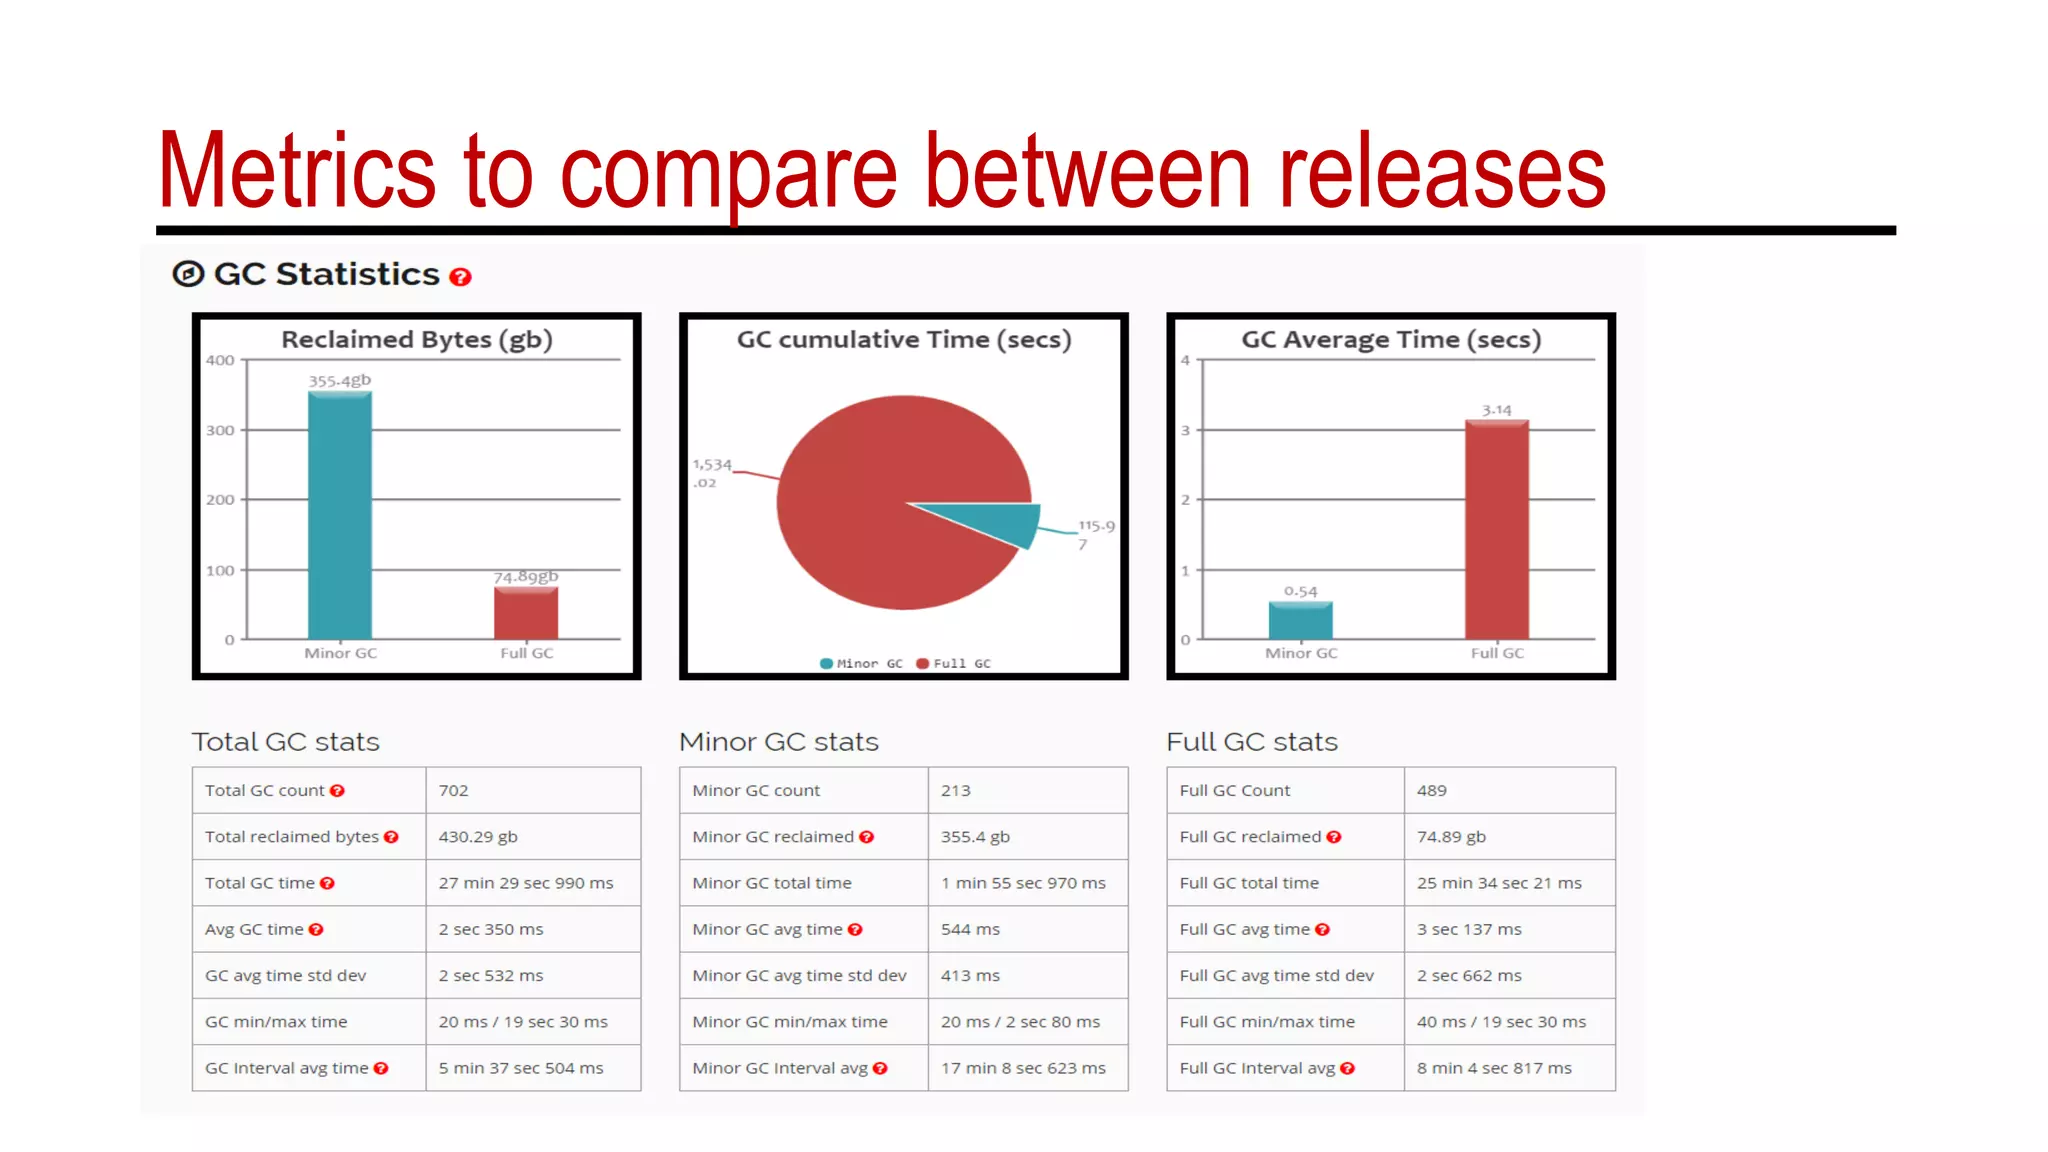
Metrics to compare between releases
Reduce memory consumption
• Less Memory. More Victory.
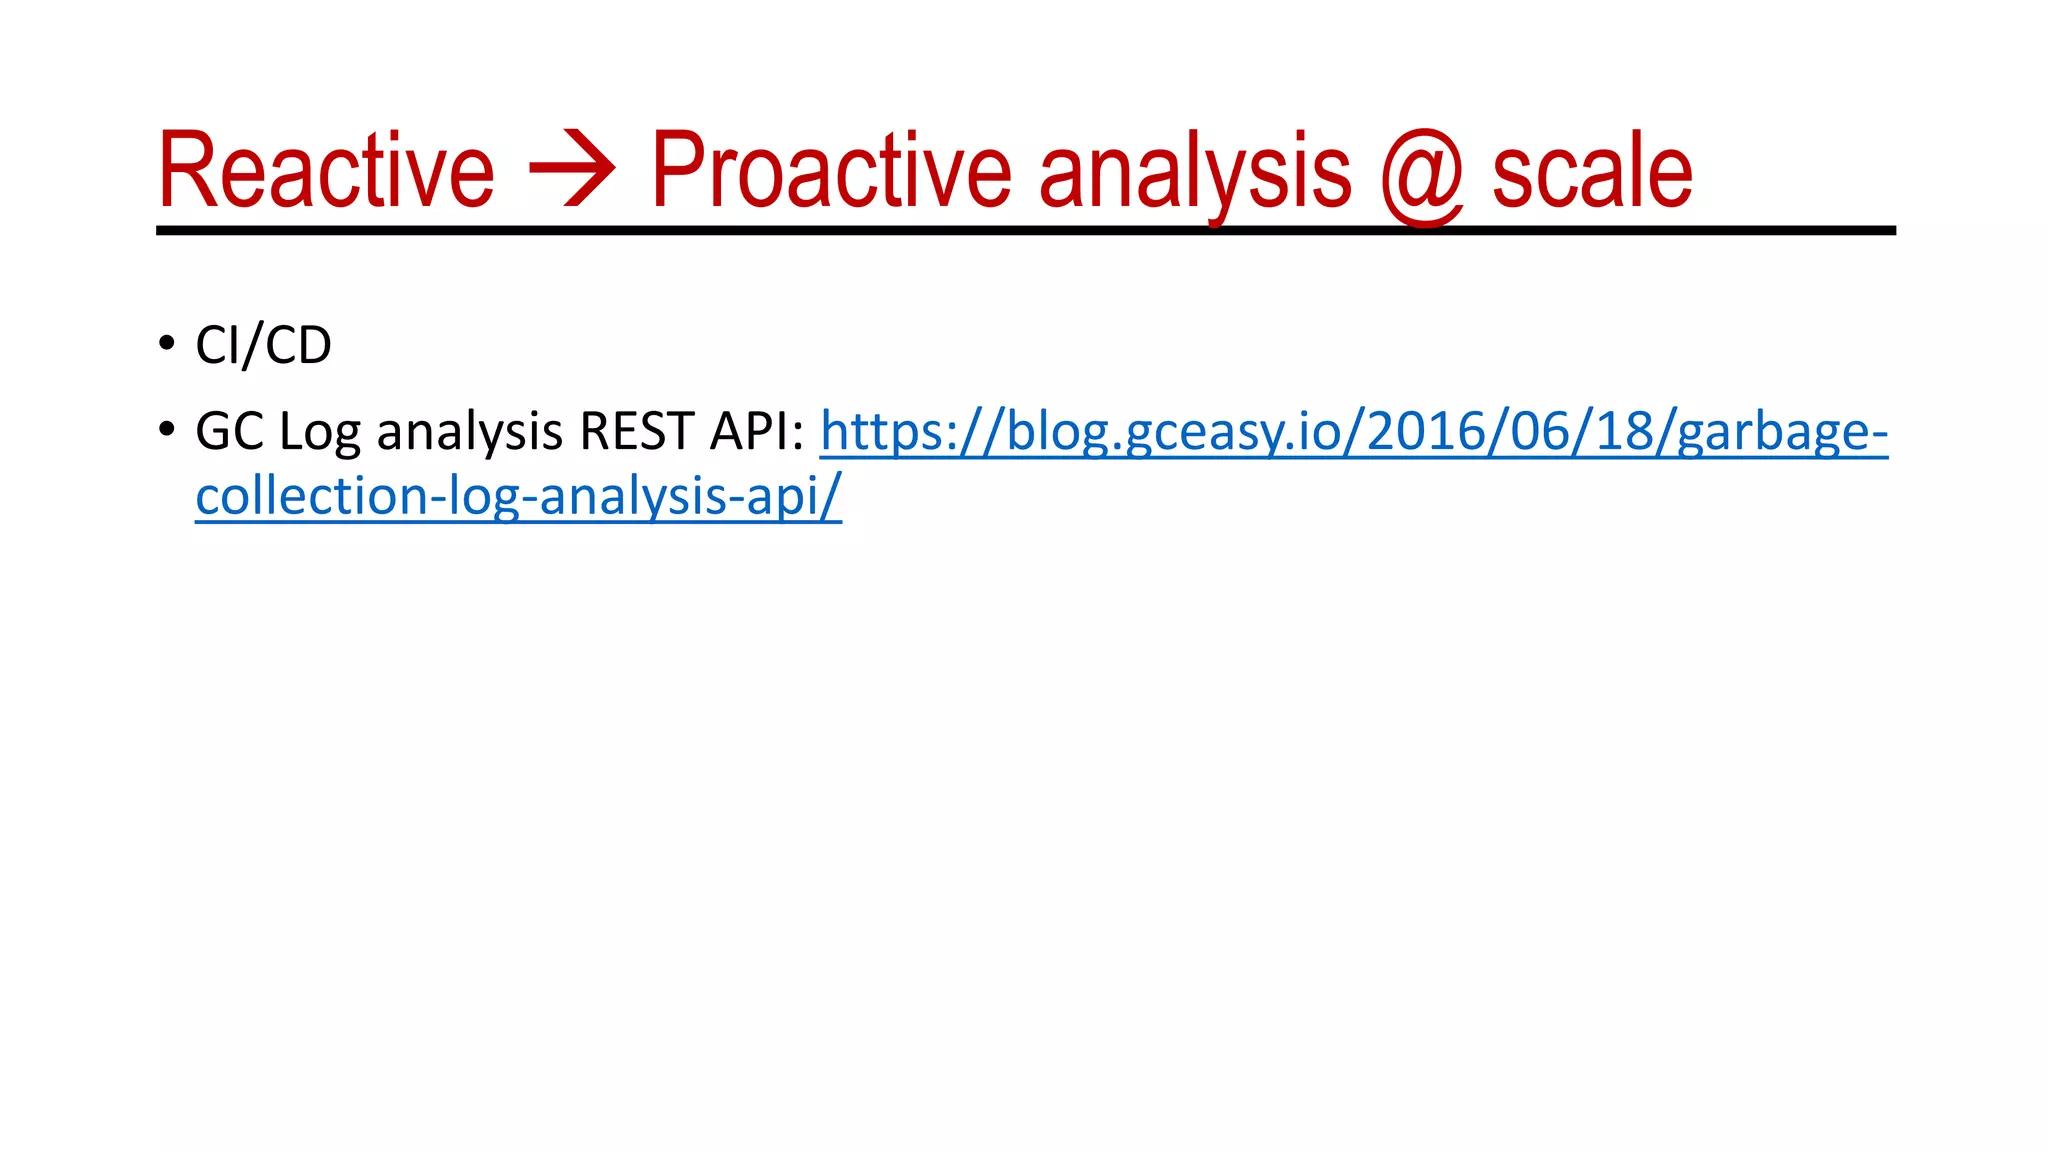
Reactive  Proactive analysis @ scale
• CI/CD
• GC Log analysis REST API: https://blog.gceasy.io/2016/06/18/garbage-
collection-log-analysis-api/
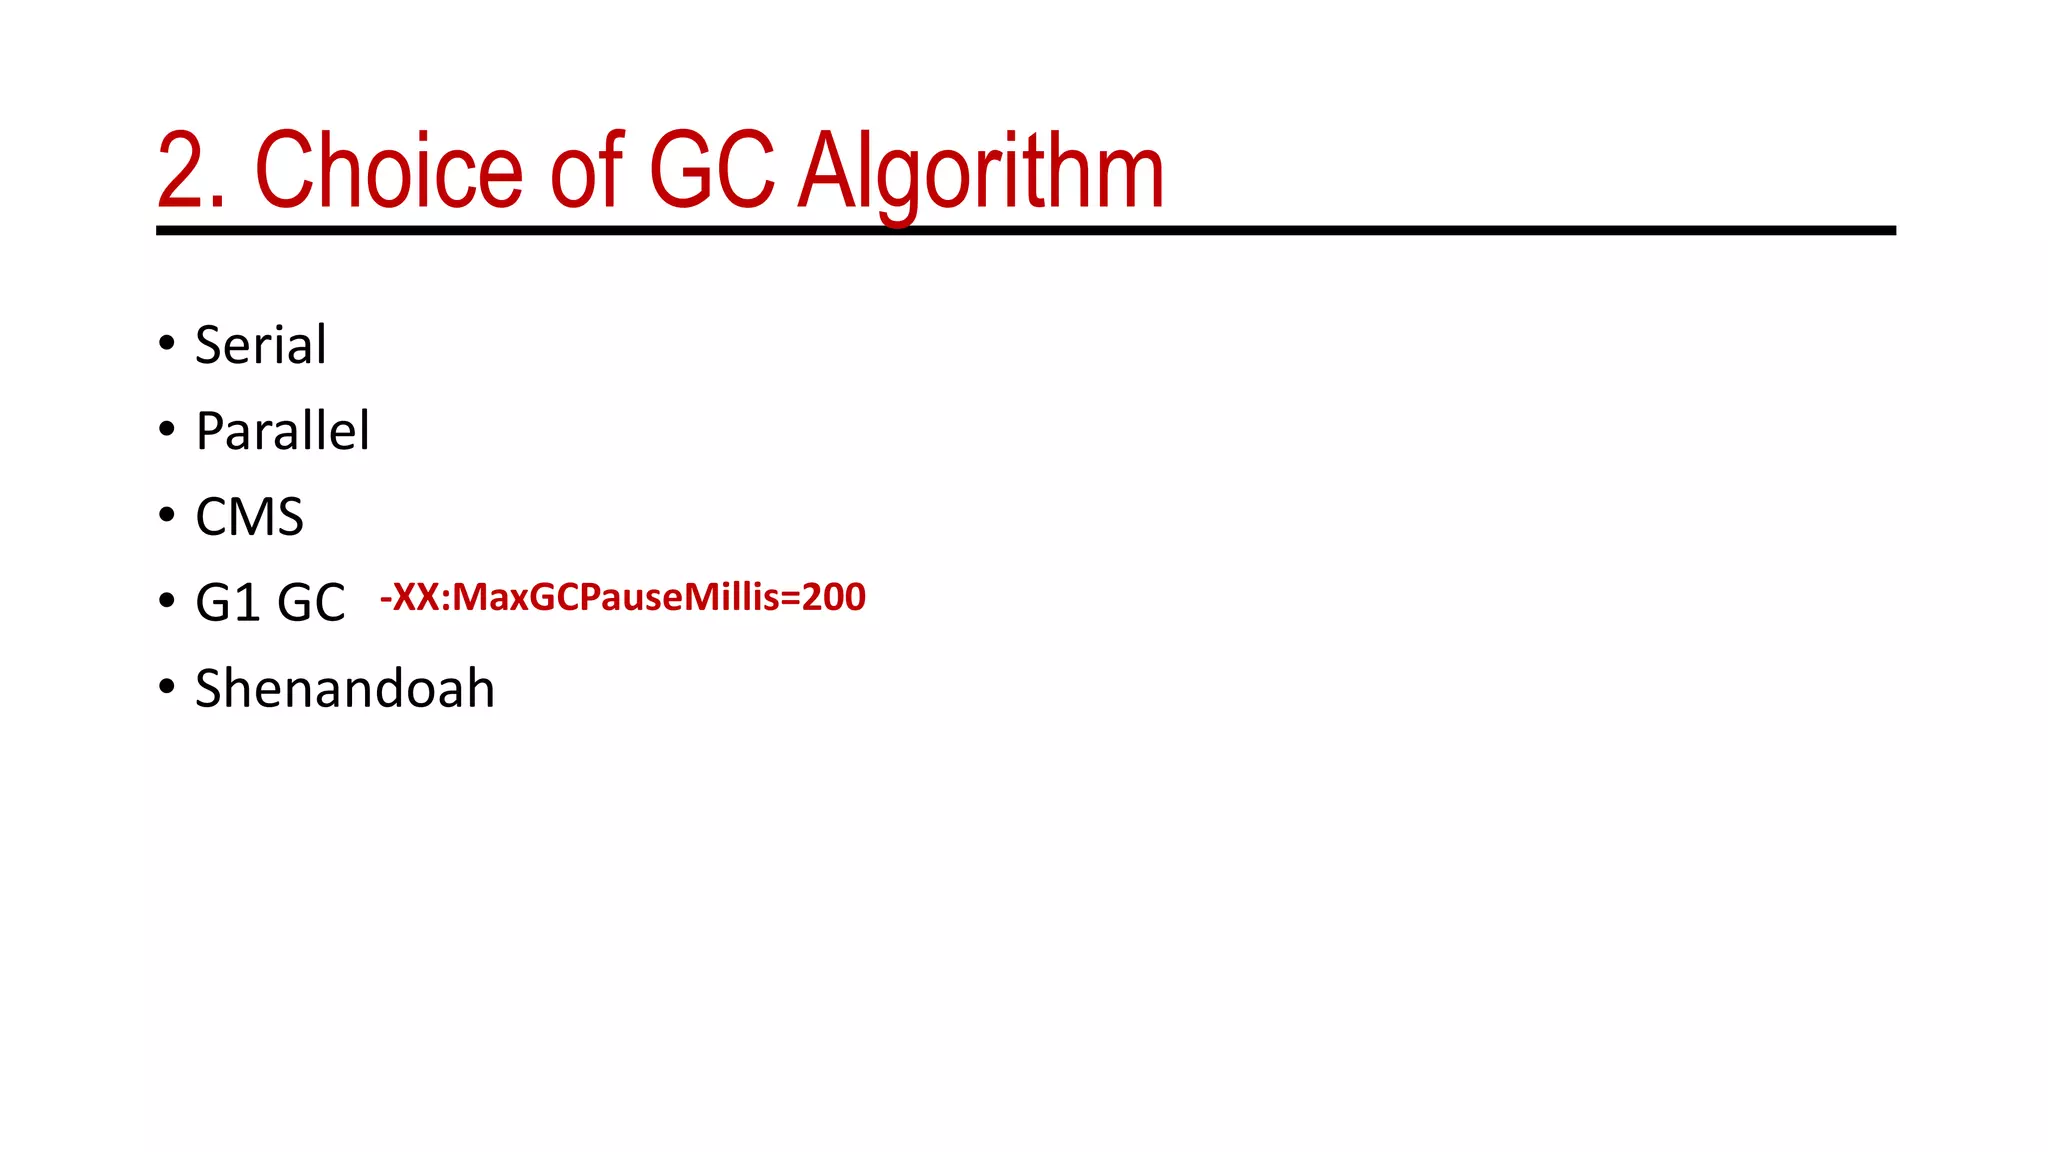
2. Choice of GC Algorithm
• Serial
• Parallel
• CMS
• G1 GC
• Shenandoah
-XX:MaxGCPauseMillis=200
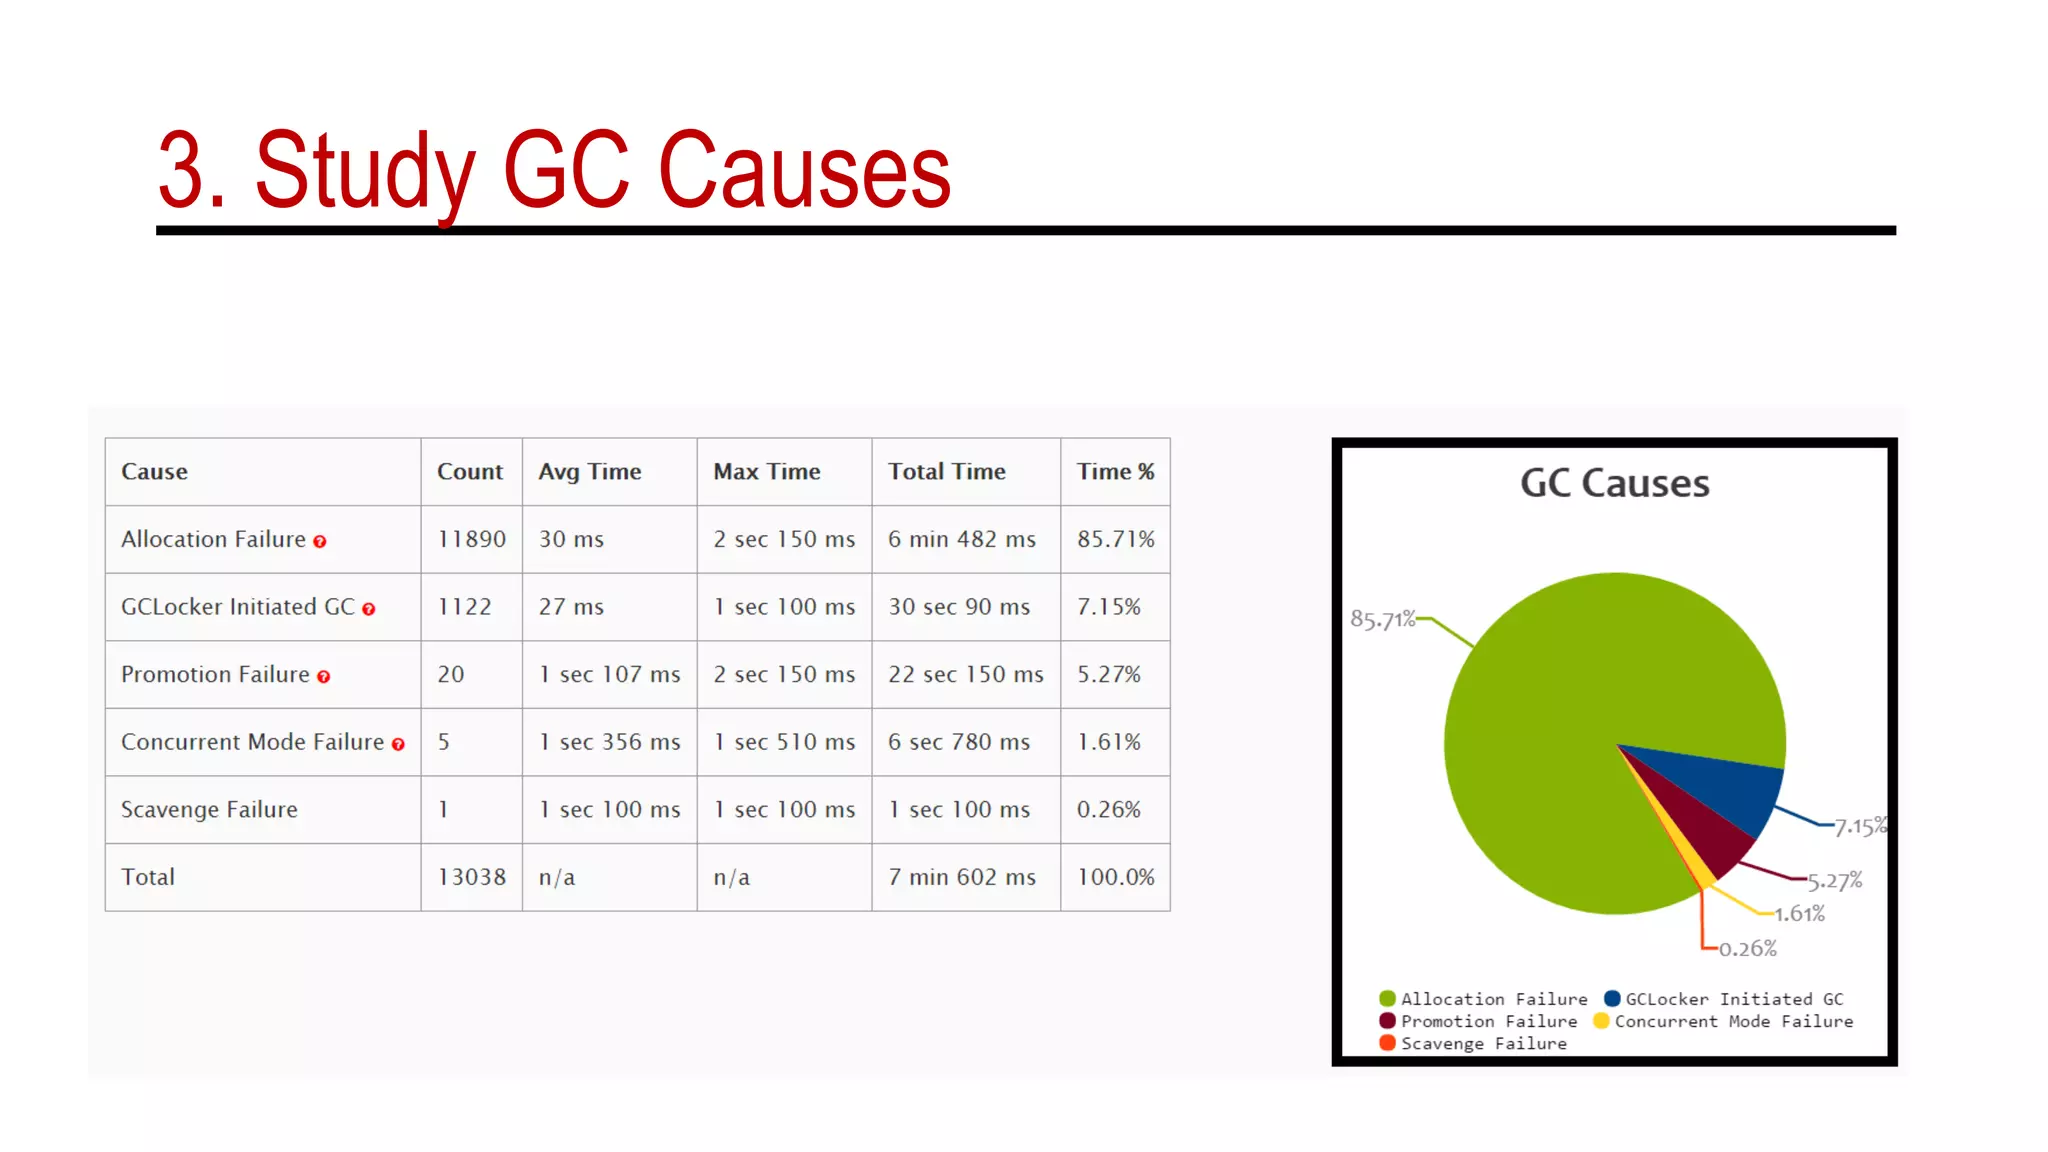
3. Study GC Causes
GC Time
[Times: user=11.53 sys=1.38, real=1.03 secs]
Kernel
Java user
sys
Real: Wall clock time
Pattern: Sys > User time
4. Process Swapping
• Sometimes due to lack of memory (RAM), Operating system could be
swapping your application from memory.
• Below script will show all the process that are being swapped:
https://blog.gceasy.io/2016/11/22/reduce-long-gc-pauses/
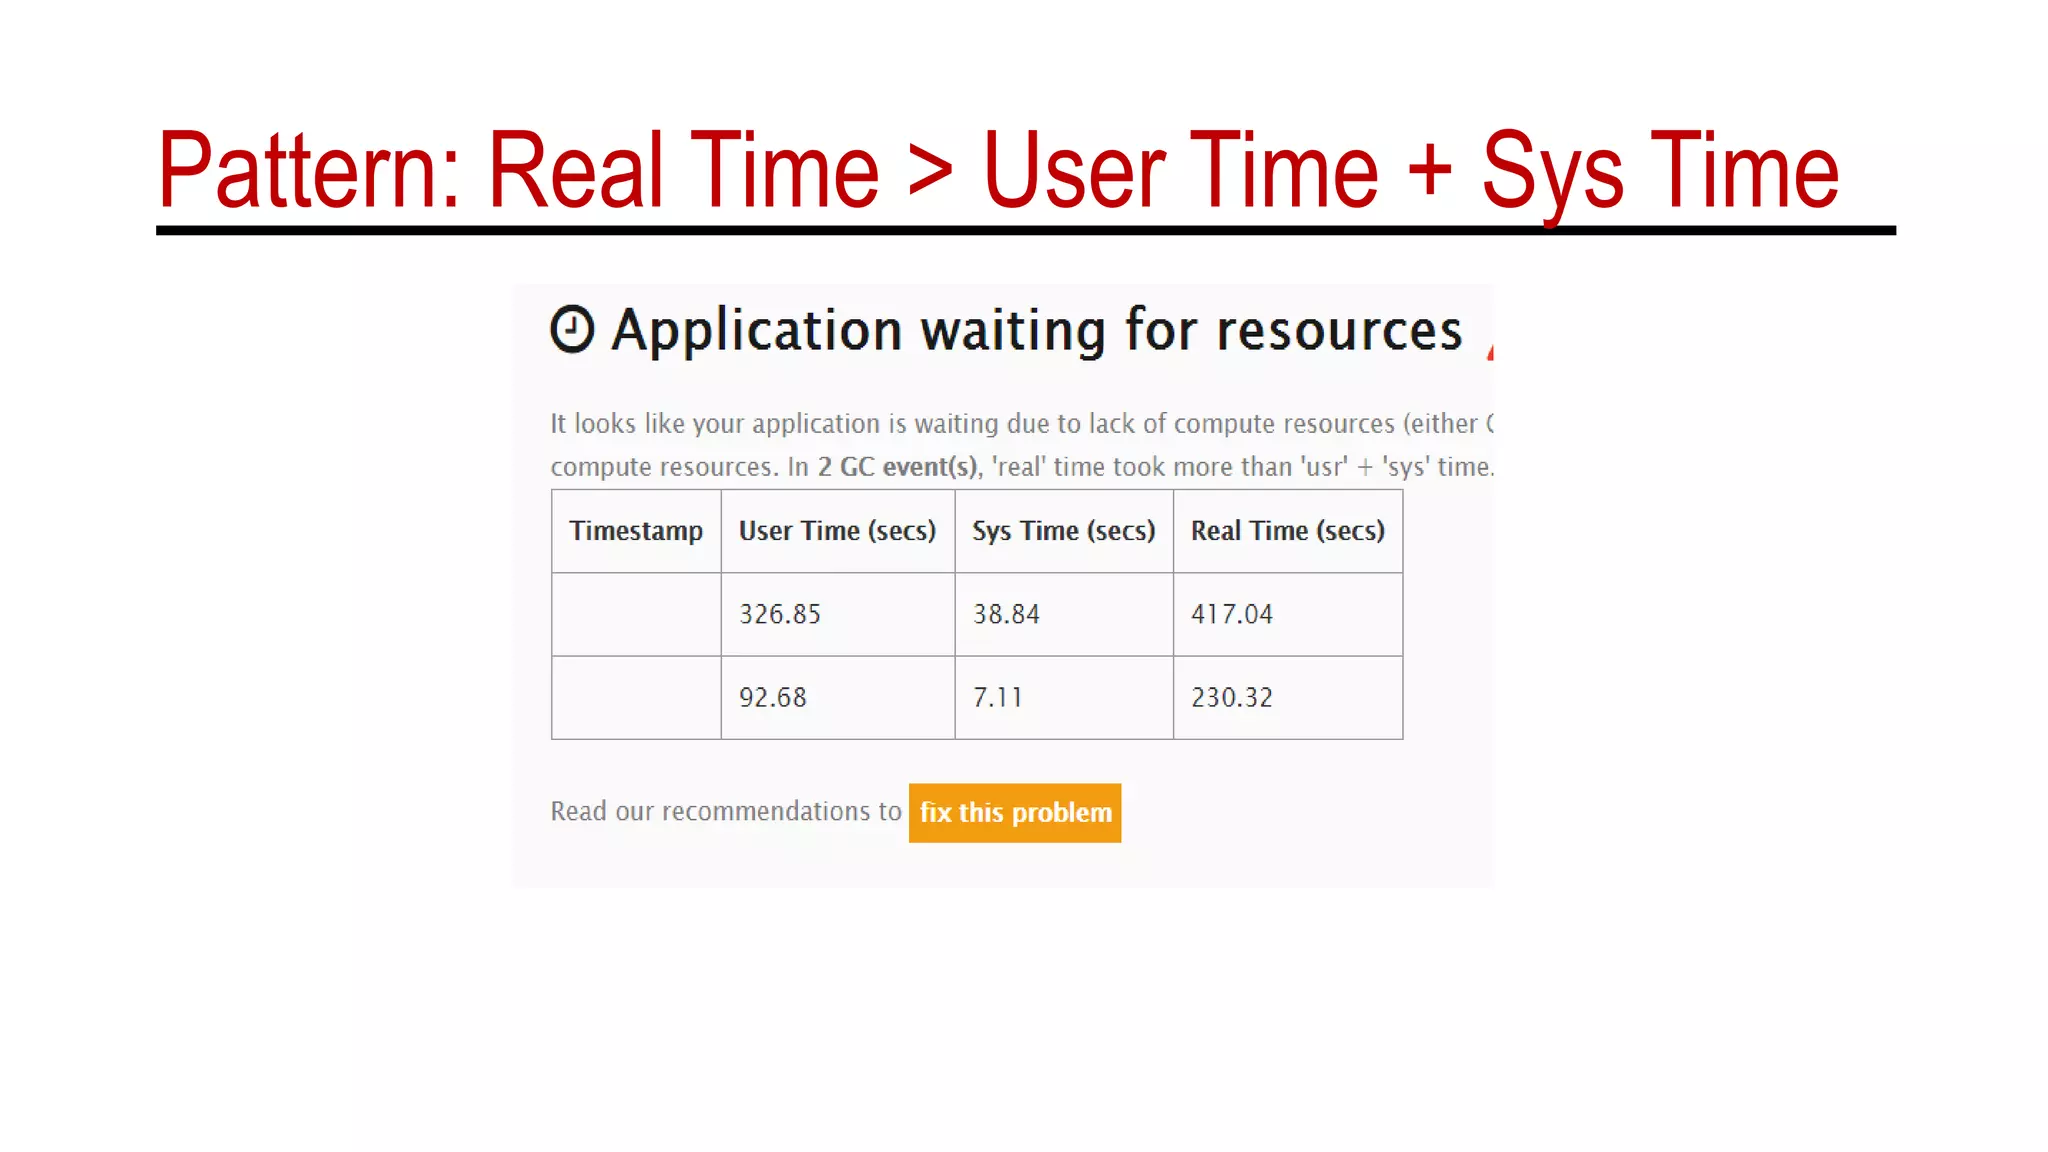
Pattern: Real Time > User Time + Sys Time
5. Background IO Traffic
• If there is a heavy file system I/O activity (i.e. lot of reads and writes
are happening) it can also cause long GC pauses.
Tit-bit: How to monitor I/O activity?
sar -d -p 1
‘System Activity Report’ command reports read/write activity made every 1 second
6. Less GC Threads
• WARNING: Adding too many GC threads will consume a lot of CPU
and takes away a resource from your application. Thus you need to
conduct thorough testing before increasing the GC thread count.
7. System.gc() calls
• When System.gc() or Runtime.getRuntime().gc() calls causes stop-the-
world Full GCs.
• What triggers System.gc() calls
• Your own application
• 3rd party libraries, frameworks, sometimes even application servers that you
use could be invoking System.gc() method.
• External tools (like VisualVM) through use of JMX
• RMI
– Dsun.rmi.dgc.server.gcInterval=n
– Dsun.rmi.dgc.client.gcInterval=n
• Can be disabled by -XX:+DisableExplicitGC
8. Wrong Heap size & Generation sizes
What is Garbage?
Everything is a garbage!!
Thank you!!
ram@tier1app.com
Ram Lakshmanan
@tier1app
https://www.linkedin.com/company/gceasy
Any Questions
Deck will be published in:
http://blog.gceasy.io

Become a Java GC Hero - ConFoo Conference

  • 1.
    Become a GCHero Ram Lakshmanan Architect – GCeasy.io & fastThread.io Confoo 2018
  • 2.
  • 3.
    Garbage Collection isautomatic. Why should I worry about it?
  • 4.
    Yes, it’s automatic.But not free. 1. Unpleasant user experience 2. Computing cost can go up 3. Troubleshoot & Tune memory
  • 5.
    You can't optimize,what you can't measure A famous saying
  • 6.
    Key Performance Indicators LatencyThroughput 99.925% Foot Print Memory: 2GB CPU: 30% GC event’s pause time Percentage of time spent in processing customer transactions vs time spent in GC activity. i.e. productive work vs non-productive work Memory and CPU utilization of the application 1 2 3
  • 7.
    Enable GC logs(always) Till Java 8: -XX:+PrintGCDetails -XX:+PrintGCDateStamps -Xloggc:<file-path> From Java 9: -Xlog:gc*:file=<file-path>
  • 8.
    Vanilla format 2016-08-31T01:09:19.397+0000: 1.606:[GC (Metadata GC Threshold) [PSYoungGen: 545393K->18495K(2446848K)] 545393K->18519K(8039424K), 0.0189376 secs] [Times: user=0.15 sys=0.01, real=0.02 secs] 2016-08-31T01:09:19.416+0000: 1.625: [Full GC (Metadata GC Threshold) [PSYoungGen: 18495K->0K(2446848K)] [ParOldGen: 24K->17366K(5592576K)] 18519K->17366K(8039424K), [Metaspace: 20781K->20781K(1067008K)], 0.0416162 secs] [Times: user=0.38 sys=0.03, real=0.04 secs] 2016-08-31T01:18:19.288+0000: 541.497: [GC (Metadata GC Threshold) [PSYoungGen: 1391495K->18847K(2446848K)] 1408861K->36230K(8039424K), 0.0568365 secs] [Times: user=0.31 sys=0.75, real=0.06 secs] 2016-08-31T01:18:19.345+0000: 541.554: [Full GC (Metadata GC Threshold) [PSYoungGen: 18847K->0K(2446848K)] [ParOldGen: 17382K- >25397K(5592576K)] 36230K->25397K(8039424K), [Metaspace: 34865K->34865K(1079296K)], 0.0467640 secs] [Times: user=0.31 sys=0.08, real=0.04 secs] 2016-08-31T02:33:20.326+0000: 5042.536: [GC (Allocation Failure) [PSYoungGen: 2097664K->11337K(2446848K)] 2123061K->36742K(8039424K), 0.3298985 secs] [Times: user=0.00 sys=9.20, real=0.33 secs] 2016-08-31T03:40:11.749+0000: 9053.959: [GC (Allocation Failure) [PSYoungGen: 2109001K->15776K(2446848K)] 2134406K->41189K(8039424K), 0.0517517 secs] [Times: user=0.00 sys=1.22, real=0.05 secs] 2016-08-31T05:11:46.869+0000: 14549.079: [GC (Allocation Failure) [PSYoungGen: 2113440K->24832K(2446848K)] 2138853K->50253K(8039424K), 0.0392831 secs] [Times: user=0.02 sys=0.79, real=0.04 secs] 2016-08-31T06:26:10.376+0000: 19012.586: [GC (Allocation Failure) [PSYoungGen: 2122496K->25600K(2756096K)] 2147917K->58149K(8348672K), 0.0371416 secs] [Times: user=0.01 sys=0.75, real=0.04 secs] 2016-08-31T07:50:03.442+0000: 24045.652: [GC (Allocation Failure) [PSYoungGen: 2756096K->32768K(2763264K)] 2788645K->72397K(8355840K), 0.0709641 secs] [Times: user=0.16 sys=1.39, real=0.07 secs] 2016-08-31T09:04:21.406+0000: 28503.616: [GC (Allocation Failure) [PSYoungGen: 2763264K->32768K(2733568K)] 2802893K->83469K(8326144K), 0.0789178 secs] [Times: user=0.12 sys=1.59, real=0.08 secs]
  • 9.
    Memory Young old metaspaceothers -Xmn -Xmx -XX:MetaspaceSize Young: Newly created Objects Old: New objects that survived one or more minor GC promoted here Metaspace: Classes, Methods, metadata Others Description Thread Stacks Each thread has a separate memory space. Controlled by -Xss Garbage Collection Threads, Memory to store GC info Code Generation Converting bytecode to native code Socket Buffers TCP Connections (Receive buffer ~37k, Send Buffer ~2.5k) JNI JNI program also allocate memory
  • 10.
    GC Log formatvaries JVM Vendor Oracle HP IBM Azul … Java Version 1.4 5 6 7 8 9 GC algorithm Serial Parallel CMS G1 Shennandoh Arguments -XX:+PrintGC -XX:+PrintGCDateStamps -XX:+PrintGCDetails -XX:+PrintGCTimeStamps -XX:+PrintPromotionFailure - XX:+PrintGCApplicationStoppedT ime -XX:+PrintClassHistogram -XX:PrintFLSStatistics=1 -XX:+PrintCodeCache
  • 11.
    G1 GC Format2015-09-14T11:58:55.131-0700:0.519: [GC pause (G1 Evacuation Pause) (young), 0.0096438 secs] [Parallel Time: 7.9 ms, GC Workers: 8] [GC Worker Start (ms): Min: 519.4, Avg: 519.6, Max: 520.6, Diff: 1.3] [Ext Root Scanning (ms): Min: 0.0, Avg: 2.9, Max: 7.3, Diff: 7.3, Sum: 23.4] [Update RS (ms): Min: 0.0, Avg: 0.0, Max: 0.0, Diff: 0.0, Sum: 0.0] [Processed Buffers: Min: 0, Avg: 0.0, Max: 0, Diff: 0, Sum: 0] [Scan RS (ms): Min: 0.0, Avg: 0.0, Max: 0.0, Diff: 0.0, Sum: 0.0] [Code Root Scanning (ms): Min: 0.0, Avg: 0.0, Max: 0.1, Diff: 0.1, Sum: 0.1] [Object Copy (ms): Min: 0.0, Avg: 4.2, Max: 7.2, Diff: 7.2, Sum: 34.0] [Termination (ms): Min: 0.0, Avg: 0.2, Max: 0.4, Diff: 0.4, Sum: 1.7] [Termination Attempts: Min: 1, Avg: 7.9, Max: 18, Diff: 17, Sum: 63] [GC Worker Other (ms): Min: 0.0, Avg: 0.0, Max: 0.1, Diff: 0.1, Sum: 0.4] [GC Worker Total (ms): Min: 6.4, Avg: 7.4, Max: 7.7, Diff: 1.3, Sum: 59.6] [GC Worker End (ms): Min: 527.0, Avg: 527.1, Max: 527.1, Diff: 0.1] [Code Root Fixup: 0.0 ms] [Code Root Purge: 0.0 ms] [Clear CT: 0.5 ms] [Other: 1.3 ms] [Choose CSet: 0.0 ms] [Ref Proc: 0.7 ms] [Ref Enq: 0.0 ms] [Redirty Cards: 0.3 ms] [Humongous Register: 0.0 ms] [Humongous Reclaim: 0.0 ms] [Free CSet: 0.0 ms] [Eden: 24.0M(24.0M)->0.0B(34.0M) Survivors: 0.0B->3072.0K Heap: 24.0M(252.0M)->3338.0K(252.0M)] [Times: user=0.06 sys=0.00, real=0.01 secs]
  • 12.
    CMS Log formatBeforeGC: Statistics for BinaryTreeDictionary: ------------------------------------ Total Free Space: 2524251 Max Chunk Size: 2519552 Number of Blocks: 13 Av. Block Size: 194173 Tree Height: 8 2016-05-03T04:27:37.503+0000: 30282.678: [ParNew Desired survivor size 214728704 bytes, new threshold 1 (max 1) - age 1: 85782640 bytes, 85782640 total : 3510063K->100856K(3774912K), 0.0516290 secs] 9371816K->6022161K(14260672K)After GC: Statistics for BinaryTreeDictionary: ------------------------------------ Total Free Space: 530579346 Max Chunk Size: 332576815 Number of Blocks: 7178 Av. Block Size: 73917 Tree Height: 44 After GC: Statistics for BinaryTreeDictionary: ------------------------------------ Total Free Space: 2524251 Max Chunk Size: 2519552 Number of Blocks: 13 Av. Block Size: 194173 Tree Height: 8 , 0.0552970 secs] [Times: user=0.67 sys=0.00, real=0.06 secs]
  • 13.
    IBM GC Logformat <af type="tenured" id="4" timestamp="Jun 16 11:28:22 2016" intervalms="5633.039"> <minimum requested_bytes="56" /> <time exclusiveaccessms="0.010" meanexclusiveaccessms="0.010" threads="0" lastthreadtid="0xF6B1C400" /> <refs soft="7232" weak="3502" phantom="9" dynamicSoftReferenceThreshold="30" maxSoftReferenceThreshold="32" /> <tenured freebytes="42949632" totalbytes="1073741824" percent="3" > <soa freebytes="0" totalbytes="1030792192" percent="0" /> <loa freebytes="42949632" totalbytes="42949632" percent="100" /> </tenured> <pending-finalizers finalizable="0" reference="0" classloader="0" /> <gc type="global" id="6" totalid="6" intervalms="3342.687"> <classunloading classloaders="0" classes="0" timevmquiescems="0.000" timetakenms="1.200" /> <finalization objectsqueued="75" /> <timesms mark="28.886" sweep="1.414" compact="0.000" total="31.571" /> <tenured freebytes="1014673616" totalbytes="1073741824" percent="94" > <soa freebytes="982461648" totalbytes="1041529856" percent="94" /> <loa freebytes="32211968" totalbytes="32211968" percent="100" /> </tenured> </gc> <tenured freebytes="1014608080" totalbytes="1073741824" percent="94" > <soa freebytes="982396112" totalbytes="1041529856" percent="94" /> <loa freebytes="32211968" totalbytes="32211968" percent="100" /> </tenured> <refs soft="7020" weak="2886" phantom="9" dynamicSoftReferenceThreshold="30" maxSoftReferenceThreshold="32" /> <pending-finalizers finalizable="75" reference="15" classloader="0" /> <time totalms="33.852" /> </af>
  • 14.
    IBM GC Log– another format <gc-op id="139" type="scavenge" timems="335.610" contextid="136" timestamp="2016-06-15T15:51:10.128"> <scavenger-info tenureage="4" tenuremask="7ff0" tiltratio="58" /> <memory-copied type="nursery" objects="11071048" bytes="448013400" bytesdiscarded="88016" /> <memory-copied type="tenure" objects="286673" bytes="9771936" bytesdiscarded="320608" /> <copy-failed type="nursery" objects="286673" bytes="9771936" /> <finalization candidates="112" enqueued="16" /> <ownableSynchronizers candidates="8111" cleared="11" /> <references type="soft" candidates="1256" cleared="0" enqueued="0" dynamicThreshold="32" maxThreshold="32" /> <references type="weak" candidates="2953" cleared="0" enqueued="0" /> <references type="phantom" candidates="142406" cleared="142335" enqueued="142335" /> </gc-op>
  • 15.
    Android Dalvik VMGC Log Format 07-01 15:56:20.035: I/Choreographer(30615): Skipped 141 frames! The application may be doing too much work on its main thread. 07-01 15:56:20.275: D/dalvikvm(30615): GC_FOR_ALLOC freed 4774K, 45% free 49801K/89052K, paused 168ms, total 168ms 07-01 15:56:20.295: I/dalvikvm-heap(30615): Grow heap (frag case) to 56.900MB for 4665616-byte allocation 07-01 15:56:21.315: D/dalvikvm(30615): GC_FOR_ALLOC freed 1359K, 42% free 55045K/93612K, paused 95ms, total 95ms 07-01 15:56:21.965: D/dalvikvm(30615): GC_CONCURRENT freed 6376K, 40% free 56861K/93612K, paused 16ms+8ms, total 126ms 07-01 15:56:21.965: D/dalvikvm(30615): WAIT_FOR_CONCURRENT_GC blocked 111ms 07-01 15:56:21.965: D/dalvikvm(30615): WAIT_FOR_CONCURRENT_GC blocked 97ms
  • 16.
    Android ART GCLog Format 07-01 16:00:44.690: I/art(801): Explicit concurrent mark sweep GC freed 65595(3MB) AllocSpace objects, 9(4MB) LOS objects, 810% free, 38MB/58MB, paused 1.195ms total 87.219ms 07-01 16:00:46.517: I/art(29197): Background partial concurrent mark sweep GC freed 74626(3MB) AllocSpace objects, 39(4MB) LOS objects, 1496% free, 25MB/32MB, paused 4.422ms total 1.371747s 07-01 16:00:48.534: I/Choreographer(29197): Skipped 30 frames! The application may be doing too much work on its main thread. 07-01 16:00:48.566: I/art(29197): Background sticky concurrent mark sweep GC freed 70319(3MB) AllocSpace objects, 59(5MB) LOS objects, 825% free, 49MB/56MB, paused 6.139ms total 52.868ms 07-01 16:00:49.282: I/Choreographer(29197): Skipped 33 frames! The application may be doing too much work on its main thread.
  • 17.
    ‘Free’ GC loganalysis tools 1. GCeasy.io 2. IBM Pattern Modeling and Analysis Tool for Java Garbage Collector 3. HP Jmeter 4. Google Garbage Cat - CMS
  • 18.
  • 19.
  • 20.
    What is yourobservation?
  • 21.
  • 22.
  • 23.
    How to diagnosememory leak 1. Capture Heap Dumps: a. jmap -dump:live,file=<file-path> <pid> Example: jmap -dump:live,file=/opt/tmp/AddressBook-heapdump.bin 37320 b. -XX:+HeapDumpOnOutOfMemoryError -XX:HeapDumpPath=/logs/heapdump 2. Best tool to analyze heap dumps: Eclipse MAT, Heap Hero
  • 24.
    Sample Memory leakProgram public class SampleLeakApp { public static Map<String, String> myMap = new HashMap<>(); public static void main(String args[]) { long counter = 0; while (true) { myMap.put("key" + counter++, UUID.randomUUID() + ""); } } }
  • 25.
    Let’s analyze heapdumpof this program
  • 26.
    Reduce GC pausetime https://blog.gceasy.io/2016/11/22/reduce-long-gc-pauses/
  • 27.
    1. High Objectcreation rate Best Practice: Compare this metric between releases in Performance lab
  • 28.
    Metrics to comparebetween releases
  • 29.
    Reduce memory consumption •Less Memory. More Victory.
  • 30.
    Reactive  Proactiveanalysis @ scale • CI/CD • GC Log analysis REST API: https://blog.gceasy.io/2016/06/18/garbage- collection-log-analysis-api/
  • 31.
    2. Choice ofGC Algorithm • Serial • Parallel • CMS • G1 GC • Shenandoah -XX:MaxGCPauseMillis=200
  • 32.
  • 33.
    GC Time [Times: user=11.53sys=1.38, real=1.03 secs] Kernel Java user sys Real: Wall clock time
  • 34.
    Pattern: Sys >User time
  • 35.
    4. Process Swapping •Sometimes due to lack of memory (RAM), Operating system could be swapping your application from memory. • Below script will show all the process that are being swapped: https://blog.gceasy.io/2016/11/22/reduce-long-gc-pauses/
  • 36.
    Pattern: Real Time> User Time + Sys Time
  • 37.
    5. Background IOTraffic • If there is a heavy file system I/O activity (i.e. lot of reads and writes are happening) it can also cause long GC pauses. Tit-bit: How to monitor I/O activity? sar -d -p 1 ‘System Activity Report’ command reports read/write activity made every 1 second
  • 38.
    6. Less GCThreads • WARNING: Adding too many GC threads will consume a lot of CPU and takes away a resource from your application. Thus you need to conduct thorough testing before increasing the GC thread count.
  • 39.
    7. System.gc() calls •When System.gc() or Runtime.getRuntime().gc() calls causes stop-the- world Full GCs. • What triggers System.gc() calls • Your own application • 3rd party libraries, frameworks, sometimes even application servers that you use could be invoking System.gc() method. • External tools (like VisualVM) through use of JMX • RMI – Dsun.rmi.dgc.server.gcInterval=n – Dsun.rmi.dgc.client.gcInterval=n • Can be disabled by -XX:+DisableExplicitGC
  • 40.
    8. Wrong Heapsize & Generation sizes
  • 41.
  • 42.