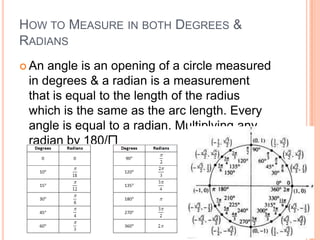
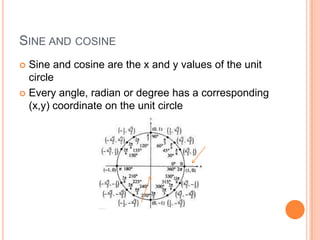
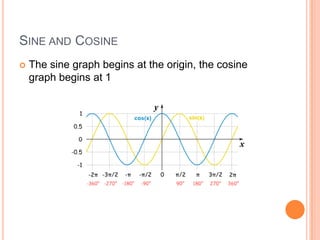
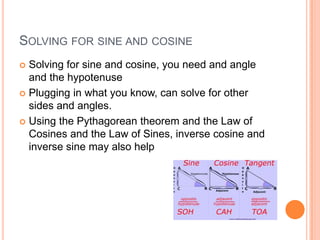
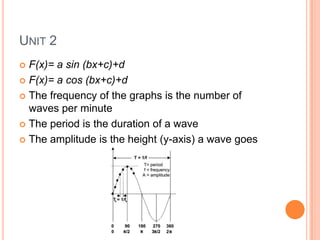
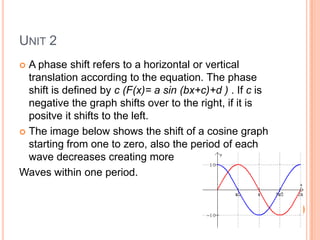
This document covers trigonometry units 1 and 2. It discusses measuring angles in degrees and radians, where a radian is equal to the arc length of the radius. It defines sine and cosine as the x and y values on the unit circle corresponding to an angle. It describes how to solve for sine and cosine given an angle and hypotenuse using trigonometric functions, Pythagorean theorem, and laws of sines and cosines. Unit 2 covers trigonometric functions involving amplitude, frequency, period, and phase shifts. It also discusses inverse trigonometric functions.
Maths project --some applications of trignometry--class 10Mahip Singh
Amongst the lay public of non-mathematicians and non-scientists, trigonometry is known chiefly for its application to measurement problems, yet is also often used in ways that are far more subtle, such as its place in the theory of music; still other uses are more technical, such as in number theory. The mathematical topics of Fourier series and Fourier transforms rely heavily on knowledge of trigonometric functions and find application in a number of areas, including statistics.
Are you looking for solution of Fourier Transform? Want to understand what is Complex number system ? Or trying to find what is the meaning of Euler's Equation ? Then this book is gold stone for you.
Thanks
Jaydeep shah (E.C)
Ahmedabad India
radhey04ec@gmail.com
Accelerate your Kubernetes clusters with Varnish CachingThijs Feryn
A presentation about the usage and availability of Varnish on Kubernetes. This talk explores the capabilities of Varnish caching and shows how to use the Varnish Helm chart to deploy it to Kubernetes.
This presentation was delivered at K8SUG Singapore. See https://feryn.eu/presentations/accelerate-your-kubernetes-clusters-with-varnish-caching-k8sug-singapore-28-2024 for more details.
Builder.ai Founder Sachin Dev Duggal's Strategic Approach to Create an Innova...Ramesh Iyer
In today's fast-changing business world, Companies that adapt and embrace new ideas often need help to keep up with the competition. However, fostering a culture of innovation takes much work. It takes vision, leadership and willingness to take risks in the right proportion. Sachin Dev Duggal, co-founder of Builder.ai, has perfected the art of this balance, creating a company culture where creativity and growth are nurtured at each stage.
JMeter webinar - integration with InfluxDB and GrafanaRTTS
Watch this recorded webinar about real-time monitoring of application performance. See how to integrate Apache JMeter, the open-source leader in performance testing, with InfluxDB, the open-source time-series database, and Grafana, the open-source analytics and visualization application.
In this webinar, we will review the benefits of leveraging InfluxDB and Grafana when executing load tests and demonstrate how these tools are used to visualize performance metrics.
Length: 30 minutes
Session Overview
-------------------------------------------
During this webinar, we will cover the following topics while demonstrating the integrations of JMeter, InfluxDB and Grafana:
- What out-of-the-box solutions are available for real-time monitoring JMeter tests?
- What are the benefits of integrating InfluxDB and Grafana into the load testing stack?
- Which features are provided by Grafana?
- Demonstration of InfluxDB and Grafana using a practice web application
To view the webinar recording, go to:
https://www.rttsweb.com/jmeter-integration-webinar
LF Energy Webinar: Electrical Grid Modelling and Simulation Through PowSyBl -...DanBrown980551
Do you want to learn how to model and simulate an electrical network from scratch in under an hour?
Then welcome to this PowSyBl workshop, hosted by Rte, the French Transmission System Operator (TSO)!
During the webinar, you will discover the PowSyBl ecosystem as well as handle and study an electrical network through an interactive Python notebook.
PowSyBl is an open source project hosted by LF Energy, which offers a comprehensive set of features for electrical grid modelling and simulation. Among other advanced features, PowSyBl provides:
- A fully editable and extendable library for grid component modelling;
- Visualization tools to display your network;
- Grid simulation tools, such as power flows, security analyses (with or without remedial actions) and sensitivity analyses;
The framework is mostly written in Java, with a Python binding so that Python developers can access PowSyBl functionalities as well.
What you will learn during the webinar:
- For beginners: discover PowSyBl's functionalities through a quick general presentation and the notebook, without needing any expert coding skills;
- For advanced developers: master the skills to efficiently apply PowSyBl functionalities to your real-world scenarios.
PHP Frameworks: I want to break free (IPC Berlin 2024)Ralf Eggert
In this presentation, we examine the challenges and limitations of relying too heavily on PHP frameworks in web development. We discuss the history of PHP and its frameworks to understand how this dependence has evolved. The focus will be on providing concrete tips and strategies to reduce reliance on these frameworks, based on real-world examples and practical considerations. The goal is to equip developers with the skills and knowledge to create more flexible and future-proof web applications. We'll explore the importance of maintaining autonomy in a rapidly changing tech landscape and how to make informed decisions in PHP development.
This talk is aimed at encouraging a more independent approach to using PHP frameworks, moving towards a more flexible and future-proof approach to PHP development.
Software Delivery At the Speed of AI: Inflectra Invests In AI-Powered QualityInflectra
In this insightful webinar, Inflectra explores how artificial intelligence (AI) is transforming software development and testing. Discover how AI-powered tools are revolutionizing every stage of the software development lifecycle (SDLC), from design and prototyping to testing, deployment, and monitoring.
Learn about:
• The Future of Testing: How AI is shifting testing towards verification, analysis, and higher-level skills, while reducing repetitive tasks.
• Test Automation: How AI-powered test case generation, optimization, and self-healing tests are making testing more efficient and effective.
• Visual Testing: Explore the emerging capabilities of AI in visual testing and how it's set to revolutionize UI verification.
• Inflectra's AI Solutions: See demonstrations of Inflectra's cutting-edge AI tools like the ChatGPT plugin and Azure Open AI platform, designed to streamline your testing process.
Whether you're a developer, tester, or QA professional, this webinar will give you valuable insights into how AI is shaping the future of software delivery.
UiPath Test Automation using UiPath Test Suite series, part 4DianaGray10
Welcome to UiPath Test Automation using UiPath Test Suite series part 4. In this session, we will cover Test Manager overview along with SAP heatmap.
The UiPath Test Manager overview with SAP heatmap webinar offers a concise yet comprehensive exploration of the role of a Test Manager within SAP environments, coupled with the utilization of heatmaps for effective testing strategies.
Participants will gain insights into the responsibilities, challenges, and best practices associated with test management in SAP projects. Additionally, the webinar delves into the significance of heatmaps as a visual aid for identifying testing priorities, areas of risk, and resource allocation within SAP landscapes. Through this session, attendees can expect to enhance their understanding of test management principles while learning practical approaches to optimize testing processes in SAP environments using heatmap visualization techniques
What will you get from this session?
1. Insights into SAP testing best practices
2. Heatmap utilization for testing
3. Optimization of testing processes
4. Demo
Topics covered:
Execution from the test manager
Orchestrator execution result
Defect reporting
SAP heatmap example with demo
Speaker:
Deepak Rai, Automation Practice Lead, Boundaryless Group and UiPath MVP
GraphRAG is All You need? LLM & Knowledge GraphGuy Korland
Guy Korland, CEO and Co-founder of FalkorDB, will review two articles on the integration of language models with knowledge graphs.
1. Unifying Large Language Models and Knowledge Graphs: A Roadmap.
https://arxiv.org/abs/2306.08302
2. Microsoft Research's GraphRAG paper and a review paper on various uses of knowledge graphs:
https://www.microsoft.com/en-us/research/blog/graphrag-unlocking-llm-discovery-on-narrative-private-data/
Smart TV Buyer Insights Survey 2024 by 91mobiles.pdf91mobiles
91mobiles recently conducted a Smart TV Buyer Insights Survey in which we asked over 3,000 respondents about the TV they own, aspects they look at on a new TV, and their TV buying preferences.
DevOps and Testing slides at DASA ConnectKari Kakkonen
My and Rik Marselis slides at 30.5.2024 DASA Connect conference. We discuss about what is testing, then what is agile testing and finally what is Testing in DevOps. Finally we had lovely workshop with the participants trying to find out different ways to think about quality and testing in different parts of the DevOps infinity loop.
2. HOW TO MEASURE IN BOTH DEGREES &
RADIANS
An angle is an opening of a circle measured
in degrees & a radian is a measurement
that is equal to the length of the radius
which is the same as the arc length. Every
angle is equal to a radian. Multiplying any
radian by 180/∏
3. SINE AND COSINE
Sine and cosine are the x and y values of the unit
circle
Every angle, radian or degree has a corresponding
(x,y) coordinate on the unit circle
4. SINE AND COSINE
The sine graph begins at the origin, the cosine
graph begins at 1
5. SOLVING FOR SINE AND COSINE
Solving for sine and cosine, you need and angle
and the hypotenuse
Plugging in what you know, can solve for other
sides and angles.
Using the Pythagorean theorem and the Law of
Cosines and the Law of Sines, inverse cosine and
inverse sine may also help
6. UNIT 2
F(x)= a sin (bx+c)+d
F(x)= a cos (bx+c)+d
The frequency of the graphs is the number of
waves per minute
The period is the duration of a wave
The amplitude is the height (y-axis) a wave goes
7. UNIT 2
A phase shift refers to a horizontal or vertical
translation according to the equation. The phase
shift is defined by c (F(x)= a sin (bx+c)+d ) . If c is
negative the graph shifts over to the right, if it is
positve it shifts to the left.
The image below shows the shift of a cosine graph
starting from one to zero, also the period of each
wave decreases creating more
Waves within one period.
8. UNIT 2
Inverse sin-1 / arcsine
Inverse cos-1 / arccosine
Inverse tan-1 / arctangent
The inverse and the arc finds the measurement of
the angle
Example :cos150°
150° is equal to 5/6
giving the angle a coordinate
of (-√3/2, ½)
Cosine is equal to x , sine
is equal to y
Therefore, cos150° is -√3/2