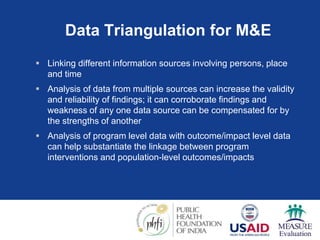
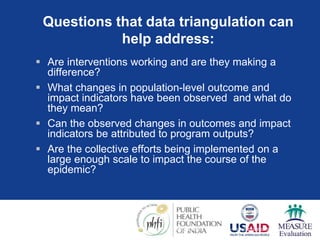
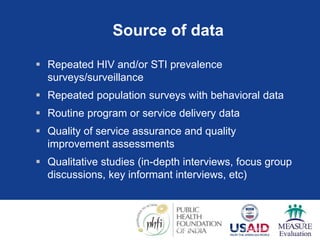
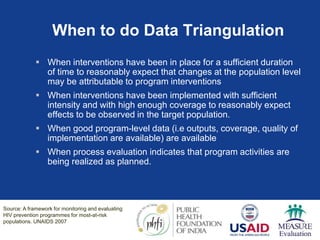
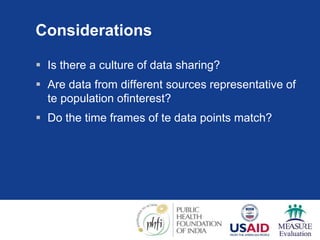
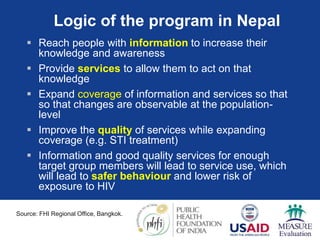
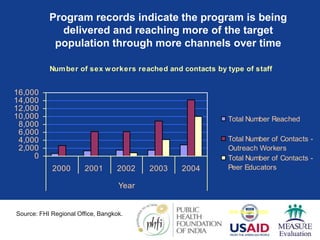
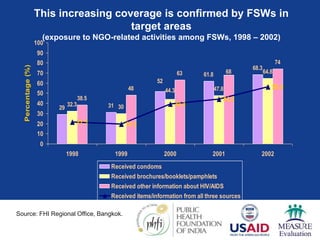
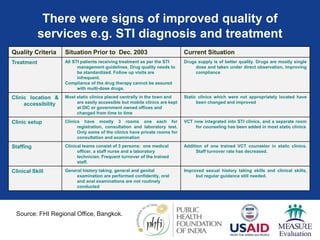
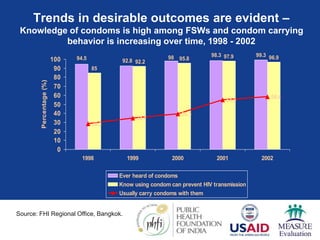
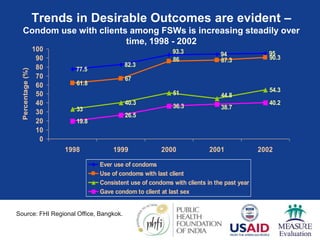
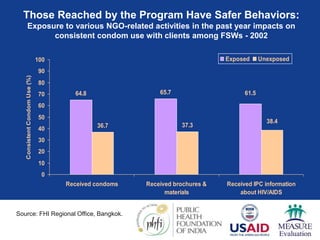
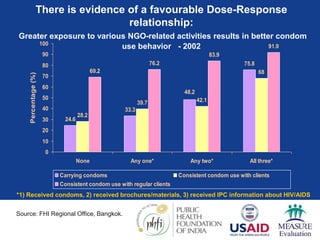
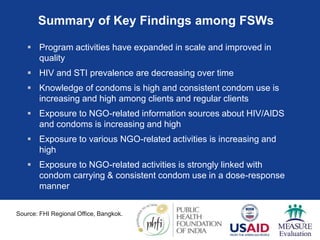
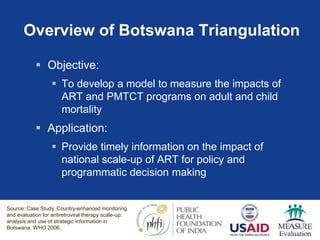
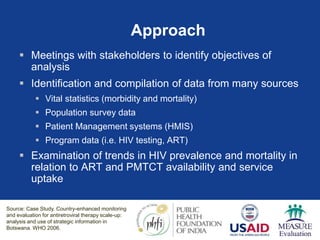
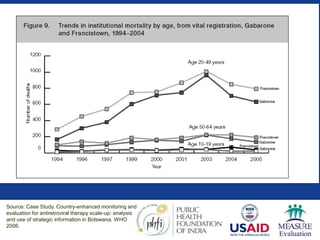
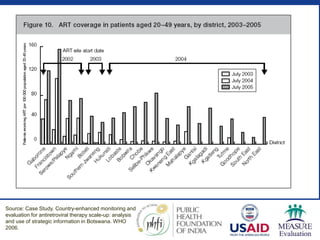
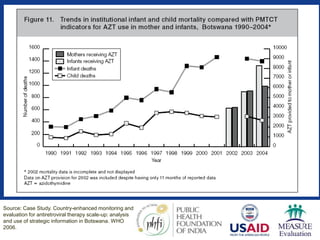
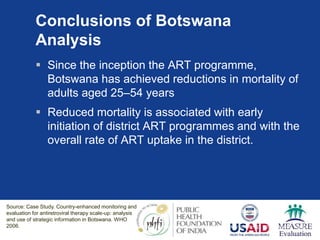
Data Triangulation
Objectives:
 At the end of the session, participants will be
able to:
 Describe the role of data triangulation in program
evaluation
 List data sources and approaches that can be
used for triangulated analysis
Data Triangulation for M&E
 Linking different information sources involving persons, place
and time
 Analysis of data from multiple sources can increase the validity
and reliability of findings; it can corroborate findings and
weakness of any one data source can be compensated for by
the strengths of another
 Analysis of program level data with outcome/impact level data
can help substantiate the linkage between program
interventions and population-level outcomes/impacts
Questions that data triangulation can
help address:
 Are interventions working and are they making a
difference?
 What changes in population-level outcome and
impact indicators have been observed and what do
they mean?
 Can the observed changes in outcomes and impact
indicators be attributed to program outputs?
 Are the collective efforts being implemented on a
large enough scale to impact the course of the
epidemic?
Source: A framework for monitoring and evaluating HIV prevention programmes for most-at-risk populations.
UNAIDS 2007
Source of data
 Repeated HIV and/or STI prevalence
surveys/surveillance
 Repeated population surveys with behavioral data
 Routine program or service delivery data
 Quality of service assurance and quality
improvement assessments
 Qualitative studies (in-depth interviews, focus group
discussions, key informant interviews, etc)
Source: A framework for monitoring and evaluating HIV prevention programmes for most-at-risk populations.
UNAIDS 2007
When to do Data Triangulation
 When interventions have been in place for a sufficient duration
of time to reasonably expect that changes at the population level
may be attributable to program interventions
 When interventions have been implemented with sufficient
intensity and with high enough coverage to reasonably expect
effects to be observed in the target population.
 When good program-level data (i.e outputs, coverage, quality of
implementation are available) are available
 When process evaluation indicates that program activities are
being realized as planned.
Source: A framework for monitoring and evaluating
HIV prevention programmes for most-at-risk
populations. UNAIDS 2007
Considerations
 Is there a culture of data sharing?
 Are data from different sources representative of
te population ofinterest?
 Do the time frames of te data points match?
Example 1:
Female Sex Worker Program in Nepal
Family Health International
Logic of the program in Nepal
 Reach people with information to increase their
knowledge and awareness
 Provide services to allow them to act on that
knowledge
 Expand coverage of information and services so that
so that changes are observable at the population-
level
 Improve the quality of services while expanding
coverage (e.g. STI treatment)
 Information and good quality services for enough
target group members will lead to service use, which
will lead to safer behaviour and lower risk of
exposure to HIV
Source: FHI Regional Office, Bangkok.
Number of sex workers reached and contacts by type of staff
0
2,000
4,000
6,000
8,000
10,000
12,000
14,000
16,000
2000 2001 2002 2003 2004
Year
Total Number Reached
Total Number of Contacts -
Outreach Workers
Total Number of Contacts -
Peer Educators
FHI Nepal, 2005
Program records indicate the program is being
delivered and reaching more of the target
population through more channels over time
Source: FHI Regional Office, Bangkok.
This increasing coverage is confirmed by FSWs in
target areas
(exposure to NGO-related activities among FSWs, 1998 – 2002)
29 31
61.8
68.3
32.3 30
47.8
64.8
38.5
48
63
74
52
44.3
68
21.5 19.3
39.3
44.3
56.4
0
10
20
30
40
50
60
70
80
90
100
1998 1999 2000 2001 2002
Percentage
(%)
Received condoms
Received brochures/booklets/pamphlets
Received other information about HIV/AIDS
Received items/information from all three sources
Source: FHI Regional Office, Bangkok.
There were signs of improved quality of
services e.g. STI diagnosis and treatment
Quality Criteria Situation Prior to Dec. 2003 Current Situation
Treatment All STI patients receiving treatment as per the STI
management guidelines. Drug quality needs to
be standardized. Follow up visits are
infrequent.
Compliance of the drug therapy cannot be assured
with multi-dose drugs.
Drugs supply is of better quality. Drugs are mostly single
dose and taken under direct observation, improving
compliance
Clinic location &
accessibility
Most static clinics placed centrally in the town and
are easily accessible but mobile clinics are kept
at DIC or government owned offices and
changed from time to time
Static clinics which were not appropriately located have
been changed and improved
Clinic setup Clinics have mostly 3 rooms one each for
registration, consultation and laboratory test.
Only some of the clinics have private rooms for
consultation and examination
VCT now integrated into STI clinics, and a separate room
for counseling has been added in most static clinics
Staffing Clinical teams consist of 3 persons: one medical
officer, a staff nurse and a laboratory
technician. Frequent turnover of the trained
staff.
Addition of one trained VCT counselor in static clinics.
Staff turnover rate has decreased.
Clinical Skill General history taking, general and genital
examination are performed confidently, oral
and anal examinations are not routinely
conducted
Improved sexual history taking skills and clinical skills,
but regular guidance still needed.
Source: FHI Regional Office, Bangkok.
Trends in desirable outcomes are evident –
Knowledge of condoms is high among FSWs and condom carrying
behavior is increasing over time, 1998 - 2002
94.5 98 98.3 99.3
92.8 95.8 97.9 96.9
92.2
85
28.3
34.7
39.3
54.8
58.4
0
10
20
30
40
50
60
70
80
90
100
1998 1999 2000 2001 2002
Percentage
(%)
Ever heard of condoms
Know using condom can prevent HIV transmission
Usually carry condoms with them
Source: FHI Regional Office, Bangkok.
Trends in Desirable Outcomes are evident –
Condom use with clients among FSWs is increasing steadily over
time, 1998 - 2002
77.5
82.3
94 95
61.8
67
87.3 90.3
33
40.3
51 54.3
19.8
26.5
36.3
40.2
93.3
86
44.8
38.7
0
10
20
30
40
50
60
70
80
90
100
1998 1999 2000 2001 2002
Percentage
(%)
Ever use of condoms
Use of condoms with last client
Consistent use of condoms with clients in the past year
Gave condom to client at last sex
Source: FHI Regional Office, Bangkok.
Those Reached by the Program Have Safer Behaviors:
Exposure to various NGO-related activities in the past year impacts on
consistent condom use with clients among FSWs - 2002
64.8 65.7
36.7 37.3
61.5
38.4
0
10
20
30
40
50
60
70
80
90
100
Received condoms Received brochures &
materials
Received IPC information
about HIV/AIDS
Consistent
Condom
Use
(%)
Exposed Unexposed
Source: FHI Regional Office, Bangkok.
There is evidence of a favourable Dose-Response
relationship:
Greater exposure to various NGO-related activities results in better condom
use behavior - 2002
24.6
33.3
75.8
28.2
39.7 42.1
68
69.2
76.2
83.9
91.9
48.2
0
10
20
30
40
50
60
70
80
90
100
None Any one* Any two* All three*
Percentage
(%)
Carrying condoms Consistent condom use with clients
Consistent condom use with regular clients
*1) Received condoms, 2) received brochures/materials, 3) received IPC information about HIV/AIDS
Source: FHI Regional Office, Bangkok.
Summary of Key Findings among FSWs
 Program activities have expanded in scale and improved in
quality
 HIV and STI prevalence are decreasing over time
 Knowledge of condoms is high and consistent condom use is
increasing and high among clients and regular clients
 Exposure to NGO-related information sources about HIV/AIDS
and condoms is increasing and high
 Exposure to various NGO-related activities is increasing and
high
 Exposure to NGO-related activities is strongly linked with
condom carrying & consistent condom use in a dose-response
manner
Source: FHI Regional Office, Bangkok.
Example 2: Botswana
Antiretroviral scale-up in Botswana
National AIDS Committee Botswana,
WHO, UCSF and UNAIDS (2006)
Overview of Botswana Triangulation
 Objective:
 To develop a model to measure the impacts of
ART and PMTCT programs on adult and child
mortality
 Application:
 Provide timely information on the impact of
national scale-up of ART for policy and
programmatic decision making
Source: Case Study. Country-enhanced monitoring
and evaluation for antiretroviral therapy scale-up:
analysis and use of strategic information in
Botswana. WHO 2006.
Approach
 Meetings with stakeholders to identify objectives of
analysis
 Identification and compilation of data from many sources
 Vital statistics (morbidity and mortality)
 Population survey data
 Patient Management systems (HMIS)
 Program data (i.e. HIV testing, ART)
 Examination of trends in HIV prevalence and mortality in
relation to ART and PMTCT availability and service
uptake
Source: Case Study. Country-enhanced monitoring
and evaluation for antiretroviral therapy scale-up:
analysis and use of strategic information in
Botswana. WHO 2006.
Source: Case Study. Country-enhanced monitoring and
evaluation for antiretroviral therapy scale-up: analysis
and use of strategic information in Botswana. WHO
2006.
Source: Case Study. Country-enhanced monitoring and
evaluation for antiretroviral therapy scale-up: analysis
and use of strategic information in Botswana. WHO
2006.
Source: Case Study. Country-enhanced monitoring and
evaluation for antiretroviral therapy scale-up: analysis
and use of strategic information in Botswana. WHO
2006.
Conclusions of Botswana
Analysis
 Since the inception the ART programme,
Botswana has achieved reductions in mortality of
adults aged 25–54 years
 Reduced mortality is associated with early
initiation of district ART programmes and with the
overall rate of ART uptake in the district.
Source: Case Study. Country-enhanced monitoring and evaluation for antiretroviral therapy scale-up: analysis and use of
strategic information in Botswana. WHO 2006.
Source: Case Study. Country-enhanced monitoring and
evaluation for antiretroviral therapy scale-up: analysis
and use of strategic information in Botswana. WHO
2006.
Strengths and Limitations of
Triangulation
 Strengths
 Pre-existing data sources are used
 Can provide relatively rapid results
 Limitations
 Existing data may be insufficient
 Institutional barriers to data sharing
Triangulation Resources
 HIV Triangulation Resource Guide: Synthesis of
Results from Multiple Data Sources for Evaluation
and Decision-making (WHO 2009)
 Data Triangulation for HIV Prevention Program
Evaluation in Low and Conncetrated Epidemics (FHI
2010)
MEASURE Evaluation is a MEASURE project funded by the
U.S. Agency for International Development and implemented by
the Carolina Population Center at the University of North Carolina
at Chapel Hill in partnership with Futures Group International,
ICF Macro, John Snow, Inc., Management Sciences for Health,
and Tulane University. Views expressed in this presentation do not
necessarily reflect the views of USAID or the U.S. Government.
MEASURE Evaluation is the USAID Global Health Bureau's
primary vehicle for supporting improvements in monitoring and
evaluation in population, health and nutrition worldwide.

Triangulation.ppt

  • 1.
  • 2.
    Objectives:  At theend of the session, participants will be able to:  Describe the role of data triangulation in program evaluation  List data sources and approaches that can be used for triangulated analysis
  • 3.
    Data Triangulation forM&E  Linking different information sources involving persons, place and time  Analysis of data from multiple sources can increase the validity and reliability of findings; it can corroborate findings and weakness of any one data source can be compensated for by the strengths of another  Analysis of program level data with outcome/impact level data can help substantiate the linkage between program interventions and population-level outcomes/impacts
  • 4.
    Questions that datatriangulation can help address:  Are interventions working and are they making a difference?  What changes in population-level outcome and impact indicators have been observed and what do they mean?  Can the observed changes in outcomes and impact indicators be attributed to program outputs?  Are the collective efforts being implemented on a large enough scale to impact the course of the epidemic? Source: A framework for monitoring and evaluating HIV prevention programmes for most-at-risk populations. UNAIDS 2007
  • 5.
    Source of data Repeated HIV and/or STI prevalence surveys/surveillance  Repeated population surveys with behavioral data  Routine program or service delivery data  Quality of service assurance and quality improvement assessments  Qualitative studies (in-depth interviews, focus group discussions, key informant interviews, etc) Source: A framework for monitoring and evaluating HIV prevention programmes for most-at-risk populations. UNAIDS 2007
  • 6.
    When to doData Triangulation  When interventions have been in place for a sufficient duration of time to reasonably expect that changes at the population level may be attributable to program interventions  When interventions have been implemented with sufficient intensity and with high enough coverage to reasonably expect effects to be observed in the target population.  When good program-level data (i.e outputs, coverage, quality of implementation are available) are available  When process evaluation indicates that program activities are being realized as planned. Source: A framework for monitoring and evaluating HIV prevention programmes for most-at-risk populations. UNAIDS 2007
  • 7.
    Considerations  Is therea culture of data sharing?  Are data from different sources representative of te population ofinterest?  Do the time frames of te data points match?
  • 8.
    Example 1: Female SexWorker Program in Nepal Family Health International
  • 9.
    Logic of theprogram in Nepal  Reach people with information to increase their knowledge and awareness  Provide services to allow them to act on that knowledge  Expand coverage of information and services so that so that changes are observable at the population- level  Improve the quality of services while expanding coverage (e.g. STI treatment)  Information and good quality services for enough target group members will lead to service use, which will lead to safer behaviour and lower risk of exposure to HIV Source: FHI Regional Office, Bangkok.
  • 10.
    Number of sexworkers reached and contacts by type of staff 0 2,000 4,000 6,000 8,000 10,000 12,000 14,000 16,000 2000 2001 2002 2003 2004 Year Total Number Reached Total Number of Contacts - Outreach Workers Total Number of Contacts - Peer Educators FHI Nepal, 2005 Program records indicate the program is being delivered and reaching more of the target population through more channels over time Source: FHI Regional Office, Bangkok.
  • 11.
    This increasing coverageis confirmed by FSWs in target areas (exposure to NGO-related activities among FSWs, 1998 – 2002) 29 31 61.8 68.3 32.3 30 47.8 64.8 38.5 48 63 74 52 44.3 68 21.5 19.3 39.3 44.3 56.4 0 10 20 30 40 50 60 70 80 90 100 1998 1999 2000 2001 2002 Percentage (%) Received condoms Received brochures/booklets/pamphlets Received other information about HIV/AIDS Received items/information from all three sources Source: FHI Regional Office, Bangkok.
  • 12.
    There were signsof improved quality of services e.g. STI diagnosis and treatment Quality Criteria Situation Prior to Dec. 2003 Current Situation Treatment All STI patients receiving treatment as per the STI management guidelines. Drug quality needs to be standardized. Follow up visits are infrequent. Compliance of the drug therapy cannot be assured with multi-dose drugs. Drugs supply is of better quality. Drugs are mostly single dose and taken under direct observation, improving compliance Clinic location & accessibility Most static clinics placed centrally in the town and are easily accessible but mobile clinics are kept at DIC or government owned offices and changed from time to time Static clinics which were not appropriately located have been changed and improved Clinic setup Clinics have mostly 3 rooms one each for registration, consultation and laboratory test. Only some of the clinics have private rooms for consultation and examination VCT now integrated into STI clinics, and a separate room for counseling has been added in most static clinics Staffing Clinical teams consist of 3 persons: one medical officer, a staff nurse and a laboratory technician. Frequent turnover of the trained staff. Addition of one trained VCT counselor in static clinics. Staff turnover rate has decreased. Clinical Skill General history taking, general and genital examination are performed confidently, oral and anal examinations are not routinely conducted Improved sexual history taking skills and clinical skills, but regular guidance still needed. Source: FHI Regional Office, Bangkok.
  • 13.
    Trends in desirableoutcomes are evident – Knowledge of condoms is high among FSWs and condom carrying behavior is increasing over time, 1998 - 2002 94.5 98 98.3 99.3 92.8 95.8 97.9 96.9 92.2 85 28.3 34.7 39.3 54.8 58.4 0 10 20 30 40 50 60 70 80 90 100 1998 1999 2000 2001 2002 Percentage (%) Ever heard of condoms Know using condom can prevent HIV transmission Usually carry condoms with them Source: FHI Regional Office, Bangkok.
  • 14.
    Trends in DesirableOutcomes are evident – Condom use with clients among FSWs is increasing steadily over time, 1998 - 2002 77.5 82.3 94 95 61.8 67 87.3 90.3 33 40.3 51 54.3 19.8 26.5 36.3 40.2 93.3 86 44.8 38.7 0 10 20 30 40 50 60 70 80 90 100 1998 1999 2000 2001 2002 Percentage (%) Ever use of condoms Use of condoms with last client Consistent use of condoms with clients in the past year Gave condom to client at last sex Source: FHI Regional Office, Bangkok.
  • 15.
    Those Reached bythe Program Have Safer Behaviors: Exposure to various NGO-related activities in the past year impacts on consistent condom use with clients among FSWs - 2002 64.8 65.7 36.7 37.3 61.5 38.4 0 10 20 30 40 50 60 70 80 90 100 Received condoms Received brochures & materials Received IPC information about HIV/AIDS Consistent Condom Use (%) Exposed Unexposed Source: FHI Regional Office, Bangkok.
  • 16.
    There is evidenceof a favourable Dose-Response relationship: Greater exposure to various NGO-related activities results in better condom use behavior - 2002 24.6 33.3 75.8 28.2 39.7 42.1 68 69.2 76.2 83.9 91.9 48.2 0 10 20 30 40 50 60 70 80 90 100 None Any one* Any two* All three* Percentage (%) Carrying condoms Consistent condom use with clients Consistent condom use with regular clients *1) Received condoms, 2) received brochures/materials, 3) received IPC information about HIV/AIDS Source: FHI Regional Office, Bangkok.
  • 17.
    Summary of KeyFindings among FSWs  Program activities have expanded in scale and improved in quality  HIV and STI prevalence are decreasing over time  Knowledge of condoms is high and consistent condom use is increasing and high among clients and regular clients  Exposure to NGO-related information sources about HIV/AIDS and condoms is increasing and high  Exposure to various NGO-related activities is increasing and high  Exposure to NGO-related activities is strongly linked with condom carrying & consistent condom use in a dose-response manner Source: FHI Regional Office, Bangkok.
  • 18.
    Example 2: Botswana Antiretroviralscale-up in Botswana National AIDS Committee Botswana, WHO, UCSF and UNAIDS (2006)
  • 19.
    Overview of BotswanaTriangulation  Objective:  To develop a model to measure the impacts of ART and PMTCT programs on adult and child mortality  Application:  Provide timely information on the impact of national scale-up of ART for policy and programmatic decision making Source: Case Study. Country-enhanced monitoring and evaluation for antiretroviral therapy scale-up: analysis and use of strategic information in Botswana. WHO 2006.
  • 20.
    Approach  Meetings withstakeholders to identify objectives of analysis  Identification and compilation of data from many sources  Vital statistics (morbidity and mortality)  Population survey data  Patient Management systems (HMIS)  Program data (i.e. HIV testing, ART)  Examination of trends in HIV prevalence and mortality in relation to ART and PMTCT availability and service uptake Source: Case Study. Country-enhanced monitoring and evaluation for antiretroviral therapy scale-up: analysis and use of strategic information in Botswana. WHO 2006.
  • 21.
    Source: Case Study.Country-enhanced monitoring and evaluation for antiretroviral therapy scale-up: analysis and use of strategic information in Botswana. WHO 2006.
  • 22.
    Source: Case Study.Country-enhanced monitoring and evaluation for antiretroviral therapy scale-up: analysis and use of strategic information in Botswana. WHO 2006.
  • 23.
    Source: Case Study.Country-enhanced monitoring and evaluation for antiretroviral therapy scale-up: analysis and use of strategic information in Botswana. WHO 2006.
  • 24.
    Conclusions of Botswana Analysis Since the inception the ART programme, Botswana has achieved reductions in mortality of adults aged 25–54 years  Reduced mortality is associated with early initiation of district ART programmes and with the overall rate of ART uptake in the district. Source: Case Study. Country-enhanced monitoring and evaluation for antiretroviral therapy scale-up: analysis and use of strategic information in Botswana. WHO 2006. Source: Case Study. Country-enhanced monitoring and evaluation for antiretroviral therapy scale-up: analysis and use of strategic information in Botswana. WHO 2006.
  • 25.
    Strengths and Limitationsof Triangulation  Strengths  Pre-existing data sources are used  Can provide relatively rapid results  Limitations  Existing data may be insufficient  Institutional barriers to data sharing
  • 26.
    Triangulation Resources  HIVTriangulation Resource Guide: Synthesis of Results from Multiple Data Sources for Evaluation and Decision-making (WHO 2009)  Data Triangulation for HIV Prevention Program Evaluation in Low and Conncetrated Epidemics (FHI 2010)
  • 27.
    MEASURE Evaluation isa MEASURE project funded by the U.S. Agency for International Development and implemented by the Carolina Population Center at the University of North Carolina at Chapel Hill in partnership with Futures Group International, ICF Macro, John Snow, Inc., Management Sciences for Health, and Tulane University. Views expressed in this presentation do not necessarily reflect the views of USAID or the U.S. Government. MEASURE Evaluation is the USAID Global Health Bureau's primary vehicle for supporting improvements in monitoring and evaluation in population, health and nutrition worldwide.