Download to read offline


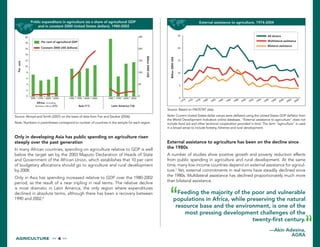


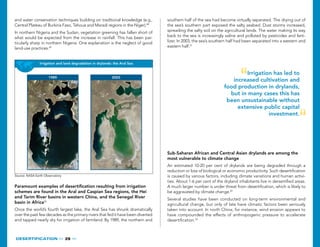


This document discusses trends in sustainable development related to agriculture, rural development, land, desertification, and drought. It notes that while agricultural productivity has increased globally, significant gaps remain between regions. Cereal yields have increased substantially worldwide since the 1960s due to improved varieties and irrigation, except in Sub-Saharan Africa which relies more on expanding cultivated area. Irrigation is far more extensive in Asia than Africa. Only in Asia has public spending on agriculture risen steeply over the past decades.


![Fullreport[1]](https://cdn.slidesharecdn.com/ss_thumbnails/fullreport1-120214140553-phpapp01-thumbnail.jpg?width=640&height=640&fit=bounds)


