Download to read offline


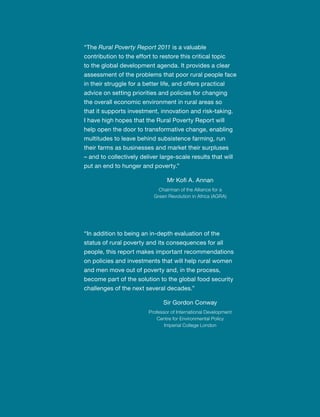
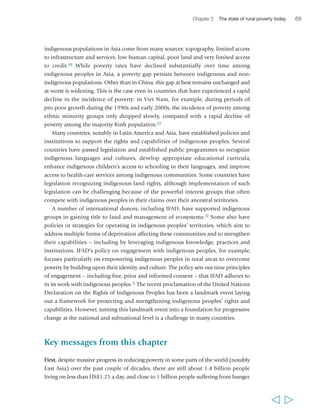
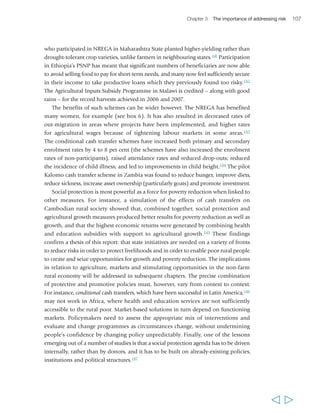
![One of the young people quoted in this report, 19-year-old Manantane Babay
from Madagascar, sums up this spirit:
“I really hope to have improved in the future, with some livestock, and my family all
healthy… I’d have a few head of cattle, sheep, goats and chickens, many chickens. Then my
life would have changed. And then I’d feel better about myself. I always believe that it will
be different; I do believe that it will be better.”
So does 25-year-old Javed Iqbal, from Pakistan:
”The wages which I will get from daily labour, I will spend on my children’s education.
I will enrol my children in a good school, [using] the savings from daily wage labour or from
selling a goat kid…”
A very large proportion of those now living in poverty in rural areas are children and
young people. They are the ones who will have to deal with the impact of today’s
transformations. And they are the ones who most need to see rural areas as places
where they can fulfil their aspirations. First and foremost, this report is for them – for
their future, and as the caretakers of our planet’s future.
Kanayo F. Nwanze
President
International Fund for Agricultural Development
Foreword 11](https://image.slidesharecdn.com/random-140910120614-phpapp02/85/The-Rural-Poverty-Report-2011-13-320.jpg)
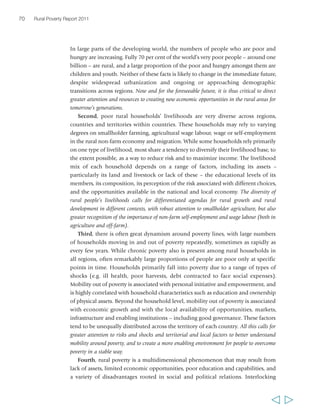
![Chapter 1 Introduction 31
were actually in the Middle East and North Africa (an increase of 14 per cent) and
Latin America and the Caribbean (an increase of 13 per cent).5 This is not, of course,
only due to the price surge itself, but rather to broader underlying problems. In the
Middle East and North Africa, for example, the crisis
happened within an environment characterized by
long-term growing pressure on food security linked
to economic growth, rising demand for foods
(especially high value products), a declining farming
population and a deteriorating resource base.6
While international food prices have declined
since mid-2008, they remain substantially higher
than they were prior to mid-2007, and there is now
broad recognition that rising demand combined
with growing natural resource and energy scarcities
will likely drive a steady reversal of long-established
low price trends – at least for certain commodities
(notably basic food commodities). Most recently,
for example, the Organisation for Economic
Co-operation and Development (OECD) and FAO
have projected that international prices for most
agricultural commodities (including crop and
livestock products) are set to remain at 2010 levels
or higher, at least for the next decade.7
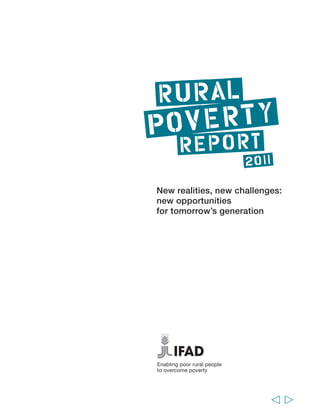
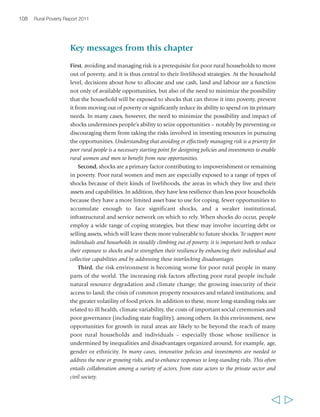
Following the food price surge, a number of
“Every year, prices become higher. For
example, the price of a butter plate
(about 0.5 kilograms) was six pounds
ten years ago. Today, the price
reached forty pounds. After all, the
income is limited. You can see we are
now destitute. We do not feel secure.”
development initiatives emerged to address the
threats and opportunities that higher prices
presented for agriculture and food security in
developing countries. In this context, smallholder
agriculture has received unprecedented global
attention. In the summer of 2008, for example, the
United Nations High-Level Task Force on the
Global Food Security Crisis produced the
Comprehensive Framework for Action, which
recommended support to smallholders among the
immediate actions meant to help vulnerable
people and build more resilient food systems.
Other initiatives have followed, including the 2009 G8 L’Aquila Food Security
Initiative and the subsequent Global Agriculture and Food Security Programme,
which also emphasize smallholder farming in developing countries as part of the
solution to feeding the populations of these countries and the world.
Ibrahiem Abo Zeid,
male, 55 years, Egypt
“In the past people would cultivate
cabbage and garlic, as there were
better seeds. At the time seeds
cost Rs. 400 to 600 per maund
(40 kilograms), but now they cost
Rs. 6,000 to 12,000. As people are
poor, they do not grow vegetables
but only grow wheat and maize. They
do not cultivate any other crop. They
cultivated [other crops] in the past but
don’t do so now due to the price hike.”
Rasib Khan,
male, 28 years, Pakistan](https://image.slidesharecdn.com/random-140910120614-phpapp02/85/The-Rural-Poverty-Report-2011-33-320.jpg)
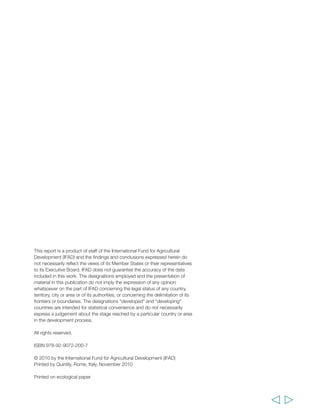
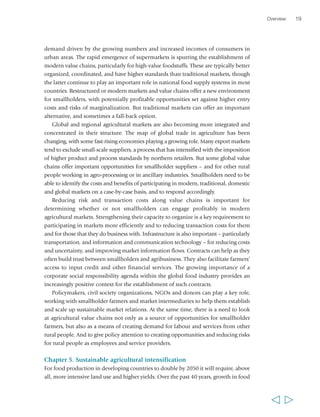
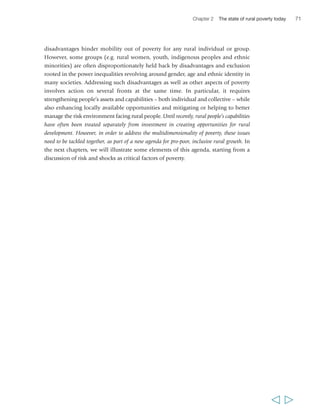
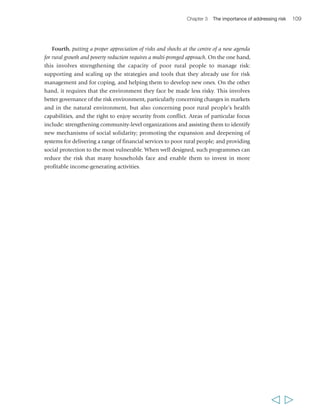
![Pascaline Bampoky is a 30-year old mother
of three living in Senegal. She had a hard
start in life: “I am an orphan. I lost my
parents at a tender age. I was brought up
by my aunt.” She had a primary education
but nothing more: “No one was there to pay
for my secondary education.” Her aunt got
her a job as a housemaid in Dakar: “It was
the only thing I was good at. There was no
alternative.” It was there she met her
husband, who ran a small shop.
When his father died, they moved back to
Bignona, Casamance, to look after her
husband’s grandfather and they transferred
the business there. Together the couple also
work the grandfather’s rice fields. He raises
the seedlings and ploughs the land; she
plants the rice and gathers the harvest. They
grow just enough to feed the family for three
months. “We don’t have enough resources
or land to produce more.” One year they
tried millet in addition to the rice, another year
cassava: “But it [produced] really very little,
for our own consumption and not for sale.”
Although she deeply regrets her lack of
education and training, Pascaline believes
“women are naturally good managers” and
she is pursuing other means of making a
living. She raises chickens and pigs for sale,
and uses the income for school fees and
medical expenses. She has also started a
small ice-cream business: “Well, after the
harvests I am in my kitchen and my house
as a wife and a mother. But I also have a
small trade activity that I carry out from time
to time. We have a refrigerator, so I make ice
cream to sell.” She buys the fruits at market,
makes the ice cream at home and sells it
at schools and “sometimes at church”. Her
husband gave her the start-up money.
Pascaline is a member of the local women’s
association. During the rainy season they
offer their labour, planting or harvesting rice.
The fee for fellow members is lower than for
those outside the association. The rate, she
explains, “may sound cheap to you, but
remember the basic objective of the
association is solidarity.” The money raised
is shared among the members, and often
used to buy cloth, and also to create a fund
to assist members in difficulty. Such
assistance is provided as loans, which she
says are always paid back: “It is a question
of honour.”
44
Rural Poverty Report 2011](https://image.slidesharecdn.com/random-140910120614-phpapp02/85/The-Rural-Poverty-Report-2011-45-320.jpg)
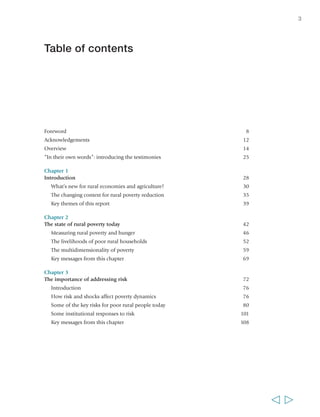
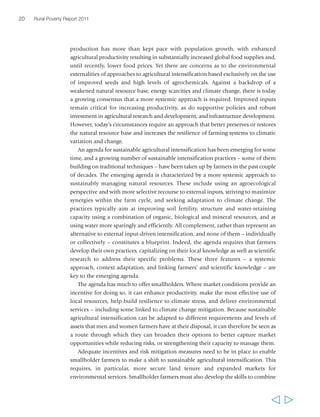
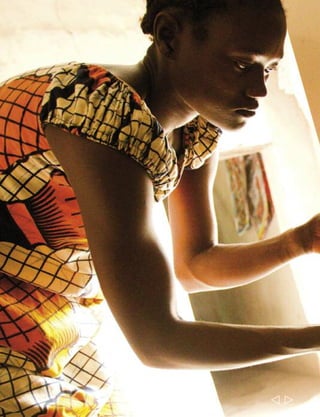
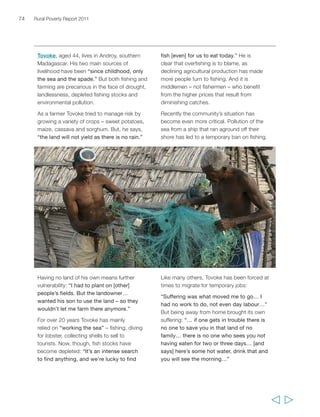
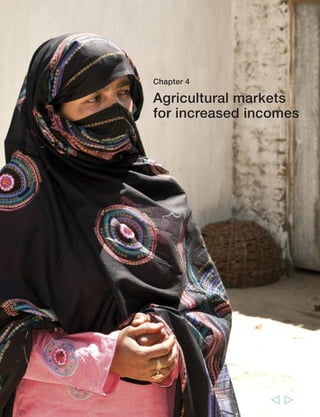
![Muhammad Naveed, 22, is from a large family
in Akhoon Bandi, Pakistan. Five married siblings
live separately, the three brothers having their own
share of the family’s land. Four younger unmarried
brothers, including Muhammad, live with their
parents and farm together. Although agriculture
remains central to the extended family’s survival,
it does not produce enough to meet their living
costs. The expense of hiring tractors,
transporting produce to market, purchasing
inputs, and occasionally extra labour, all eat into
slim profits – but the “biggest problem” says
Muhammad, “is that of water.” Irrigation is
extremely labour-intense – “we work day and
night on irrigation” – and their non-irrigated
fields produce nothing when rainfall is low.
The family have two buffaloes, and a few cows
and goats, largely looked after by Muhammad’s
mother. The milk of one buffalo is sold; that of
the second is for the family, including the
children of the married brothers. The latter all
have other jobs as well as farming: two as
drivers, one as a tailor. Muhammad and his older
brother Sheraz, still living at home, also take
waged work when they can. Sheraz, like his
father, finds occasional work with local masons
and has tried for a job on the railways.
Muhammad worked in a milk shop in Karachi for
Chapter 2 The state of rural poverty today 45
a year, but city living expenses eroded any
savings. He then got work as a driver and
managed to save a little: “I was able to
save about 4,000 rupees… I would keep
1,500 rupees for my own expenses and the
rest I sent home to my father.” The two
youngest brothers are still studying.
With the money he made from the sale of
another buffalo, Muhammad did a training course
in plumbing and invested in a ‘middleman’ who is
trying to find him work abroad. He has heard
nothing so far, but says, “I have also applied to
the army, and also the police.”
Despite their need for off-farm work,
Muhammad is convinced that farming is
indispensable, and preferable to unreliable and
exploitative waged labour: “We want to
continue [farming]. Without it we cannot run
our household… And it’s one’s own work
and so one works hard… When we do labour
outside… they stand on our heads to make
sure we work… They also give salary at their
own discretion… Sometimes they give it
after a month. Sometimes 10 to 15 days
after the month-end. The household is not
run this way…” He concludes: “That’s why
working outside is very difficult. We are
better at home. We are better off farming.”](https://image.slidesharecdn.com/random-140910120614-phpapp02/85/The-Rural-Poverty-Report-2011-46-320.jpg)
![income to make up three-quarters of their total income. However, there are variations
across regions and countries. On-farm production is a particularly important income
source in sub-Saharan Africa: at the national level, between 40 and 70 per cent of
rural households earn more than three-quarters of their income from on-farm sources.
In other regions, livelihoods are more diversified: in Asia, between 10 and 50 per cent
earn more than three-quarters of their income from on-farm sources (and in India,
for example, only 1 in 5 agricultural households now earns all of their income
from agriculture),40 while in Latin America only 10 to 20 per cent do. Yet, while
specialization in agriculture may be the exception rather than the rule in much of the
world, agriculture continues to play a key role in the economic portfolios of rural
households: in 11 of the 15 sample countries, about 80 per cent of rural households
continue to engage in farm activities of some sort, even if it is only part-time and to
grow some of their own food requirements.41
Access to wage employment is an important component of household income in
some regions. It is of greatest importance in the countries from Latin America and Asia,
54
Rural Poverty Report 2011
“The [extremely poor] are
those that have no field to
go to. In the morning the
children aren’t herding
cattle, in the evening there
are no chickens fluttering in
their yard. That’s how they
are known. They never go to
a field, they’re always in the
village and the children
don’t herd, morning, noon or
night. They just sit there.”
Manantane Babay,
male, 19 years, Madagascar
“[Poverty] means the person
is stuck. You cannot go
anywhere or do anything to
get out of the situation. You
are not in a mood to rejoice.
You can get rough with your
children. You fear the future.”
Abibatou Goudiaby,
female, 21 years, Senegal
“Physical strength is our
capital and can support the
family. But I cannot do that
because of my present
situation [as a disabled
person]. If my wife was
alive, she could earn some
income and we could cope.”
Zhang Guobao,
male, 43 years, China
“Being poor means not
having money, an income…
Peasants, they are paid their
daily wage, and that serves
them for food. But when they
get sick, they don’t have
money to afford [medical]
expenses… and the health
staff treat them badly.”
Doris Consuelo
Sánchez Santillán,
female, 36 years, Peru
“The poor worker is the
poorest. If he loses his ability
to work, he won’t be able to
feed his children. God knows
[the reason for his poverty].
Sometimes it is because
there is no work, or because
he depends on his physical
strength. And so if he loses
it, he won’t be able to work.”
Nawal Mohamed Khalil,
female, 47 years, Egypt
Who are ‘the poor’? Some views from different regions](https://image.slidesharecdn.com/random-140910120614-phpapp02/85/The-Rural-Poverty-Report-2011-55-320.jpg)
![Chapter 2 The state of rural poverty today
where between 20 and 40 per cent of rural households participate in agricultural wage
labour, and the same proportion participate in non-farm wage labour. In Latin America,
agricultural or non-agricultural wages make up three-quarters of the total income for
between 24 and 31 per cent of rural households. Non-farm self-employment is important
everywhere, with typically between 20 and 40 per cent of rural households relying on it.42
In almost all countries, the share of non-farm income in total rural household income
is increasing, and in some countries this is happening rapidly (figure 6).
In virtually all of the countries in the RIGA dataset from sub-Saharan Africa, Latin
America and Asia, the poorer rural households derive the highest proportion of their
incomes from farming and agricultural labour, while the better-off households derive
the most from non-farm activities. In all cases, income gains at the household level
are associated with a shift towards more non-agricultural wage and self-employment
income. Access to non-agricultural labour and higher wages is largely dependent on
higher levels of education. Low-return agricultural wage labour is associated with no
or low levels of education, and is therefore of greatest importance to the poorest
households (see annex 3).
55
“[Out of the 45 families here]
about 10 families are poor,
they don’t work the land.
They cannot because they
are too old or handicapped
or the like. Yes, we do
[consider ourselves poor],
because we cannot supply
our needs. When we have to
go to Mendoza, or to the
health post if we fall sick, we
cannot get money because
we haven’t sold enough –
it’s complicated…”
José del Carmen Portocarrero
Santillán, male, 82 years, Peru
“Those that are landless and
have no other source of
income [are the poorest].
Some are labourers… They
survive with great difficulty.
If they get a wage one day
they may be without work
for three to four days. Their
household runs with support
from neighbours – if they are
better off – and others in the
village. They help out. And
those that earn well in
farming give wheat grain.
Some people also give
money. That is how the poor
survive. There is a lot of
poverty in this village.”
Muhammad Naveed,
male, 22 years, Pakistan
“Rarake means having no
wealth, having no relatives,
having no animals… like me,
myself! I am truly rarake at
this time. First of all I have
no field, secondly I have no
father, and I have no mother.
My mother died, my father
died… My family is just
myself, so I’m truly what’s
called rarake.”
Tovoke,
male, 44 years, Madagascar
“When a dust-devil year
goes by, a time of famine,
you can see the rich in the
market purchasing food…
So they are living… The
have-not is not purchasing…
in fact the have-not will
be begging.”
Randriamahefa,
male, 49 years, Madagascar](https://image.slidesharecdn.com/random-140910120614-phpapp02/85/The-Rural-Poverty-Report-2011-56-320.jpg)
![56 Rural Poverty Report 2011
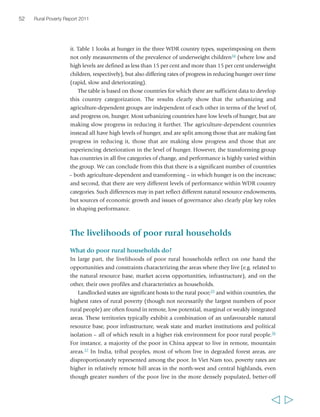
Rural to urban and international migration are also important for many rural
households as a livelihood strategy and as a tool for managing risk related to
agriculture and other rural-based activities. Migration can provide opportunities for
more secure incomes and for better access to education, especially beyond the primary
level. A recent study finds that, while it may not be the people from the poorest
households who migrate, it is people from the poorest areas who do so.43 Remittances
have become a significant element of household incomes in much of the developing
world; in most of the countries in the RIGA dataset from sub-Saharan Africa, Latin
America and Asia, between 20 and 80 per cent of rural households received private
transfers. There is also a very mixed pattern of transfers by level of income: although
wealthier households generally gain more in absolute terms, poor households count
remittances as a vital component of their income and a key element of their strategies
to reduce their vulnerability to food insecurity and address sources of risk.
The discussion so far has focused on livelihood strategy patterns and differences
among them at regional and country levels. Yet it is also important to bear in mind that
economic opportunities within and outside agriculture and, as a result, household
“A person believes he’ll relinquish
some of his poverty, that he’ll find
something small [to help him] when
he migrates. To find relief from
poverty, to find something small, to
purchase a cow, which would bear
offspring… that’s what one looks
for in migration.”
Manantane Babay,
male, 19 years, Madagascar](https://image.slidesharecdn.com/random-140910120614-phpapp02/85/The-Rural-Poverty-Report-2011-57-320.jpg)
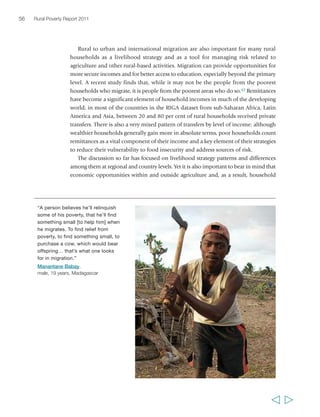
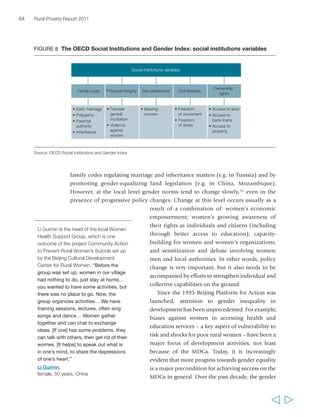
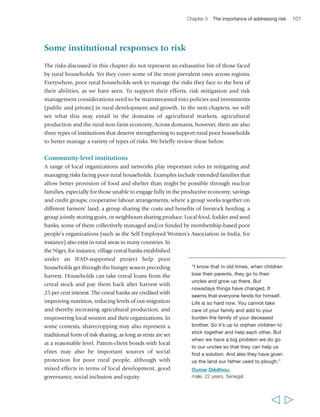
![FIGURE 8 The OECD Social Institutions and Gender Index: social institutions variables
• Early marriage
• Polygamy
• Parental
authority
• Inheritance
• Fermale
genital
mutilation
• Violence
against
women
Son preference
Civil liberties
Ownership
rights
family codes regulating marriage and inheritance matters (e.g. in Tunisia) and by
promoting gender-equalizing land legislation (e.g. in China, Mozambique).
However, at the local level gender norms tend to change slowly,56 even in the
presence of progressive policy changes. Change at this level occurs usually as a
result of a combination of: women’s economic
empowerment; women’s growing awareness of
their rights as individuals and citizens (including
through better access to education); capacity-building
for women and women’s organizations;
and sensitization and debate involving women,
men and local authorities. In other words, policy
change is very important, but it also needs to be
accompanied by efforts to strengthen individual and
collective capabilities on the ground.
Since the 1995 Beijing Platform for Action was
launched, attention to gender inequality in
development has been unprecedented. For example,
biases against women in accessing health and
education services – a key aspect of vulnerability to
risk and shocks for poor rural women – have been a
major focus of development activities, not least
because of the MDGs. Today, it is increasingly
evident that more progress towards gender equality
is a major precondition for achieving success on the
MDGs in general. Over the past decade, the gender
64 Rural Poverty Report 2011
Li Guimin is the head of the local Women
Health Support Group, which is one
outcome of the project Community Action
to Prevent Rural Women’s Suicide set up
by the Beijing Cultural Development
Center for Rural Women. “Before the
group was set up, women in our village
had nothing to do, just stay at home…
you wanted to have some activities, but
there was no place to go. Now, the
group organizes activities… We have
training sessions, lectures, often sing
songs and dance… Women gather
together and can chat to exchange
ideas. [If one] has some problems, they
can talk with others, then get rid of their
worries. [It helps] to speak out what is
in one’s mind, to share the depressions
of one’s heart.”
Li Guimin,
female, 50 years, China
Social institutions variables
Family code Physical integrity
• Missing
women
• Freedom
of movement
• Freedom
of dress
• Access to land
• Access to
bank loans
• Access to
property
Source: OECD Social Institutions and Gender Index](https://image.slidesharecdn.com/random-140910120614-phpapp02/85/The-Rural-Poverty-Report-2011-65-320.jpg)
![66 Rural Poverty Report 2011
of households headed by elderly people. In many circumstances, orphaned children
lose whatever asset base their households previously had, notably land; this severely
undermines their capacity to cope with any kind of shocks. More generally, in areas
where there has been growing land scarcity and fragmentation, children and youth
are at a particular disadvantage as they are less likely than their parents’ generation
to inherit sufficient land assets to build a livelihood. Moreover, children and youth
are always particularly affected by the direct and indirect impact of conflict, which
may lead to displacement, disruption of schooling patterns and food insecurity.
Deprivations affecting human capital and individual capabilities are of particular
importance for children, as they are likely to have lasting effects on their future.
Primary school education rates have improved all over the developing world: in
2007 net enrolment rates in primary education ranged from 74 per cent in
sub-Saharan Africa to more than 90 per cent in all other developing regions, and the
gap between girls’ and boys’ enrolment rates closed to between 90 and 100 per cent
everywhere.61 There has been less improvement in enrolment rates for secondary
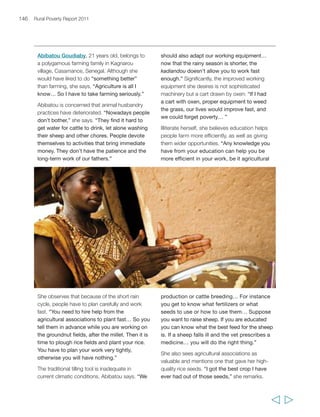
“When you are educated you
can understand and do certain
things yourself. That’s why I
urge my children to study and
do everything for them to do
their homework, like buying
kerosene for the lamp. Even
when I don’t have money
myself, I will go out and look
for some way of getting
kerosene. It’s for their future.
It can improve the life of a
peasant. Any knowledge you
have from your education can
help you be more efficient in
your work, be it agricultural
production or cattle breeding…
Suppose you want to raise
sheep… If a sheep falls ill and
the veterinarian prescribes a
medicine – if you don’t know
how to give the medicine to the
sheep you can kill it. But if you
can read the prescription, you
will do the right thing.”
Abibatou Goudiaby,
female, 21 years, Senegal
“My daughter is receiving a
much better education. When I
was her age, I had to do all the
household chores at my home,
but she doesn’t [do those]…
My son attends a private school
because his former government
school didn’t guarantee enough
for us [about the quality of
education]. He is a hyperactive
kid, and has fallen two or three
times to the floor. So we made
a big effort and enrolled him in
a private school, so that he
would feel better.”
Doris Consuelo Sánchez
Santillán, female, 36 years, Peru
“We have to think about our
children. We say that if we can
save even a straw we will
definitely educate our children.
Our parents didn’t think so.
They definitely thought about
it but they didn’t have the
resources. Their condition was
such that they didn’t have
anything. So they couldn’t
educate us. Our children, we
are trying to educate them,
educate them well, send them
to good schools, make them
into good human beings. It is
not necessary only that they
have permanent employment…
[but also that they] become
good human beings.”
Shazia Bibi,
female, 37 years, Pakistan
The importance of education for the children of rural people](https://image.slidesharecdn.com/random-140910120614-phpapp02/85/The-Rural-Poverty-Report-2011-67-320.jpg)
![74 Rural Poverty Report 2011
Tovoke, aged 44, lives in Androy, southern
Madagascar. His two main sources of
livelihood have been “since childhood, only
the sea and the spade.” But both fishing and
farming are precarious in the face of drought,
landlessness, depleted fishing stocks and
environmental pollution.
As a farmer Tovoke tried to manage risk by
growing a variety of crops – sweet potatoes,
maize, cassava and sorghum. But, he says,
“the land will not yield as there is no rain.”
Having no land of his own means further
vulnerability: “I had to plant on [other]
people’s fields. But the landowner…
wanted his son to use the land – so they
wouldn’t let me farm there anymore.”
For over 20 years Tovoke has mainly
relied on “working the sea” – fishing, diving
for lobster, collecting shells to sell to
tourists. Now, though, fish stocks have
become depleted: “It’s an intense search
to find anything, and we’re lucky to find
fish [even] for us to eat today.” He is
clear that overfishing is to blame, as
declining agricultural production has made
more people turn to fishing. And it is
middlemen – not fishermen – who benefit
from the higher prices that result from
diminishing catches.
Recently the community’s situation has
become even more critical. Pollution of the
sea from a ship that ran aground off their
shore has led to a temporary ban on fishing.
Like many others, Tovoke has been forced at
times to migrate for temporary jobs:
“Suffering was what moved me to go… I
had no work to do, not even day labour…”
But being away from home brought its own
suffering: “… if one gets in trouble there is
no one to save you in that land of no
family… there is no one who sees you not
having eaten for two or three days… [and
says] here’s some hot water, drink that and
you will see the morning…”](https://image.slidesharecdn.com/random-140910120614-phpapp02/85/The-Rural-Poverty-Report-2011-74-320.jpg)
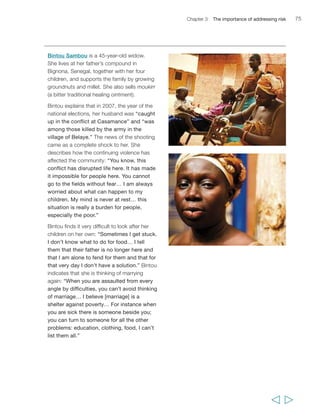
![Chapter 3 The importance of addressing risk 75
Bintou Sambou is a 45-year-old widow.
She lives at her father’s compound in
Bignona, Senegal, together with her four
children, and supports the family by growing
groundnuts and millet. She also sells moukirr
(a bitter traditional healing ointment).
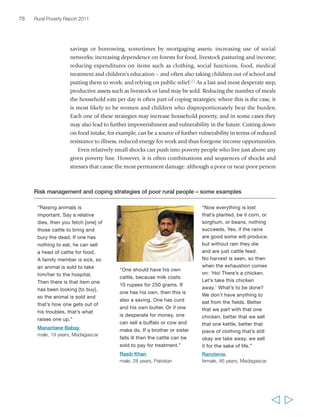
Bintou explains that in 2007, the year of the
national elections, her husband was “caught
up in the conflict at Casamance” and “was
among those killed by the army in the
village of Belaye.” The news of the shooting
came as a complete shock to her. She
describes how the continuing violence has
affected the community: “You know, this
conflict has disrupted life here. It has made
it impossible for people here. You cannot
go to the fields without fear… I am always
worried about what can happen to my
children. My mind is never at rest… this
situation is really a burden for people,
especially the poor.”
Bintou finds it very difficult to look after her
children on her own: “Sometimes I get stuck.
I don’t know what to do for food… I tell
them that their father is no longer here and
that I am alone to fend for them and that for
that very day I don’t have a solution.” Bintou
indicates that she is thinking of marrying
again: “When you are assaulted from every
angle by difficulties, you can’t avoid thinking
of marriage… I believe [marriage] is a
shelter against poverty… For instance when
you are sick there is someone beside you;
you can turn to someone for all the other
problems: education, clothing, food, I can’t
list them all.”](https://image.slidesharecdn.com/random-140910120614-phpapp02/85/The-Rural-Poverty-Report-2011-75-320.jpg)
![78 Rural Poverty Report 2011
savings or borrowing, sometimes by mortgaging assets; increasing use of social
networks; increasing dependence on forests for food, livestock pasturing and income;
reducing expenditures on items such as clothing, social functions, food, medical
treatment and children’s education – and often also taking children out of school and
putting them to work; and relying on public relief.77 As a last and most desperate step,
productive assets such as livestock or land may be sold. Reducing the number of meals
the household eats per day is often part of coping strategies; where this is the case, it
is most likely to be women and children who disproportionately bear the burden.
Each one of these strategies may increase household poverty, and in some cases they
may also lead to further impoverishment and vulnerability in the future. Cutting down
on food intake, for example, can be a source of further vulnerability in terms of reduced
resistance to illness, reduced energy for work and thus foregone income opportunities.
Even relatively small shocks can push into poverty people who live just above any
given poverty line. However, it is often combinations and sequences of shocks and
stresses that cause the most permanent damage: although a poor or near-poor person
Risk management and coping strategies of poor rural people – some examples
“Raising animals is
important. Say a relative
dies, then you fetch [one] of
those cattle to bring and
bury the dead. If one has
nothing to eat, he can sell
a head of cattle for food.
A family member is sick, so
an animal is sold to take
him/her to the hospital.
Then there is that item one
has been looking [to buy],
so the animal is sold and
that’s how one gets out of
his troubles, that’s what
raises one up.”
Manantane Babay,
male, 19 years, Madagascar
“One should have his own
cattle, because milk costs
10 rupees for 250 grams. If
one has his own, then this is
also a saving. One has curd
and his own butter. Or if one
is desperate for money, one
can sell a buffalo or cow and
make do. If a brother or sister
falls ill then the cattle can be
sold to pay for treatment.”
Rasib Khan,
male, 28 years, Pakistan
“Now everything is lost
that’s planted, be it corn, or
sorghum, or beans, nothing
succeeds. Yes, if the rains
are good some will produce,
but without rain they die
and are just cattle feed.
No harvest is seen, so then
when the exhaustion comes
on: ‘Ho! There’s a chicken.
Let’s take this chicken
away.’ What’s to be done?
We don’t have anything to
eat from the fields. Better
that we part with that one
chicken, better that we sell
that one kettle, better that
piece of clothing that’s still
okay we take away, we sell
it for the sake of life.”
Ranotenie,
female, 46 years, Madagascar](https://image.slidesharecdn.com/random-140910120614-phpapp02/85/The-Rural-Poverty-Report-2011-78-320.jpg)
![or household may be resilient to one shock or stress,
it is much harder to withstand a succession or
combination of them – particularly once they have
been weakened by the first one. In some cases,
combinations of shocks can trap people in poverty
by eroding their assets and capabilities to a point
that they are unable to accumulate enough to move
out of poverty (again). So, for instance, in 2001,
many households in rural Zimbabwe had not
recovered from the previous major drought of the
early 1990s when a new and even worse drought
struck. This made it all the harder for rural
households to rebuild their assets, and it led to a
massive decline in well-being and consumption.78
Deep shocks such as drought, where all community
members suffer at the same time, also undermine
Chapter 3 The importance of addressing risk 79
“Drought and poverty have
consequences. Amongst the
consequences you have the breakdown
of traditional solidarity systems. The
level of poverty is such that no one
thinks of helping others… It is true that
times are hard but all the same some
people in the community have the
capacity to support those who are
vulnerable. If we kill these practices, it
is not poverty that will destroy us, but it
is the strong who will eat the weak as
happens in the aquatic world. But we
are humans and those who have should
come to the rescue of the have-nots. It is
a matter of solidarity, not competition.”
Abdoulaye Badji,
male, 50 years, Senegal
“I grow a lot of crops. You
know, here, you cannot grow
just one crop. If it doesn’t work,
you will be in an impossible
situation for that year. So I
grow millet, groundnuts, maize,
beans and sorghum. I also
grow rice because I go to rice
fields to help my wife.”
Abdoulaye Badji,
male, 50 years, Senegal
“If I’m sick in the night I’ll go
to look for… befelañe (rosy
periwinkle) and varantsihe
(medicinal plant found only in
southern Madagascar)… I boil
and drink [them]. If the disease
is serious, and I’m able, I’ll
go and borrow, and when I’m
healed I’ll go to find work, a
daily job, to pay off my debt.”
Tovoke,
male, 44 years, Madagascar
“When famine comes there
will be only one meal a day,
if one finds it… Only in the
evening will one eat. If he
doesn’t find [anything to eat],
then he won’t even eat that
evening… but will wait for the
next day… If there is raketa,
(prickly pear) then it will be
prickly pear for lunch and the
kapoake (grain) for dinner.
But if the raketa isn’t ripe and
the famine is rife, one will
only eat an evening meal…
Otherwise, not finding, one
just sits. But I’ll make a quick
trip to the sea to [fish with a]
net, dive for sea urchins…
I might make a catch and run
home with that and it’ll be
boiled, and there’s the broth
to drink and we’re free today.”
Manantane Babay,
male, 19 years, Madagascar
“I plan carefully. I know that
school is coming and that I
have to put up the money to
send the kids there. Sometimes
I pay school fees in advance
to avoid the risk of children
not going to school because
I couldn’t pay. For the rest it
is a constant struggle.”
Bintou Sambou,
female, 45 years, Senegal](https://image.slidesharecdn.com/random-140910120614-phpapp02/85/The-Rural-Poverty-Report-2011-79-320.jpg)
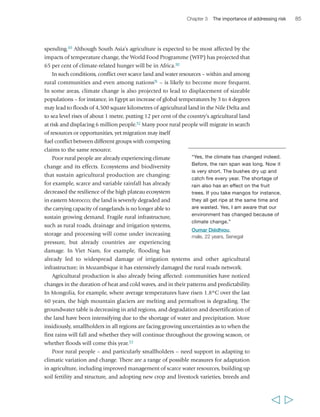
![Chapter 3 The importance of addressing risk 89
positive. Many deals contain promises of financial investment, employment, technology
transfers and income generation, but the evidence is scant as to whether these have
been fulfilled. Initial research suggests that at least some large-scale acquisitions (e.g. for
monoculture plantations in some areas) have not met expectations and have had a
negative impact. But there is also evidence that some foreign investments in agriculture
(typically smaller deals that do not necessarily include land acquisition) are having a
positive impact. The balance of benefits and costs to poor rural people depends on the
details of land deal negotiations. However, many of the long-term leases negotiated
recently in Africa between states and foreign companies, including sovereign funds, are
very unspecific on a range of key issues including how the investments will benefit
holders of local land use rights and local communities more broadly.97 Box 3 describes
two recent initiatives aimed at promoting good land governance and responsible
investment in agriculture.
In many countries, the increasing value of land is
leading to the concentration of landholdings into
the hands of a few owners. For example, Peru now
has greater disparities in land ownership than
before the agrarian reform of the mid-1970s.98 As the
population grows, this leaves less land available for
poor producers, and contributes to the fragmentation
of landholdings among those most dependent on
land for their survival. In such circumstances, and
compounded with land degradation in many areas,
the risks of insufficient production on existing
landholdings, if not of outright landlessness, are
magnified. Fragmentation has resulted in a rapid
decline in average smallholder farm sizes over the past 50 years: in India, for example,
average landholding size fell from 2.6 hectares in 1960 to 1.4 hectares in 2000 and it
is still declining. In Bangladesh, the Philippines and Thailand, average farm sizes have
declined and landlessness has increased over approximately 20 years. In Cambodia,
rural landlessness went from 13 per cent in 1997 to 20 per cent in 2004. Similarly, in
Eastern and Southern Africa, cultivated land per capita has halved over the last
generation and, in a number of countries, the average cultivated area today amounts to
less than 0.3 hectares per capita.99 In some countries, farm sizes are so small that people
have to either farm part-time and look for income elsewhere or, where market
opportunities permit, adopt more intensive, commercialized production systems.
“The richest farmer in this village
20 years ago owned about 40 acres
[of land]. Today those that have more
than one acre are deemed to be rich…
the farming area has shrunk considerably
because people are building houses in
this area and the village is no longer
enough to accommodate the growing
numbers of people.”
Ibrahiem Abo Zeid,
male, 55 years, Egypt
Land legislation (and its implementation) has a mixed record in protecting the
interests of poor people and thus reducing risks of land dispossession or fragmentation.
Land reforms have worked for poor rural people when they have been characterized by
strong local accountability, due attention to secondary use rights and support to poor](https://image.slidesharecdn.com/random-140910120614-phpapp02/85/The-Rural-Poverty-Report-2011-89-320.jpg)
![100 Rural Poverty Report 2011
solve possible conflicts over access to or use of natural resources, or whether to invest
in increasing productivity to tap market opportunities resulting from public policies
or initiatives.
The costs of corruption can also be substantial for rural people. They may, for
instance, include higher costs and risk associated with using public roads; applying
for licences and permits to set up enterprises or to
create rural producers’ organizations; protecting
community or individual rights to use local
resources vis-à-vis private investors or government
agencies; or protecting local interests in large-scale
land deal negotiations. A recent World Bank study
looks at the pervasive impact of ‘quiet corruption’
in countries in Africa – the malpractices of teachers,
doctors, inspectors and other government
representatives that do not involve monetary
exchange. The study finds that this contributes to
undermining the impact of investments to meet the
MDGs, and that it directly affects poor rural people
– the farmer who prefers not to buy fertilizers
because s/he is unsure of the quality, or the child
whose education suffers because the teacher fails to
show up.126 In West and Central Africa, IFAD has
found that the countries with the poorest
performance in terms of food security are those
with unstable governments, weak rule of law and
higher prevalence of corruption – all of which result
in a high risk environment for rural investments.127
In Asia, UNDP has found that in some countries
corruption undermines law enforcement in rural
areas – where police may routinely demand bribes,
or be in the pay of the landed elites who use it to
control their tenants or workforce.128 Bribery is also
used to gain illegal access to or use of natural
resources, as well as in providing health and
education services – those who are unable to bear
the costs of bribery have no access to the services. In parts of the Middle East and
North Africa, corruption has been linked to non-democratic government and to
the presence of large, often overstaffed public sectors. Also important is the
prevalence of informal patronage systems that can undermine the work of formal
governance institutions.129
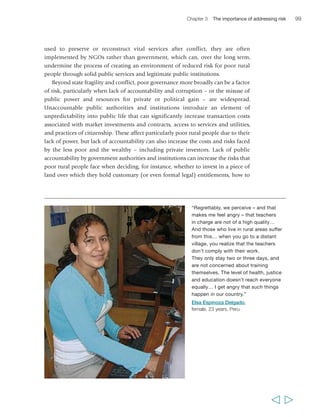
Nawal Mohamed Khalil describes how
poor the quality of health care services
is at government hospitals. “When you
go there, you find nothing. It is better
not to go. There is no care at the
hospital… [my son] got sick once and
we went to the hospital. They did
nothing for him. He came out half
dead, and so we took him to a private
doctor who saved him. We don’t rely
on government hospitals…
If somebody falls sick and… if she has
money, she will go to a private doctor.”
Nawal Mohamed Khalil,
female, 47 years, Egypt
“The villagers don’t know how much
[they should pay] for the medicines
and how much for an injection. How
can we know these prices? They do
not ask the price, they feel embarrassed
to ask. They just pay the money that
the village doctors ask for. In fact, the
price of medicines in the village is the
result of a lack of transparency. The
state should take some measures…
The prices should be posted out to let
everybody know…
Li Guimin,
female, 50 years, China](https://image.slidesharecdn.com/random-140910120614-phpapp02/85/The-Rural-Poverty-Report-2011-100-320.jpg)
![112 Rural Poverty Report 2011
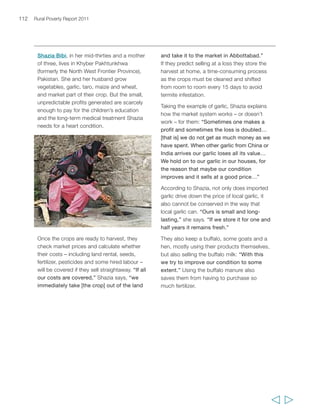
Shazia Bibi, in her mid-thirties and a mother
of three, lives in Khyber Pakhtunkhwa
(formerly the North West Frontier Province),
Pakistan. She and her husband grow
vegetables, garlic, taro, maize and wheat,
and market part of their crop. But the small,
unpredictable profits generated are scarcely
enough to pay for the children’s education
and the long-term medical treatment Shazia
needs for a heart condition.
Once the crops are ready to harvest, they
check market prices and calculate whether
their costs – including land rental, seeds,
fertilizer, pesticides and some hired labour –
will be covered if they sell straightaway. “If all
our costs are covered,” Shazia says, “we
immediately take [the crop] out of the land
and take it to the market in Abbottabad.”
If they predict selling at a loss they store the
harvest at home, a time-consuming process
as the crops must be cleaned and shifted
from room to room every 15 days to avoid
termite infestation.
Taking the example of garlic, Shazia explains
how the market system works – or doesn’t
work – for them: “Sometimes one makes a
profit and sometimes the loss is doubled…
[that is] we do not get as much money as we
have spent. When other garlic from China or
India arrives our garlic loses all its value…
We hold on to our garlic in our houses, for
the reason that maybe our condition
improves and it sells at a good price…”
According to Shazia, not only does imported
garlic drive down the price of local garlic, it
also cannot be conserved in the way that
local garlic can. “Ours is small and long-lasting,”
she says. “If we store it for one and
half years it remains fresh.”
They also keep a buffalo, some goats and a
hen, mostly using their products themselves,
but also selling the buffalo milk: “With this
we try to improve our condition to some
extent.” Using the buffalo manure also
saves them from having to purchase so
much fertilizer.](https://image.slidesharecdn.com/random-140910120614-phpapp02/85/The-Rural-Poverty-Report-2011-112-320.jpg)
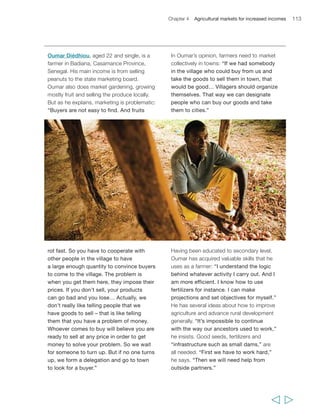
![Nyabyumba United Farmers Group received external
substantial support to get to the point where it could
become a supplier of potatoes to Nando’s fast food
restaurants in Kampala. Having done so, its members,
60 per cent of whom are women, have gone from
being reliant on off-farm labour and farming for
their household food needs, to becoming
specialized, fully commercialized producers who are
able to use the income they earn to purchase their
food needs.150 In Kenya too, a well-functioning dairy
market has made it possible for smallholder
producers on very small holdings to fully
commercialize their production systems, zero-graze
their animals using bought-in fodder and produce
milk first and foremost for the Nairobi market.151
Producing market-oriented crops can also enable
poor farming households to earn the income they
need to purchase inputs for food crop production.
Improved and less risky market access thus provides
an important incentive for increased on-farm
investment and higher productivity.
Agricultural produce markets typically work better
when they are competitive, when they are served by
good transport and communications infrastructure,
when information flows freely among participants,
when access is unrestricted, when power asymmetries
among participants are low, and when supply and
demand do not fluctuate wildly. Unfortunately, such
circumstances rarely apply. Poor smallholder farmers
typically have limited amounts of produce to sell,
116 Rural Poverty Report 2011
“We don’t carry the pineapples to
Chachapoyas by ourselves because
we need to have trucks or big vans for
that; besides, the highway is bad, and
as we don’t want the fruits to get
spoiled, we collect them all and sell
them to the Huambinos [people from
the neighbouring province of Huambo].”
José del Carmen Portocarrero Santillán,
male, 82 years, Peru
and what they have may be only occasional or of low value or quality. They face high
transport costs, are often dependent on buyers coming to them, lack information on
market prices beyond their nearest small town and typically need cash from sales
immediately. This creates high levels of risk and uncertainty for smallholder producers
and high transaction costs for buyers, in a situation that is typically characterized by
low trust between the two sides.
Many value chains for food and agricultural products involve many intermediaries
between producer and consumer, and at each step there are further risks and
transaction costs, all of which reduce market efficiency. Market power is rarely equally
distributed along the value chain, and this enables the more powerful to pass costs
“About eight or nine people hire a
vehicle collectively. If a single person
transports the loquat then the expense
on it is too high. A single person
cannot afford the 500 rupees fare to
Abbottabad market.”
Muhammad Naveed,
male, 22 years, Pakistan](https://image.slidesharecdn.com/random-140910120614-phpapp02/85/The-Rural-Poverty-Report-2011-116-320.jpg)
![128 Rural Poverty Report 2011
roads in low-income countries in sub-Saharan Africa is only one-quarter of low-income
countries in other regions); and infrastructure services remain twice as expensive as
in other regions.183
Urban-rural linkages, facilitated by improved transportation infrastructure, are a
driver of new market opportunities for rural people. Being easily linked to the urban
economy, and being connected to the wider world, can of course have many other
advantages – including better or easier access to education opportunities, health
services, and other public and financial services. Over time, these linkages can also
contribute to reducing urban-rural income and wage gaps. For instance, India’s casual
workers have seen their real wages rise gradually over the years, partly as a result of
improved transportation (and other) infrastructure: where infrastructure is better, real
wages are higher.184
Not only do transportation costs increase with the distance travelled, typically costs
per kilometre are higher on dirt roads than on tarmac roads, and higher still where the
dirt road turns into a footpath. The overall impact on marketing costs can be major.
For instance, surveys from Benin, Madagascar and Malawi find that transport costs can
account for 50 to 60 per cent of total marketing costs.185 Getting road transport working
is partly a matter of investment in and maintenance of roads, but also involves getting
the systems to work. Arbitrary road blocks, adulterated fuel, problems getting imported
spare parts, and monopolies and cartels all add to the costs of transportation and to
the risk environment facing smallholder farmers. Addressing these problems, as well
as improving the physical infrastructure, is an essential part of the enabling good
governance environment that needs to be in place to reduce the costs and risks facing
smallholders as they seek to access new market opportunities.
In the past, one of the reasons that roads were so important for market access is that
they were needed to bring information to rural areas. Today, however, information and
communication technology (ICT), particularly mobile phones, is bringing a revolution
in information even to remote rural areas. Use of mobile phones is expanding
exponentially, and handsets are now affordable for many poor rural people. Mobile
phones have greatly reduced market transaction costs for smallholder farmers, making
it possible to find out product prices from markets (thus reducing risks related to
unequal access to information), contact buyers, transfer money and arrange loans. More
and more (short message service [SMS]-based) services of relevance to poor rural people
are now provided by mobile phone. They provide information on agricultural markets,
disease outbreaks and job markets, weather forecasts and technical advice – all
important for strengthening rural people’s risk management and coping strategies.
Banking services too are supplied through mobile phones: in India and in the
Philippines, for instance, mobile technology is widely used for money transfer. In Kenya,
the M-PESA scheme offers savings, domestic money transfers and other services through
local agents on commission, and it is now used by 40 per cent of the adult](https://image.slidesharecdn.com/random-140910120614-phpapp02/85/The-Rural-Poverty-Report-2011-128-320.jpg)
![Chapter 5 Sustainable agricultural intensification 147
Abdoulaye Badji, age 50, also lives in
Casamance. His livelihood is agriculture:
“That’s what I rely on to sustain myself and
feed my family.” He provides for his own two
children and the children of two of his
brothers, who work abroad.
Abdoulaye grows rice, groundnuts, maize,
sorghum, beans and various types of fruit.
Diversification is a key strategy for managing
risk. “You cannot grow just one crop,” he
explains. “If it doesn’t work, you will be in
an impossible situation for that year.”
Most local farmers lack adequate equipment,
according to Abdoulaye: “There are not
enough ploughs [and cattle] to go around…
Throughout these difficult years people
have sold all to sustain their families.”
He believes: “the real way forward” is to
have mechanized equipment: “You cannot
meet the challenge of development if you
stick to traditional ways.”
However, he maintains his father’s
generation used to get more out of the land
than people do now. He explains, “People
don’t practise fallowing land anymore,
because due to insecurity [as a result of
conflict] you keep using the same land,
which is safe. Well, that land cannot take it
anymore. Secondly, we used cattle dung
[before] to fertilize the soil. Today we don’t
have cattle.” Farmers’ problems are also
intensified by water shortages.
Abdoulaye has adapted his farming to
respond to these changes: “I have decided
to produce only short-cycle crops to adapt
to the reduced rainy season: beans, maize,
millet.” He says the whole community is
adapting: “They know that if they carry on
with old ways, rain will stop before the
crops mature and it is a disaster.” He has
also started fallowing his land.
As a member of a local agricultural association,
Abdoulaye has been able to access better
equipment and seeds. He also appreciates
“the solidarity aspect of these types of
associations,” for example in providing
support to members in times of sickness.
Abdoulaye says he would never drop
agriculture because “you would have to buy
what other people have cultivated to eat.”
To make farming viable in the long term, he
says people need better equipment and
seeds, a system of retaining water and
marketing support.](https://image.slidesharecdn.com/random-140910120614-phpapp02/85/The-Rural-Poverty-Report-2011-146-320.jpg)
![spending over 15 per cent of their total budgets on agriculture by 1972, and the real
value of that expenditure doubled by 1985. Governments invested in infrastructure
– roads, irrigation and power. They ensured that farm credit got to farmers and
subsidized and, in some cases distributed, inputs (i.e. fertilizer and water). They also
invested substantially in agricultural research, provided farmer extension services and
intervened in markets to stabilize farm gate prices.
In China, land and market reforms also played a
vital role.
While agricultural production in sub-Saharan
Africa was growing almost as fast as the other
regions, increased yields accounted for less than
40 per cent of the increase; the remainder – more
than 60 per cent of the increase – could be
attributed to expansion of land under cultivation
and shorter fallow periods. There were a number of
technological successes, such as the rapid spread of
improved maize in Eastern and Southern Africa,
which now covers more than three-quarters of the
land under cereal cultivation in Kenya, Malawi,
Zambia and Zimbabwe;227 the adoption of high-yielding
varieties of NERICA rice, combining
the best properties of Asian and African rice, on
more than 200,000 hectares across Africa;228 and
improved disease-resistant strains of cassava, which
cover more than half of the cassava areas in Nigeria,
now the world’s largest producer.229 Yet despite
these real achievements, by 2002 improved varieties
were planted on less than 25 per cent of the land
under cereal across the region; fertilizer was applied
at less than 10 kilograms of nutrients per hectare (a
figure unchanged since 1980); and only 4 per cent
of total cropland in this region was irrigated.
Livestock production in developing countries has
also increased rapidly over the past 30 years. There
has been substantial growth in production of meat,
eggs and milk. This has resulted both from increased
numbers of animals – above all poultry (6 per cent
or more annual growth in numbers in all regions
except sub-Saharan Africa); and increased yields –
particularly for milk and poultry, and above all in
150 Rural Poverty Report 2011
Tovoke was able to join an association
that provided him with sorghum seeds.
The harvest was successful and Tovoke
plans to plant more sorghum next year
with the seeds he has saved from the
previous harvest. “I was attracted
by this ampemba (sorghum)
cooperative… I requested one
kapoake (standard measure for grain)
of seed. And so I planted that
sorghum, and harvested a little…
I didn’t have a large harvest like
those with big fields, but according
to its size the land did yield…
From that one kapoake of seed I
received three gunnies of produce
(200 kapoake make up one gunny
sack)… I saved 20 kapoake of seed…
I sold one gunny, for all my clothes
had tattered, and I had nothing to
wear, and so I purchased some.
Then a close friend died and I had
nothing to give, so I sold that second
gunny to take to [the burial ceremony].
The last gunny I ate and saved for
seed… And I decided this sorghum is
really good, considering it produced
food as well as giving me a livelihood.
And that single kapoake that was
given to me, allowed me to face my
problem… That’s why I held back
that amount to be able to plant the
next year when the rains fall, because
the sorghum was good to me. It
raised me up.”
Tovoke,
male, 44 years, Madagascar](https://image.slidesharecdn.com/random-140910120614-phpapp02/85/The-Rural-Poverty-Report-2011-149-320.jpg)
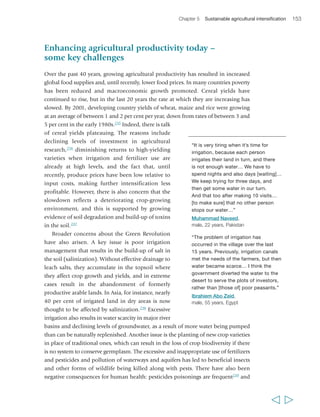
![Chapter 5 Sustainable agricultural intensification 153
Enhancing agricultural productivity today –
some key challenges
Over the past 40 years, growing agricultural productivity has resulted in increased
global food supplies and, until recently, lower food prices. In many countries poverty
has been reduced and macroeconomic growth promoted. Cereal yields have
continued to rise, but in the last 20 years the rate at which they are increasing has
slowed. By 2001, developing country yields of wheat, maize and rice were growing
at an average of between 1 and 2 per cent per year, down from rates of between 3 and
5 per cent in the early 1980s.235 Indeed, there is talk
of cereal yields plateauing. The reasons include
declining levels of investment in agricultural
research,236 diminishing returns to high-yielding
varieties when irrigation and fertilizer use are
already at high levels, and the fact that, until
recently, produce prices have been low relative to
input costs, making further intensification less
profitable. However, there is also concern that the
slowdown reflects a deteriorating crop-growing
environment, and this is supported by growing
evidence of soil degradation and build-up of toxins
in the soil.237
Broader concerns about the Green Revolution
“It is very tiring when it’s time for
irrigation, because each person
irrigates their land in turn, and there
is not enough water… We have to
spend nights and also days [waiting]…
We keep trying for three days, and
then get some water in our turn.
And that too after making 10 visits…
[to make sure] that no other person
stops our water…”
Muhammad Naveed,
male, 22 years, Pakistan
“The problem of irrigation has
occurred in the village over the last
15 years. Previously, irrigation canals
met the needs of the farmers, but then
water became scarce… I think the
government diverted the water to the
desert to serve the plots of investors,
rather than [those of] poor peasants.”
Ibrahiem Abo Zeid,
male, 55 years, Egypt
have also arisen. A key issue is poor irrigation
management that results in the build-up of salt in
the soil (salinization). Without effective drainage to
leach salts, they accumulate in the topsoil where
they affect crop growth and yields, and in extreme
cases result in the abandonment of formerly
productive arable lands. In Asia, for instance, nearly
40 per cent of irrigated land in dry areas is now
thought to be affected by salinization.238 Excessive
irrigation also results in water scarcity in major river
basins and declining levels of groundwater, as a result of more water being pumped
than can be naturally replenished. Another issue is the planting of new crop varieties
in place of traditional ones, which can result in the loss of crop biodiversity if there
is no system to conserve germplasm. The excessive and inappropriate use of fertilizers
and pesticides and pollution of waterways and aquifers has led to beneficial insects
and other forms of wildlife being killed along with pests. There have also been
negative consequences for human health: pesticides poisonings are frequent239 and](https://image.slidesharecdn.com/random-140910120614-phpapp02/85/The-Rural-Poverty-Report-2011-152-320.jpg)
![Chapter 5 Sustainable agricultural intensification 155
South China Sea these operations have become a major source of nutrient pollution.
Amid concerns over climate change, livestock is increasingly being recognized as a
contributor to the process (as well as a potential victim of it).
In all regions of the developing world, there is a need for crop and livestock
production systems to become more intensive if the world’s growing population is to
be fed, now and in the future. In the different regions, smallholder farmers will have
to confront different problems. Yet everywhere,
intensification approaches need to make more
efficient use of resources: particularly fertilizers,
pesticides and – above all – water. Indeed, without
changes in the way water is used for agricultural
production, there will be crises in many parts of
the world.243 New approaches also need to be
non-polluting and environmentally sustainable,
preserving or enhancing soil fertility and protecting
biodiversity. The alternative is the loss of the very
assets on which smallholder farmers depend for their
livelihoods. Increased climatic variability and climate
change are expected to result in an escalation in
extreme weather-related events – floods, drought,
high temperatures, as well as shorter and more
uncertain growing seasons and new pest and disease
patterns. Intensification, of both crop and livestock
production systems, also needs to render farming
systems more resilient to shocks and stresses.
If agriculture is to be a way out of poverty for at
“The soil is no longer fertile. And there
is not enough rain. We try to use
organic fertilizers like dead leaves,
cattle dung, and so on. Still it doesn’t
improve very much… You see, working
the land is difficult. But since it is the
only thing I have, it is my livelihood.”
Bakary Diédhiou,
male, 60 years, Senegal
“The problem today is that no matter
how hard you work, it’s never enough
to feed the family… The land was
more fertile [in my father’s time]. They
used to get more out of the land. They
didn’t need to cultivate big areas.
Crops were healthy. Their cattle used
to walk around and fertilize the soil. In
fact today we cultivate more land, for
fewer crops. We don’t have the means
to buy fertilizers to increase yields.”
Abdoulaye Badji,
male, 50 years, Senegal
least some rural people, then new approaches to
increased productivity should be accessible to poor
smallholder farmers and livestock producers, and
provide attractive opportunities for youth. They also
need to be more accessible than traditional approaches to rural women, who play
critical roles in smallholder agriculture. Particularly in low income countries, women
make up a substantial majority of the agricultural workforce and produce most of
the food that is consumed locally; but even in some countries in the Middle East and
North Africa, the percentage of economically active women operating in agriculture
is larger than the percentage of men – in Algeria, for example, it is 40 per cent for
women compared with 16 per cent for men.244 As discussed in chapter 2, the
productivity of women farmers is constrained by the same factors that affect small
agricultural producers in general, but this is compounded by a range of gender-specific
factors such as unequal control over key productive assets, unequal access to](https://image.slidesharecdn.com/random-140910120614-phpapp02/85/The-Rural-Poverty-Report-2011-154-320.jpg)
![158 Rural Poverty Report 2011
enhancement through the harnessing of agroecological processes; a selective and
frugal use of external inputs; the use of crop varieties and livestock breeds that are
resistant to stress (e.g. drought, salinity, disease) and have a high ratio of productivity
to use of externally-derived inputs; minimal use of technologies or practices that have
adverse impacts on the environment and human
health; and productive use of human capital in the
form of knowledge and capacity to adapt and
innovate, and social capital to resolve common
landscape-scale problems.
There is great diversity of practices associated with
sustainable agricultural intensification. Conservation
agriculture practices involve reduced or no tillage and
the use of cover crops to improve soil fertility and
water retention, reduce soil erosion and improve
recharge of aquifers. Integrated pest management
(IPM) uses the pest’s natural predators as an
alternative to pesticide use. Integrated plant nutrient
management promotes the combined use of mineral,
organic and biological resources to ensure ecosystem
sustainability. Well-integrated crop and livestock/fish
systems increase the diversity and environmental
sustainability of smallholder production systems,
while reducing waste and pollution. Improved water
management, including drainage, micro-irrigation
and in-field rainwater management, increases
agricultural productivity, reduces waste and prevents
salinization. Crop rotation prevents the build-up of
pathogens and pests, balances the fertility demands
of various crops, replenishes nitrogen through the
growing of legume crops, and improves soil structure
and fertility by alternating deep-rooted and shallow-rooted
plants. Agroforestry combines agricultural
and forestry technologies to create more diverse,
productive, healthy and sustainable land-use systems.
A whole range of techniques, such as gulley
reclamation, terracing, bunding and planting pits can
be used to conserve water and prevent soil erosion. These practices can be used
concurrently, and substantial synergies may be realized by doing so.
None of these practices represent stark alternatives to conventional approaches to
intensification based primarily on use of irrigation water, improved seeds and
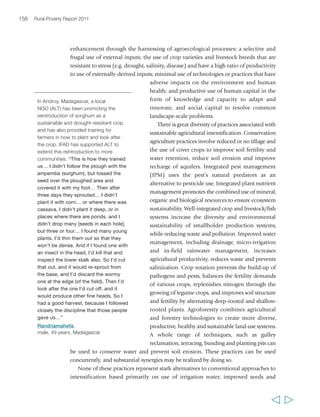
In Androy, Madagascar, a local
NGO (ALT) has been promoting the
reintroduction of sorghum as a
sustainable and drought-resistant crop
and has also provided training for
farmers in how to plant and look after
the crop. IFAD has supported ALT to
extend this reintroduction to more
communities. “This is how they trained
us… I didn’t follow the plough with the
ampemba (sorghum), but tossed the
seed over the ploughed area and
covered it with my foot… Then after
three days they sprouted… I didn’t
plant it with corn… or where there was
cassava. I didn’t plant it deep, or in
places where there are ponds, and I
didn’t drop many [seeds in each hole],
but three or four… I found many young
plants. I’d thin them out so that they
won’t be dense. And if I found one with
an insect in the head, I’d kill that and
inspect the lower stalk also. So I’d cut
that out, and it would re-sprout from
the base, and I’d discard the wormy
one at the edge (of the field). Then I’d
look after the one I’d cut off, and it
would produce other fine heads. So I
had a good harvest, because I followed
closely the discipline that those people
gave us…”
Randriamahefa,
male, 49 years, Madagascar](https://image.slidesharecdn.com/random-140910120614-phpapp02/85/The-Rural-Poverty-Report-2011-157-320.jpg)
![several years rather than immediately, secure tenure
that provides the incentive for farmers to invest
their labour and capital is vital for their success.
Success of future endeavours to promote agricultural
technologies for climate change mitigation and/or
adaptation will also be predicated on security of
tenure for rural men and women.267 Security of access
to land and other resources is also paramount for
livestock producers to be able to participate in more
sustainable intensification practices, including those
that require better integration between livestock and
crop production systems.
Acquiring more land is often part of the process
of escaping poverty.268 In most cases, this is most
easily done by renting in land. On the other hand,
small landowners who want to diversify out of
farming need to be able to rent out their land
without losing it – since it often represents
important capital and a safety net. Land tenure
systems that allow renting in and out easily, can
contribute to creating an enabling environment for
more farmers to take up sustainable intensification
approaches, and there is also some evidence that
they can facilitate poverty reduction. For example,
land rental markets in China have improved tenant
household welfare by a quarter, enabled landlords
to diversify occupationally, and increased plot
productivity by around 60 per cent. Poorer groups
have also benefited, because as better educated
people join the non-farm labour force, poorer, less
educated farmers are able to rent in land from them.
This suggests that land rental systems should be
facilitated also in other regions.269
Chapter 5 Sustainable agricultural intensification 165
Randriamahefa tells how he migrated to
rent land and how he had different deals
with two owners. It was through the
second, more beneficial contract that he
finally made a breakthrough and
returned home as someone who had
succeeded. “I’d heard that the land up
there was productive, so I headed for
the fields and left the rickshaw pulling
behind… I rented land [for] 50,000 ariary
per hectare [but] we still split the
harvest with the owner… So there I
was, sitting on that land, paying the
rent, and dividing the harvest with the
owner… My friend supplied the oxen
to turn the soil. Then… having stayed
there, after two years things turned
[out well], and I had seed after that
harvest… with that I purchased two
head of cattle and a single ox. Then
my friend said to me, ‘Even though
you’ve made a little on this land, leave
this land that is making you suffer.
There is some land of a friend of mine
[and] there it’s only an even split [of
the harvest], and without rent for the
land as well.’ So I went and planted
that field that year, and it was a massive
harvest! I’d planted two gunnies [of
seed], and harvested 40 gunnies. And
there is a buyer, a factory that receives
the produce there… My suffering was
relieved, I was happy… I bought a
barrel again, a plough again, and
brought them home, and my relatives
said I was very successful for having
brought home those possessions!”
Randriamahefa,
male, 49 years, Madagascar
Pricing and regulation
With agricultural technologies as with all else, prices
influence demand. Subsidies on agrochemicals and inorganic fertilizers, or on
agricultural water, all encourage their use, and indeed those subsidies played an
important role during the Green Revolution. In some regions, phasing out those
subsidies makes much sense (see box 18). In Asia, it has been suggested that doing](https://image.slidesharecdn.com/random-140910120614-phpapp02/85/The-Rural-Poverty-Report-2011-164-320.jpg)
![170 Rural Poverty Report 2011
While there are significant challenges, the development of the forest carbon market
shows that they can gradually be overcome. In addition, important lessons are being
learned about how to make PES work: an IFAD review of pro-poor payments for
watershed services highlights the importance of ensuring an appropriate and effective
institutional framework at the community, catchment and national level, and it
stresses that farmers (and poor rural communities in general) will likely require
significant and sustained logistic, technical, legal and financial assistance to
participate in PES. It also points to the need to get the incentives right for farmers in
terms of providing short-term economic benefits and reliable long-term income.275
These may not always need to be financial: under the World Agroforestry Centre
RUPES programme, non-financial incentives have motivated smallholder farmers to
adopt agroforestry practices. This learning process will continue. In addition, the
likelihood is that funding for PES and carbon sequestration will continue to grow.
In light of this, there is an important role for governments, civil society and donors
to play in pushing for the development of carbon markets that are accessible to small
farmers and that have a poverty focus.
“There should be agriculture-related
subjects [in the school curriculum]
so that we get more information on
agriculture, its cultivation methods.
Which crop is grown in which
season? How to use pesticides?”
Salma Bibi,
female, 20 years, Pakistan](https://image.slidesharecdn.com/random-140910120614-phpapp02/85/The-Rural-Poverty-Report-2011-169-320.jpg)
![Agricultural education
A new and broader approach to, and a new emphasis on, agricultural education and
training are required for two reasons. The first is to provide the next generation with
the skills, understanding and innovative capacity that they require to practice
sustainable agricultural intensification – as well as to strengthen individual
capabilities and human capital that are important for better addressing risk, achieving
food security, and taking part in rural development and growth. Agriculture must be
accorded prestige, and sustainable agricultural intensification must be recognized
and presented as modern and profitable, so that the
aspirations of rural youth – girls as well as boys –
can converge around it. The second reason is to train
a new generation of agricultural specialists, scientists
and service providers, who can work with
smallholder farmers in new ways to enable them to
develop the skills needed to make sustainable
agricultural intensification work.
In many developing countries, agricultural
education and training (AET) has been neglected
both by ministries of agriculture and of education,
and abandoned by the donor community. School
curricula are often designed for urban schools, and
then applied without adaptation in schools in rural
areas,276 which means that they are unlikely to
respond to the specific needs of rural youth in terms
of either life or economic skills. In such a framework,
there may no longer be room for the agricultural
education that used to be a part of the school
syllabus in many countries – a trend that requires
urgent attention and reversal.
NGO-run rural education programmes can be
found in many countries – particularly in remote
rural areas and poor communities where the
presence of government services may be weak.
Many such programmes have a broader orientation
than traditional agricultural education, and they
start from the assumption that literacy and
numeracy are prerequisites for developing other
skills, and that literacy is also a precondition
for empowerment. A review of such programmes
in Asia confirms that those “…which integrate
Chapter 5 Sustainable agricultural intensification 171
From desert to
green fields in
Egypt
“You understand things better [ with
education]… Working the land is a job.
If you study you can improve your
methods. You can change and be more
efficient. For instance, in cattle breeding
you can understand why you need a
veterinarian. Take artificial insemination
of cattle: it can help improve the breeds
so that you can have a lot of milk.
[Going to school was helpful because]
I understand the logic behind whatever
activity I carry out. And I am more
efficient. I know how to use fertilizers for
instance. I can make projections and set
objectives for myself.”
Oumar Diédhiou,
male, 22 years, Senegal
“Undoubtedly they can also farm but if
they study well then farming will also
be done in a better manner. If they do
farming and if they have not studied,
well then how can they do farming
properly? A person can also get ahead
with farming. It is not necessary that he
goes away. Does well, does other
things and not necessarily has a
permanent job. We say that one may
simply do farming but the education
should be a good one.”
Shazia Bibi,
female, 37 years, Pakistan](https://image.slidesharecdn.com/random-140910120614-phpapp02/85/The-Rural-Poverty-Report-2011-170-320.jpg)
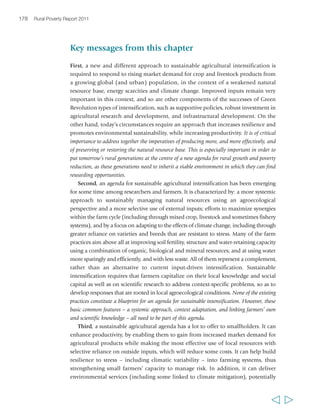
![182 Rural Poverty Report 2011
Doris Consuelo Sánchez Santillán,
36 years old, lives in Cheto, Chachapoyas
Province, Peru, where she runs a successful
small business making and selling yoghurt
and other milk products. She employs mainly
students and unmarried mothers in her
factory, seeing this as a “social commitment”
to those with limited opportunities, and now
also owns three stores in the region. Like
most of her employees, she belongs to the
indigenous Quechua community and comes
from a poor farming family.
Doris set up her business with a female
cousin after doing a community-based
training on managing local resources in 2004.
The first task was to win over and train local
farmers, who were not used to selling milk.
“Sometimes their milk wasn’t accepted,”
she says, “and they had to prepare it once
again because it didn’t comply with the
quality standards. But… now we have
plenty of top-quality milk.”
They also had to persuade people to supply
them with local fruit, such as papayas,
cherries and pineapples, for use in their
products: “Those fruits were disregarded.
When we asked the peasants to give them
to us, they laughed at us… I mean the fruits
that are grown [here] are fresh and tasteful,
not polluted with pesticides. They are
grown in family farms, or grow wild in the
hills.” Now, she says, “even the kids bring
us fruit. They trade them for yogurt, or they
sell them for money.”
Doris’s aspirations are to “open more stores,
diversify our products, and try new fruits,
such as púrpur or [the local] tomatillo and…
have a bigger factory”. Looking to the
future, she says: “I would like my business
to have grown, give employment to more
people, and that my children would be
improved, I want them to follow a career
that they like.”](https://image.slidesharecdn.com/random-140910120614-phpapp02/85/The-Rural-Poverty-Report-2011-181-320.jpg)
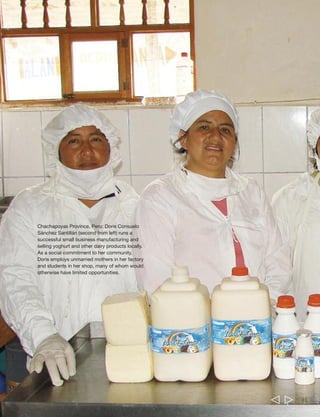
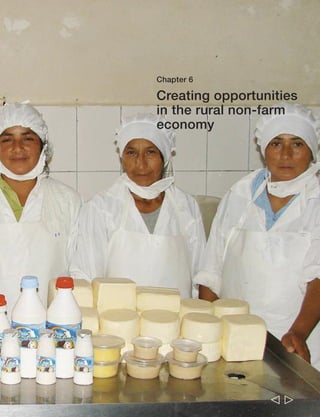
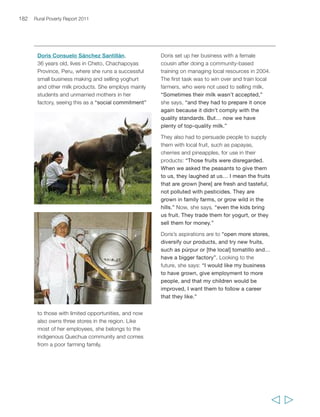
![186 Rural Poverty Report 2011
remittances. While those remittances are hugely important to many households, in
most developing countries they make up only 5 to 10 per cent of total rural incomes.
Composition and characteristics
The rural non-farm economy includes both non-farm wage employment and non-farm
self-employment (though it excludes agricultural wage employment), and it
lumps together a highly diverse collection of activities, including trading, agro-processing,
manufacturing, construction, and commercial and service activities. Of
these, manufacturing typically accounts for only 20 to 25 per cent of employment, while
retail trade and services make up 60 to 75 per cent.295 Often highly seasonal, many
non-farm businesses operate according to the rhythms set by the agricultural season.
The scale of individual rural non-farm enterprises varies enormously, from part-time
self-employment in household-based cottage industries and services to large-scale
agro-processing and warehousing facilities run by the corporate sector. But most are
small: across all regions, something like three-quarters of them may be one or two people
only, and self-employment is the general rule. Self-employment is particularly widespread
“I took money from the bank and
arranged to buy a flour mill
[run on fuel] for my son. And this
mill that is ours… some people
bring their grain for grinding to
us… This is my business… We
[run the household with] the
same flour mill.”
Miandad,
male, 48 years, Pakistan
The diversity of the rural non-farm economy – some examples](https://image.slidesharecdn.com/random-140910120614-phpapp02/85/The-Rural-Poverty-Report-2011-185-320.jpg)
![populated areas, where demand is higher;297 their
composition is often a function of this. Deep in the
rural areas, the non-farm economy may be limited
to small retailers, farm equipment repair services, and
input supply firms; while in small towns, there may
be other services such as primary schools, health
clinics, barber shops, milling facilities, phone and
Internet services and bars; and in larger towns, there
may be all of these plus restaurants, wholesale
distributors, higher-level schools and health facilities.
Different opportunities in the non-farm economy
are open to different groups. Typically, education is
key to accessing good employment opportunities in
the non-farm economy. Poor people dominate many
of the low-return activities such as cottage industries,
small-scale trading and unskilled wage labour used
in construction, portering and many personal
services. The poor are more likely to be in casual
rather than regular wage labour; while their
businesses are likely to be labour-intensive and
small-scale. For rural women, the non-farm economy
188 Rural Poverty Report 2011
is generally more important as a source of employment than agricultural labour
markets in most regions, with the exception of South Asia;298 however, as noted earlier
in the report, gender inequalities may be reflected through differential access to
employment and business opportunities, or lower wages for the same work.
What drives the rural non-farm economy?
Agricultural development has long been recognized as playing an important role in
fostering development in the rest of the economy299 through a series of linkages
between it and other sectors. Agriculture also generally plays a predominant role in
influencing the size and structure of the rural non-farm economy, by supplying raw
materials for agro-processing, providing a market for agricultural inputs and
consumer goods and services, releasing labour into other sectors of the economy and
supplying – and reducing the price of – food to the non-farm economy.
In regions where agriculture has grown robustly, the rural non-farm economy has
also typically enjoyed rapid growth. The literature suggests that each dollar of
additional value added in agriculture generates another 30 to 80 cents in second-round
income gains elsewhere in the economy,300 depending on factors such as
“If the daughter was [considered] equal,
and was studying, her life would also
be better in the future… there would be
benefits… She can get a job in a school
or give tuition at home. So, for
daughters the benefits [of education]
are even more than for sons.”
Rawela Jan,
female, 40 years, Pakistan
“Girls are always in a hurry to make
some money by going to Dakar to work
as maids. It’s never too late to become
a maid. The girl should first try hard at
school, and if it doesn’t work, then she
can go work as a maid. Girls should
also have higher ambitions than being
maids. Why can’t they aim to work in
offices like men?”
Abibatou Goudiaby,
female, 21 years, Senegal](https://image.slidesharecdn.com/random-140910120614-phpapp02/85/The-Rural-Poverty-Report-2011-187-320.jpg)
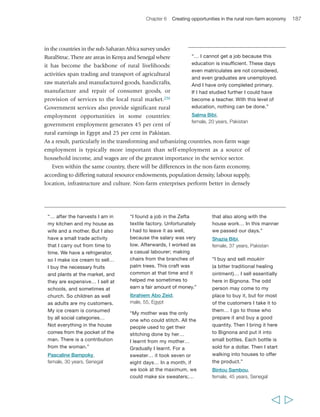
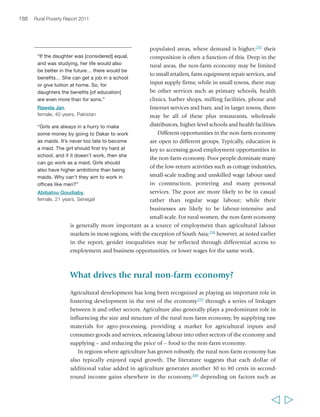
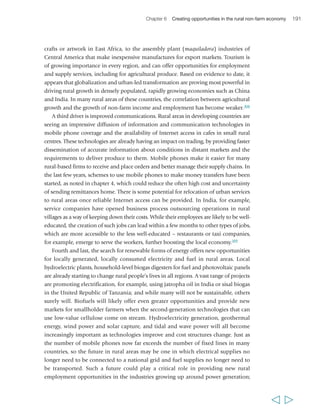
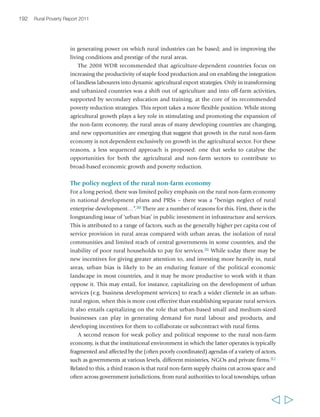
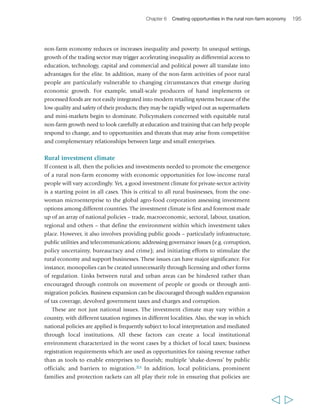
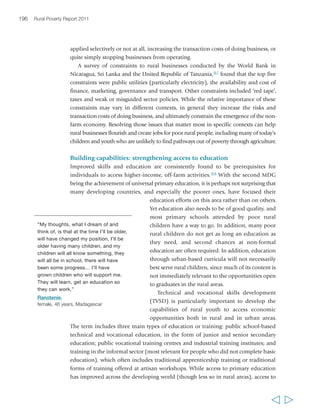
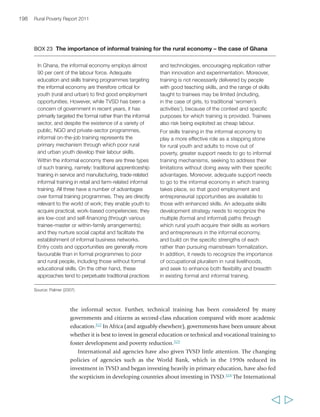
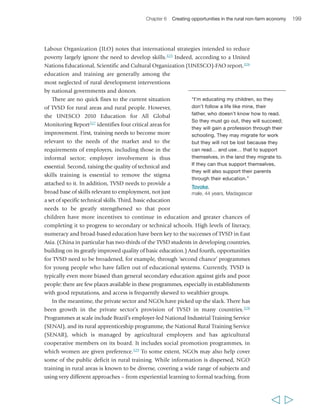
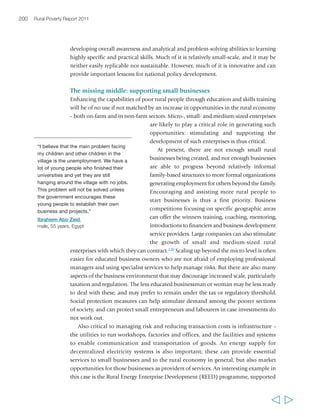
![Chapter 6 Creating opportunities in the rural non-farm economy 205
hand, this sort of job often does not lead to the hoped-for economic empowerment
of poor rural people, but rather involves them in low-security, unstable, poorly paid
and sometimes hazardous activities.338 Enforcing labour standards can be part of
the solution to this problem. However, a proper balance needs to be sought in
context between enforcing standards – which reduce risks for workers but may
increase costs for employers – and providing incentives to employers that offset
increased costs (e.g. by increasing workers’ skills and performance). This in turn
often requires innovative forms of collaboration among governments, the private
sector, NGOs and organizations of poor rural people. Labour standard enforcement
also needs to be tailored to avoid exclusionary effects. For instance, a study of the
impact of the Ethical Trading Initiative’s codes of labour practice on workers in a
number of value chains in Costa Rica, India, South Africa, the United Kingdom and
Viet Nam showed that regular and permanent workers (few of whom were women)
were most likely to benefit, while casual and migrant women workers were less aware
of their rights, less in a position to claim them and vulnerable to abuse and
poverty.339 An exclusive focus on labour standard enforcement as a tool to reduce
risks and improve employment opportunities
for poor rural people can also have negative
externalities. For instance, if standard enforcement
concentrates in urban areas and/or on large firms,
these may respond by subcontracting to smaller
firms, notably rural, which may face less pressure
to comply, and these may in turn rely largely on
informal and casual labour – simply exporting the
problem to less easily monitored firms and more
poorly connected areas.
There are cases in which informally employed
workers have achieved protection or successfully
negotiated contracts that improve the quality of
their employment. The case of the Indian Self
Employed Women’s Association is a much quoted
case of relative success, which indicates the
importance of organizing among informal workers
to negotiate better working conditions with
employers. NGOs and other intermediaries –
including donors – can play supportive roles in
helping strengthen collective capabilities and in
reducing costs and providing incentives for better
interaction between workers and employers. Both
are critical, if access to employment opportunities is
Manantane Babay describes how one
villager managed to make the transition
from pulling rickshaws to buying them,
then selling them or renting them out,
gradually accumulating more funds – all
of which he spent on buying livestock.
“What he did first was go to Majunga
and pull a rickshaw – indeed he did
have a few cattle with his father but
not many. So he pulled a rickshaw
and he had no problems, and his
income was steady. So he purchased
rickshaws until [he had] many, then he
sold off all of them and came home to
purchase cattle. He then returned
again and purchased a rickshaw for
renting out, then he returned again
and purchased cattle. His cattle
increased in number, as did his sheep
and goats.”
Manantane Babay,
male, 19 years, Madagascar](https://image.slidesharecdn.com/random-140910120614-phpapp02/85/The-Rural-Poverty-Report-2011-204-320.jpg)
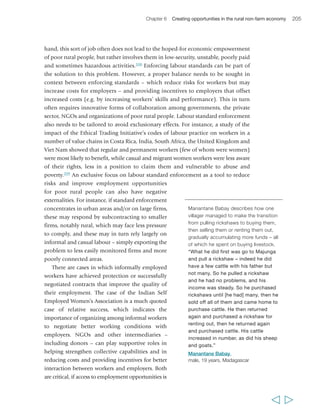
![Chapter 6 Creating opportunities in the rural non-farm economy 209
The impact of remittances on agriculture is mixed and highly contextual. In some
cases, migration, which in most regions mostly involves men, and remittances foster
on-farm investment and agricultural production. In others, the opposite occurs:
migration leads to an immediate decline in (mostly male) labour availability, for
which it may not be possible to compensate in the short term. Remittances are in
some cases used to hire on-farm labour. However, the general trend seems to be that
they accelerate a move out of agriculture – or foster forms of agriculture that take on
a subordinate role to off-farm activities.
The social costs can be high, as families are divided when typically only some
individuals migrate. In addition, when men migrate (as is most often the case) and
remittances are low, poverty may increase back at home, which may result in food
shortages and increased child labour. More generally, and as mentioned above,
migration can result in labour shortages, for instance on family farms, which may
have negative consequences in terms of income and food security. Child labour
“… Of course, travelling
abroad would have provided
me with the financial
resources to build a better
house… in addition to buying
some luxuries of electrical
appliances and furniture…
[but] I did not want to leave
my family and kids alone.
I preferred to stay close to my
family rather than to travel
after money. I know a lot of
men who travelled abroad for
work and made a lot of
money, but when they came
back to the village they found
that their children had
becomes drug addicts or left
school. I did not want that to
happen to me and my kids.”
Ibrahiem Abo Zeid,
male, 55 years, Egypt
“Our village is our own…
because it is the land of our
ancestors. We cannot leave it.
Wherever a person works,
he returns to the village.
Our happiness and our
sorrows are in this village.
Our relatives live here, which
is why we cannot leave this
place. We have our own land,
that’s why we will live here
and not go anywhere else.”
Muhammad Naveed,
male, 22 years, Pakistan
“One doesn’t have any relatives
out there. If l died while away,
there would be no one to bring
my body back here, to my
fatherland. There are no
relatives there, if one gets in
trouble, there is no one to save
you in that land of no family.
But here, if one dies, my
neighbours will not let my
body rot there but will bury it.
And there is no one who sees
you not having eaten for 2 or
3 days that won’t say, ‘Here’s
some hot water, drink that
and you will see the morning’…
But in the land of strangers
there is no one to do that to
you. It’s only by your own
energy that you survive.”
Tovoke,
male, 44 years, Madagascar
“The men have left to work
outside the village. The main
labour force here is women.
Men have gone to earn
money… They go to find some
work. They can only earn some
money doing odd jobs. Those
in good health can find work,
but for those in poor health,
they… just drift along, muddle
along. They can’t think too
much about their future.”
Li Guimin,
female, 50 years, China
The costs of migration](https://image.slidesharecdn.com/random-140910120614-phpapp02/85/The-Rural-Poverty-Report-2011-208-320.jpg)
![216 Rural Poverty Report 2011
Eliany Portocarrero Novoa, age 15, comes
from a peasant farming family in the
Amazonas region of eastern Peru and is a
weekly boarder at a state secondary school
for gifted students.
Eliany wants to see “economic and
educational levels” raised in her community.
She is concerned about the low standard of
most primary schools, where children are just
taught basic numeracy and literacy, and the
lack of secondary schools. “Without
education,” she comments, “a person can
do nothing… by studying you will get a
good job and make money to support your
family.” Her class at school has recently set
up a mobile library for the local community.
Eliany says her parents are “doing the same
activities that their parents and ancestors
did for years” and believes they would
“improve their life quality” if they ever gave
up farming. Although she says she would like
a professional career such as accountancy,
where you sit “in front of a computer… and
don’t suffer burning sun or pouring rain,”
she is keen that the newly established panela
(unrefined cane sugar) processing industry in
her community should grow, with the support
of the Association of Panela Producers.
Eliany belongs to a youth association,
which among other things is involved in
environmental regeneration. She speaks
passionately about the need for
environmental protection and sustainable
farming. “We are not using the forests in
an adequate and proper way. We cut trees
and burn down woods every day, we are
plundering nature… climatic changes are
occurring for which we are to blame, with
our activities… the seasons don’t follow
one another properly, so the crops get
spoiled… First, we should receive some
guidance through talks, so that people
become aware of the damage… then we
should set goals and put them into effect.
For instance, we could sow plants and
reforest… [and use] natural fertilizers [to]
improve the land…”](https://image.slidesharecdn.com/random-140910120614-phpapp02/85/The-Rural-Poverty-Report-2011-215-320.jpg)
![Chapter 7 What needs to be done, and how? 217
Ranaivo Jean Noelson, age 23 and a father
of three, lives in Faux Cap, Madagascar.
He is a fisher and also owns some land that
he farms. He would like to increase his
livestock, acquire more land and have better
farming equipment: “And following my
dreams, I believe I’ll have cattle, about 20…
My thoughts are to build a stone house,
to have a sarete [ox-cart], like other
people. I’ll buy fields – about five – and
purchase a team of oxen to work [them].”
Ranaivo is a member of the recently formed
‘Dune Association’, which is tackling the
serious problem of sand dunes invading
farmland by planting tree seedlings. He is
keen to promote communal farming: “What
I’d like to do to improve this village where
I live is communal work… We’d acquire
land for a large field that could be worked
cooperatively. Then any harvest from that
field would go into a cash account, and
we’d use that as seed money to get more
work for the future.”
He has several other ideas about how to
meet the community’s needs, some of them
requiring external support. “If I were the
director, given that raketa-mena [red prickly
pear] are becoming thick here, I’d suggest
we clear that plant out first. I’d also ask
for a clinic, for we are far from any
health facility… then I’d try to set up an
association of fishermen, for there’d be
money in that, and I’d like a canoe.
We’d ask for a net, we’d ask for masks,
we’d ask for fishing lines: that’s what I’d
request for our association. Such an
association might improve us. If I were the
leader of development for the commune of
Faux Cap, I’d create that association first.
Then we’d do work on the land… on those
sand dunes… ”](https://image.slidesharecdn.com/random-140910120614-phpapp02/85/The-Rural-Poverty-Report-2011-216-320.jpg)
![218 Rural Poverty Report 2011
Creating opportunities for tomorrow’s generation
We started out this report stressing the paradox of a world in which demand for
goods and services related to agriculture is growing, natural resources are
increasingly scarce and valuable, and yet rural areas across the developing world
remain hosts to the majority of the world’s poor. We referred to the 2006-2008
food crisis, which hit both urban and, in many countries, poor rural people, and
which provided a stark reminder of the overall marginalization of smallholders in
agricultural and food markets – not only global ones but also urban markets in
their countries. In the aftermath of the crisis, a variety of initiatives have been taken
to step up agricultural production, stabilize food markets, and/or reduce poor
people’s vulnerabilities to food price shocks across developing countries. And yet,
the challenge of addressing rural poverty while also feeding a growing world
population in a context of increasing environmental scarcities and climate change
continues to await adequate responses.
Alternative
employment in
Ghana
“My hopes are to see an
integrated region, with much
employment. Especially the
authorities that rule our
region – they should work
with a lot of effort, but in an
agreed manner with the civil
society, not separately. And
yes, I see a good future
because… I have hope that
the youth who are
developing and coming out
from the universities have a
different vision of our future,
a new way to see our
region… Well, I have hope
that this society will change,
though I know it’s very
difficult – but not
impossible. We have to work
very hard on that…”
Elsa Espinoza Delgado,
female, 23 years, Peru
“I can see me in 10 years
time: the rains have come,
and we have possessions,
and all kinds of seed are in
the market, and I’ll be
saying, ‘Look at that seed
we’ve never tried, let’s get
some of that,’ and we do,
and we save it for the
rains… to plant it when the
rains come.”
Suzanne Tsovalae,
23 years, female, Madagascar
“If I had money I would buy
a buffalo. I will sell the milk
to run the household…
If someone has a buffalo,
he can run the household
satisfactorily… The wages
which I will get from daily
labour, I will spend on my
children’s education. I will
enrol my children in a good
school, [using] the savings
from daily wage labour or
from selling a goat kid…”
Javed Iqbal,
male, 25 years, Pakistan
“We all hope and pray that
our children have a better
life than us. And I believe
they will indeed have a
better life. The world is
moving and they will have
better ways to make a living.
Who would have thought
Hopes and plans for the future of today’s rural youth](https://image.slidesharecdn.com/random-140910120614-phpapp02/85/The-Rural-Poverty-Report-2011-217-320.jpg)
![Chapter 7 What needs to be done, and how? 219
We have argued that this is an appropriate moment to address this challenge.
Environmental conditions are changing, and this brings increased risks for rural
economies and people; however, there is also a new appreciation of the services and
goods that natural resource-based livelihoods can provide. The market context is
changing and urbanization is proceeding apace, bringing a host of new opportunities
for poor rural women and men to engage with markets, as well as new risks around
them. Today, a very large proportion of poor rural people are children and youth, and
it is they who will have to live and deal with the impact of today’s transformations.
It is also tomorrow’s rural generations who most need to see rural areas as places
where they can fulfil their aspirations. Already today, more and more youth are
unwilling farmers or livestock producers and reluctant residents in rural areas.
Environmental degradation and climate change, combined with persisting policy
neglect of agriculture and of rural areas, can only accentuate this process. For this to
change, robust action is needed now. This action must address the many factors that
perpetuate the historic marginalization of rural economies, mitigate and develop
ways to better deal with new risk factors, and enable poor rural people to harness
that there would be a radio
station in this area? There
are even people who have
television sets in the village.”
Oumar Diédhiou,
male, 22 years, Senegal
“If I am given charge…
I would also try for a middle
school. Women cannot
study beyond primary as we
only have up to primary
school in our village. Women
are not allowed to go out of
the village… I will try for a
middle or high school for
girls so that girls do not go
outside the village.”
Muhammad Naveed,
male, 22 years, Pakistan
“I would love to move away,
because, as you see, people
suffer a lot here… In my
opinion, [my siblings in
the city] have better
conditions… they are living
in a good place, they have
their jobs, and you don’t
need to kill yourself working
to make progress, as is
the case here. Here we
suffer a lot if we want to get
something to improve our
living condition.”
Williams Serafin Novoa Lizardo,
male, 20 years, Peru
“I really hope to have
improved [in the future], with
some livestock, and my
family all healthy. I hope that
my position then will be
different from my position
now – that I’d have
possessions… I mean that
I’d have a few head of
cattle, sheep, goats and
chickens, many chickens.
Then my life would have
changed. And then I’d feel
better about myself…
I always believe that it will
be different; I do believe
that it will be better.”
Manantane Babay,
male, 19 years, Madagascar](https://image.slidesharecdn.com/random-140910120614-phpapp02/85/The-Rural-Poverty-Report-2011-218-320.jpg)
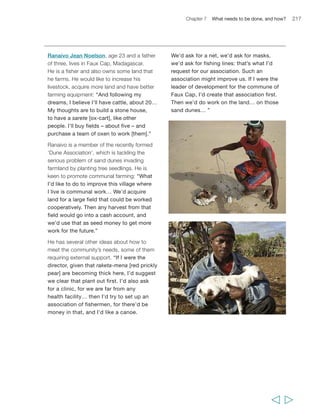
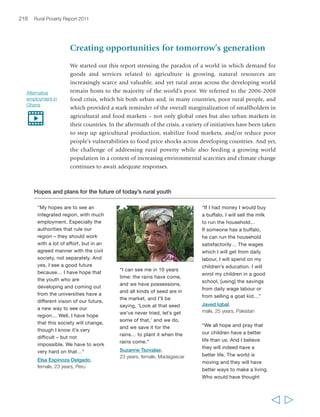
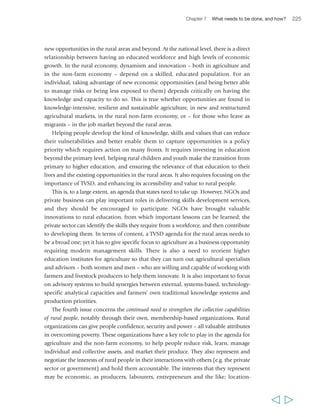
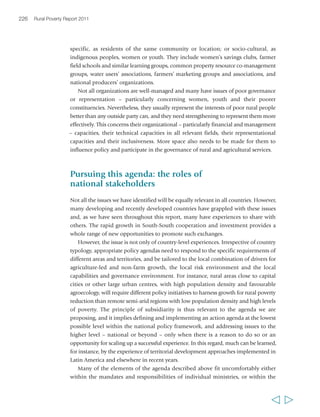

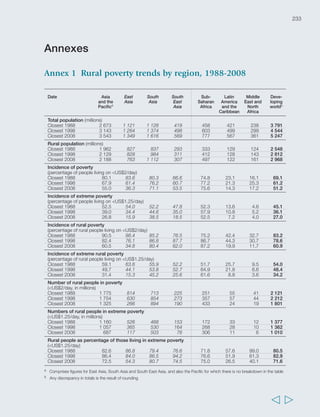
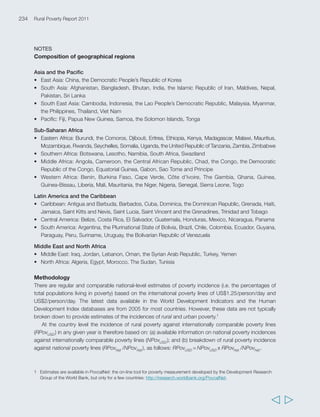
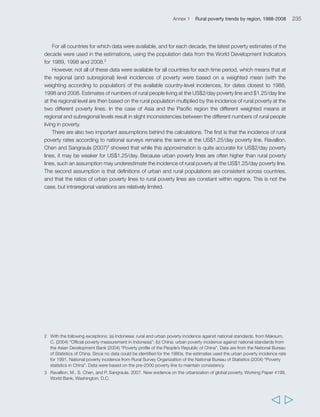
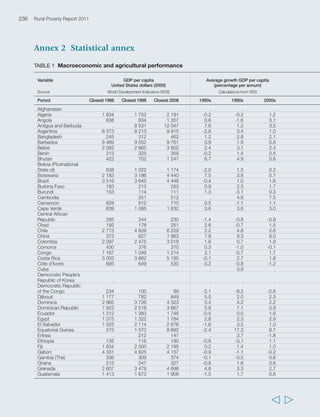
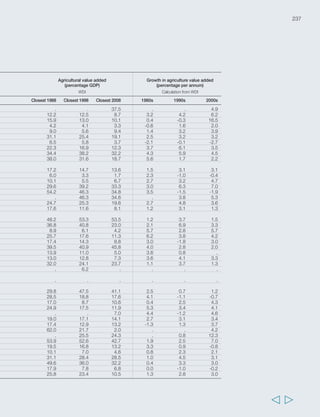
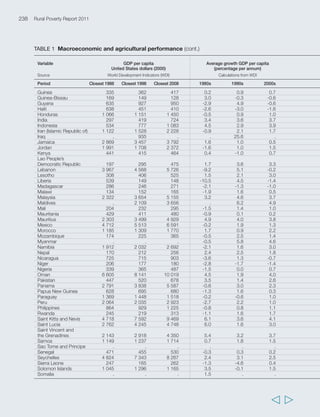
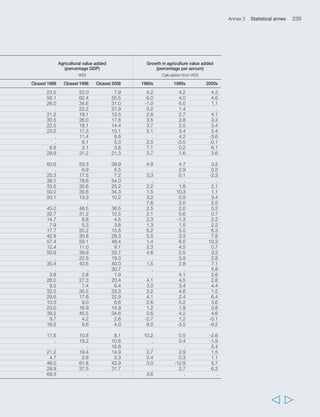

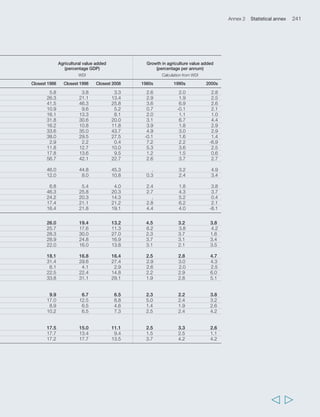
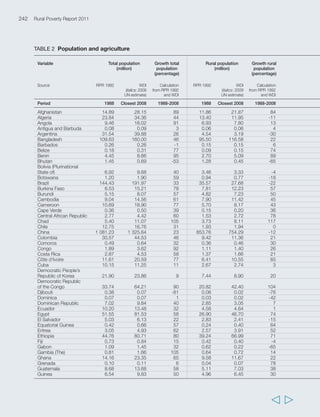
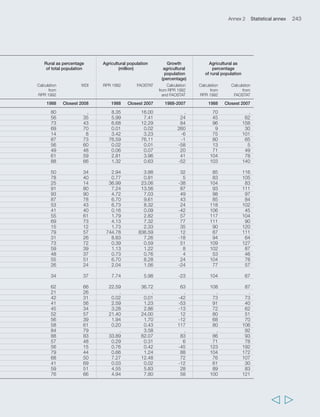
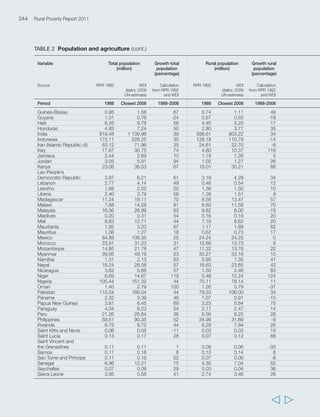
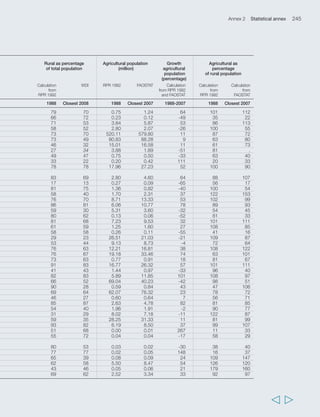
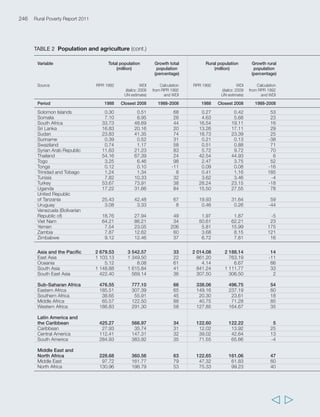
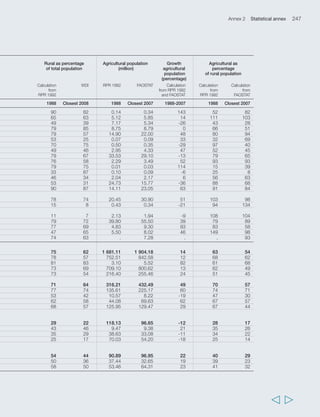
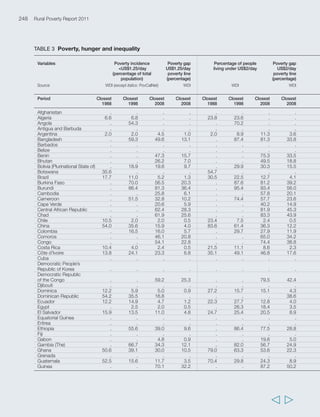
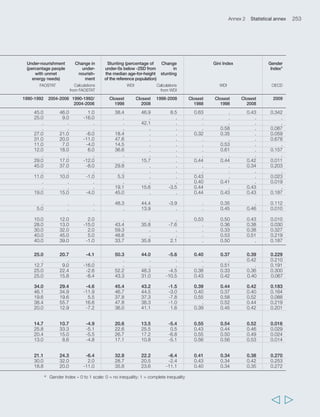
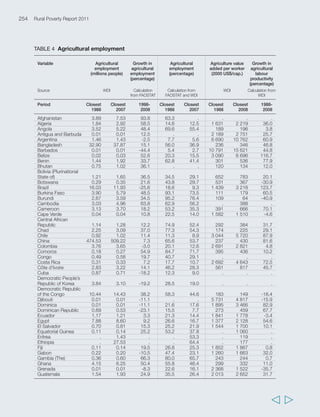
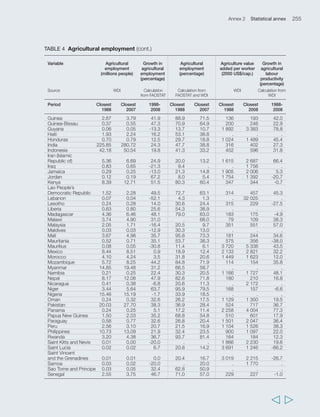
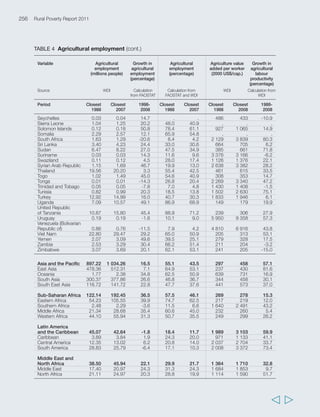
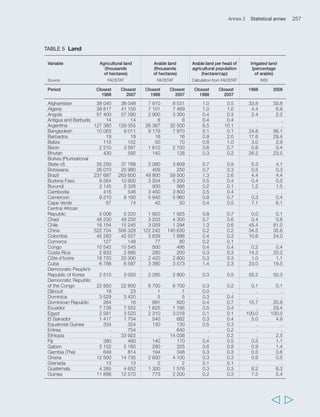
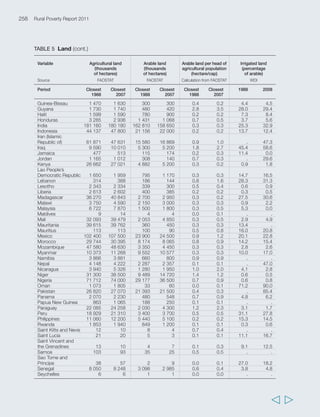
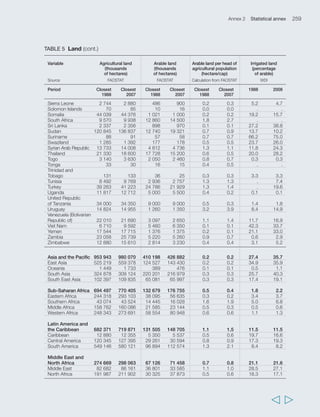
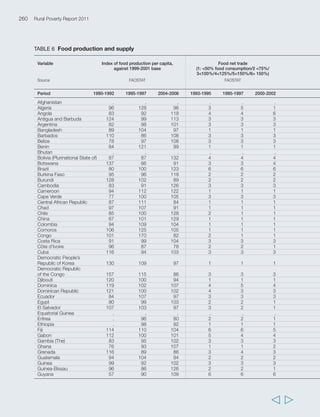
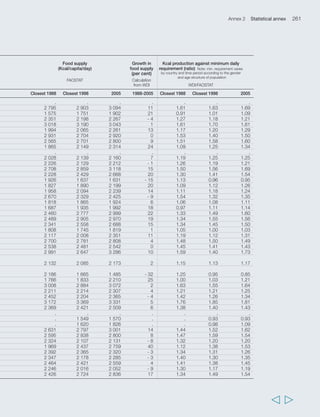
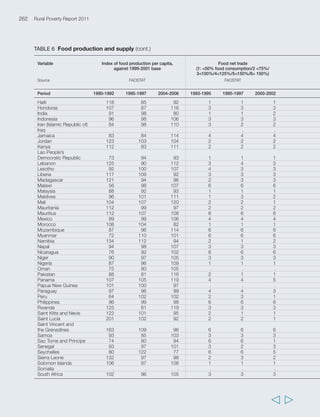
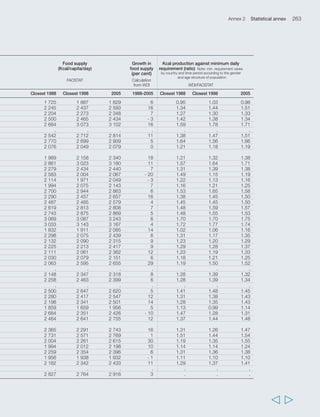
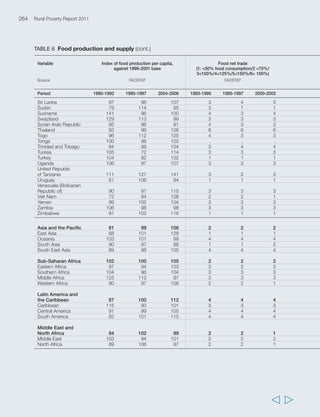
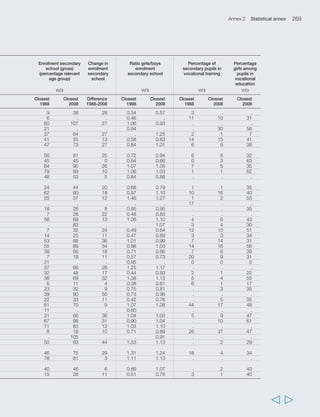
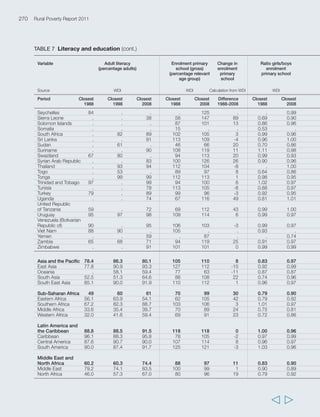
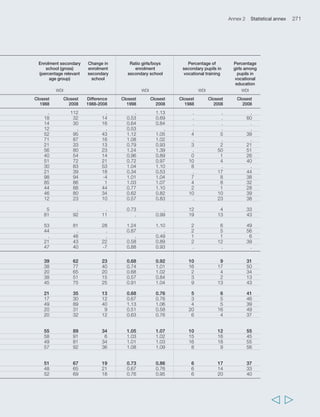
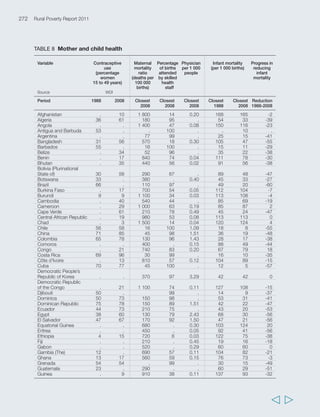
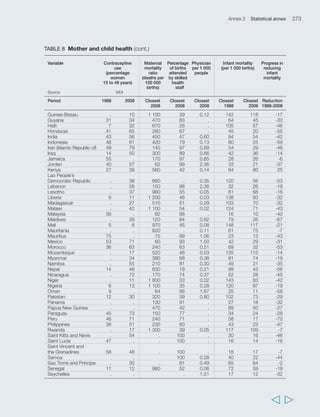
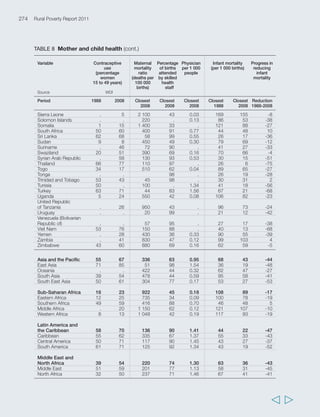
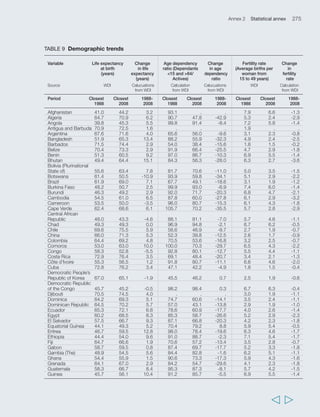
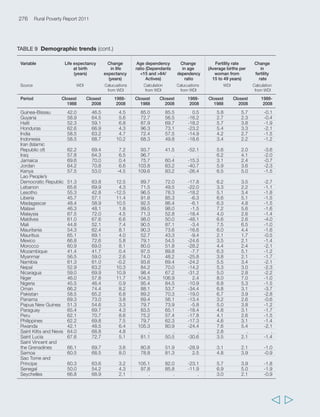
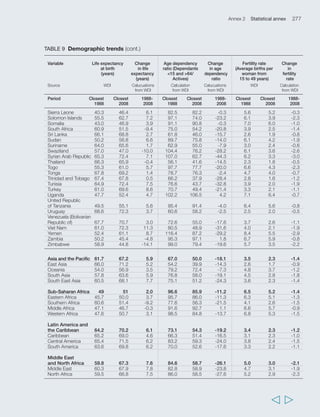
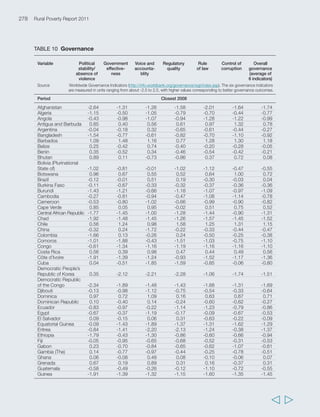
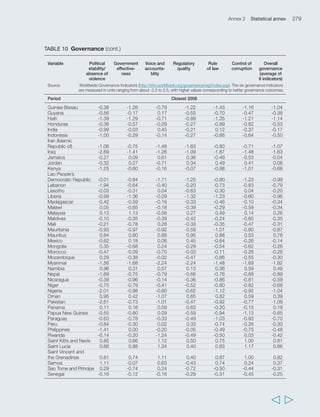
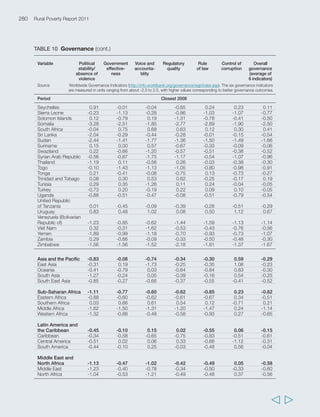

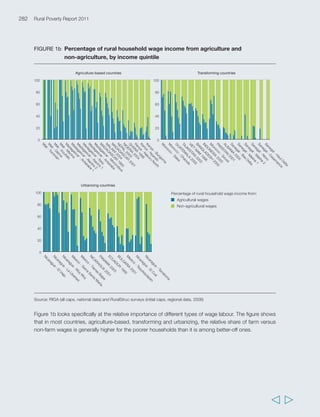
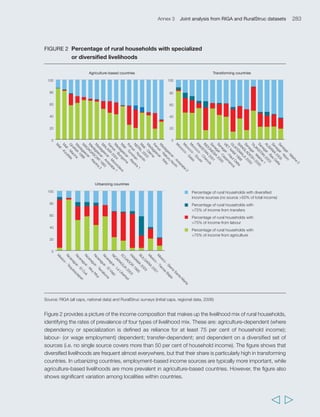
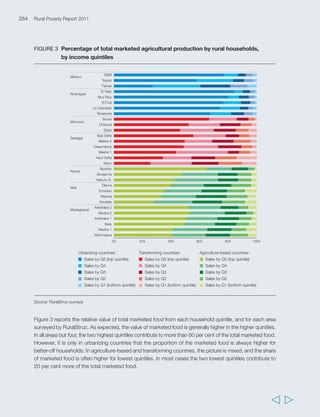
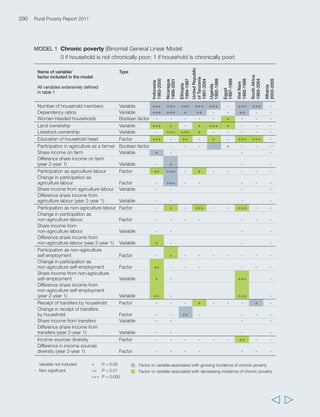
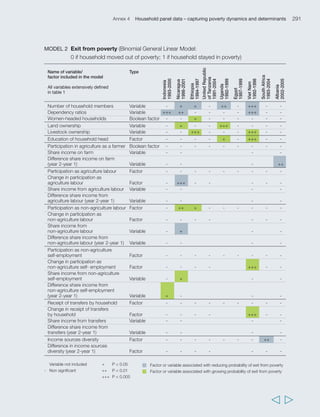
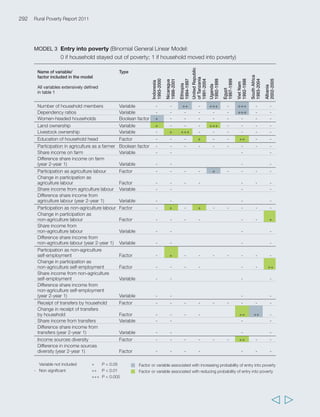
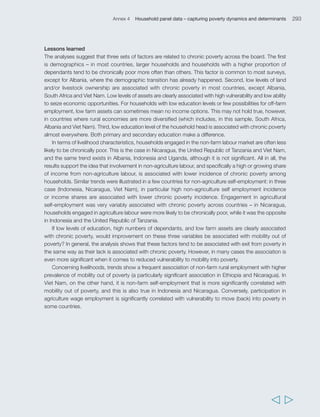
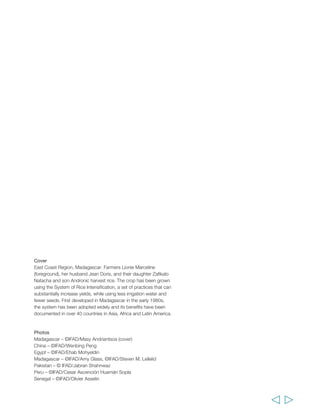
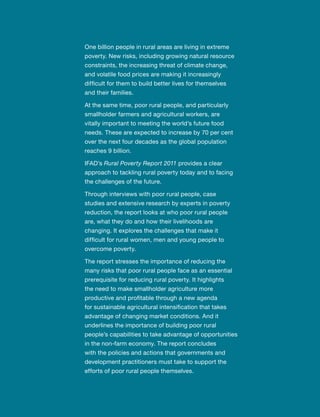
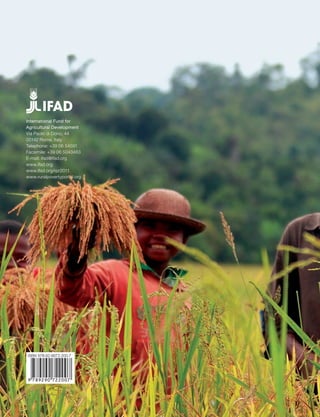

This report provides an in-depth analysis of rural poverty around the world. It finds that over 1.4 billion people live in extreme poverty, with over two-thirds residing in rural areas of developing countries. Smallholder agriculture and a thriving rural non-farm sector are key to reducing rural poverty, but these will need to be sustainable and resilient in the face of increasing challenges like population growth, climate change, and volatile food prices. The report offers a comprehensive set of policy recommendations to create opportunities for rural people to work their way out of poverty through agriculture, off-farm activities, and education.


