Downloaded 18 times
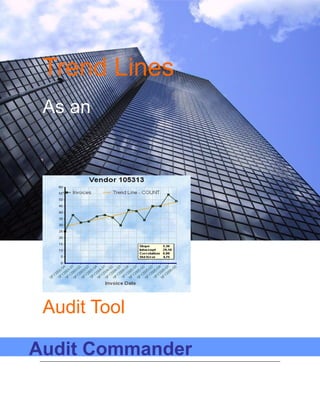
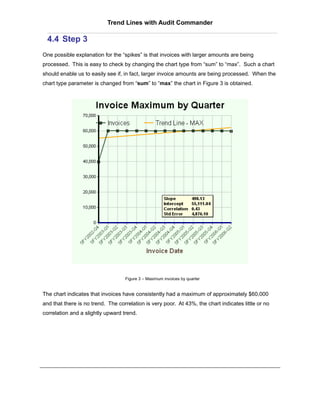


This document describes how to perform trend line analysis using Excel or Audit Commander software. It provides steps to generate trend line charts in Excel showing relationships between accounting data elements. It also demonstrates how Audit Commander can summarize raw data, generate trend line charts, and perform drill downs to analyze specific vendors or time periods. The software allows auditors to easily analyze large datasets to identify anomalies in transaction patterns over time.