Downloaded 121 times


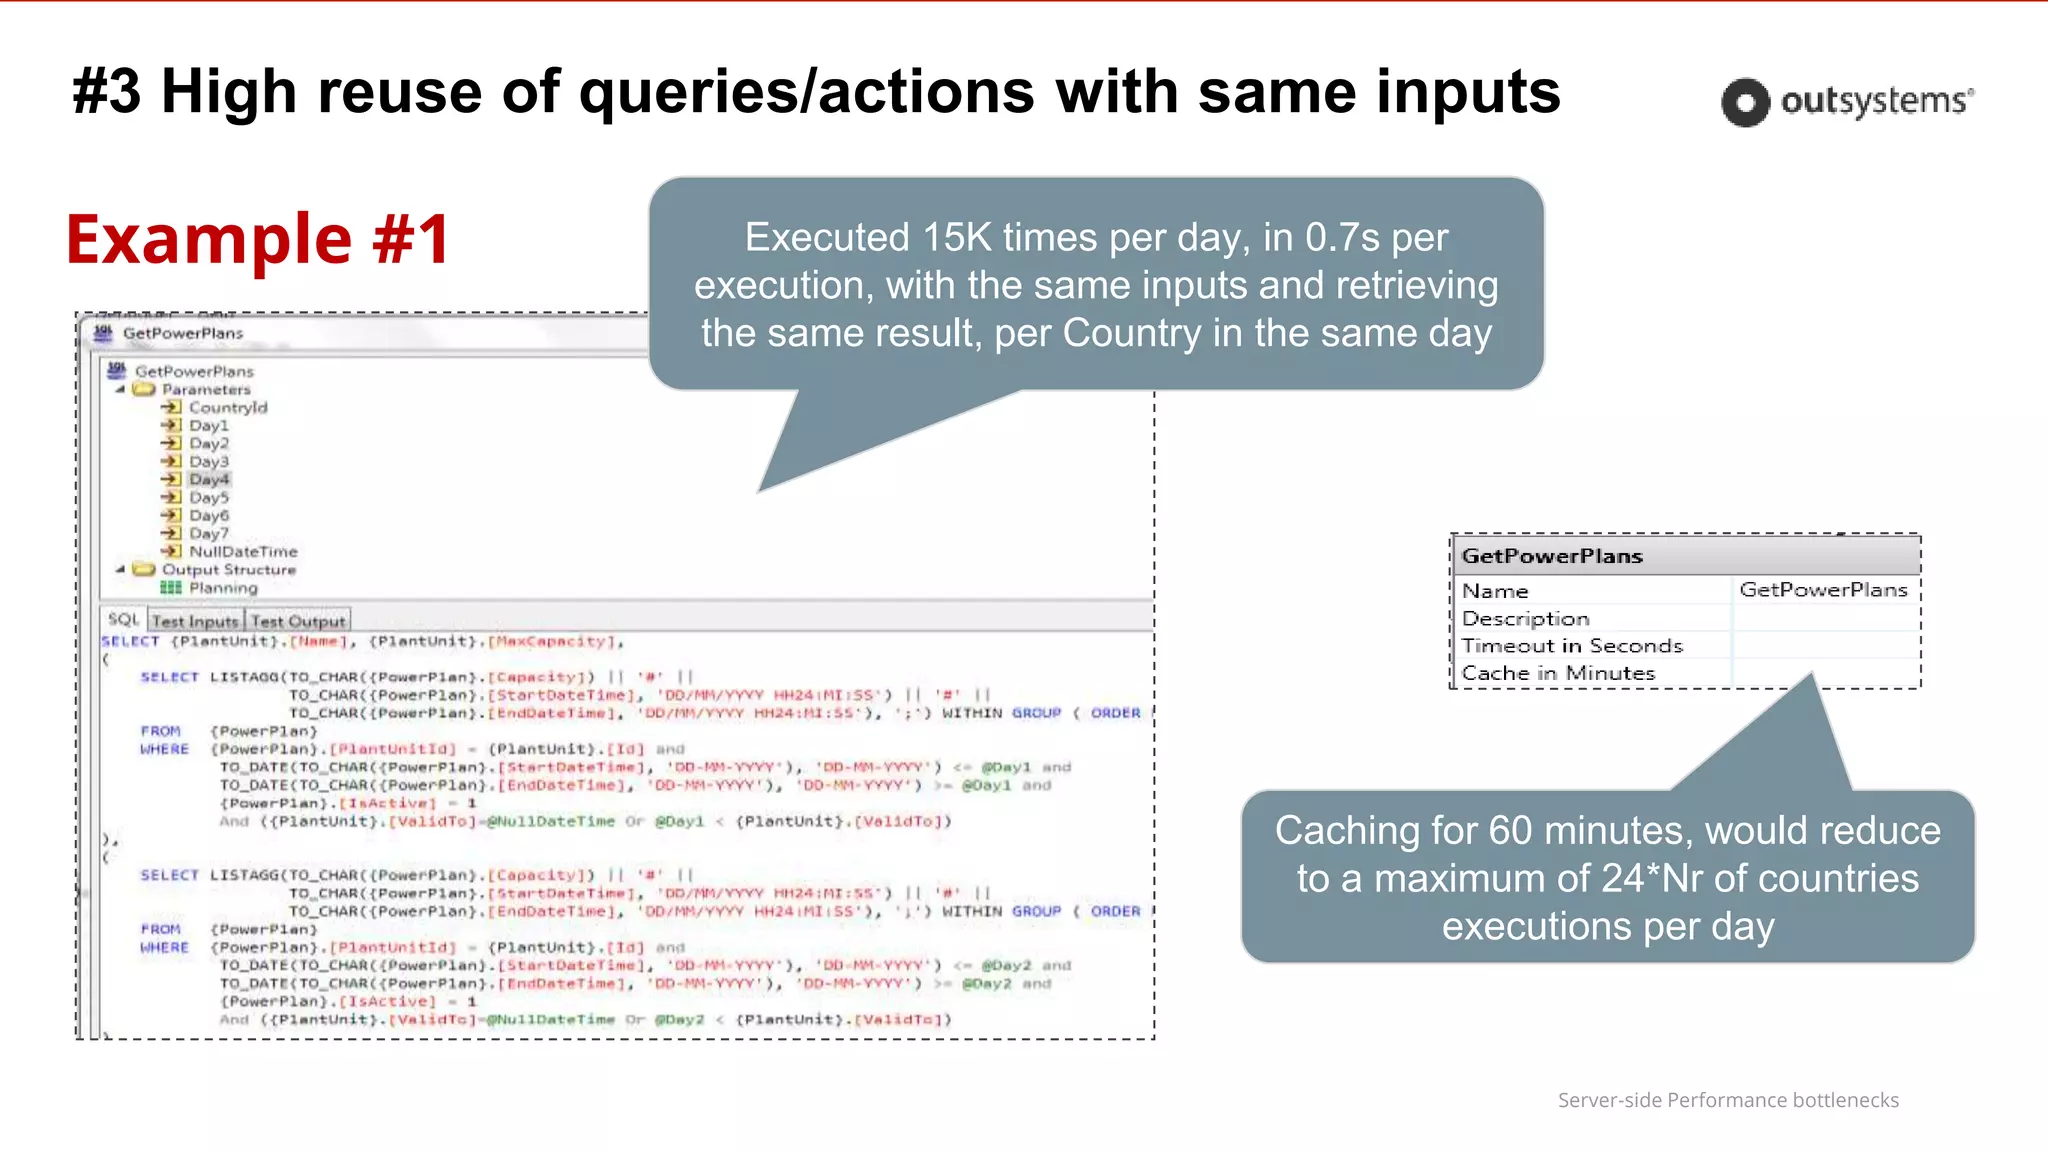
![Server-side Performance bottlenecks
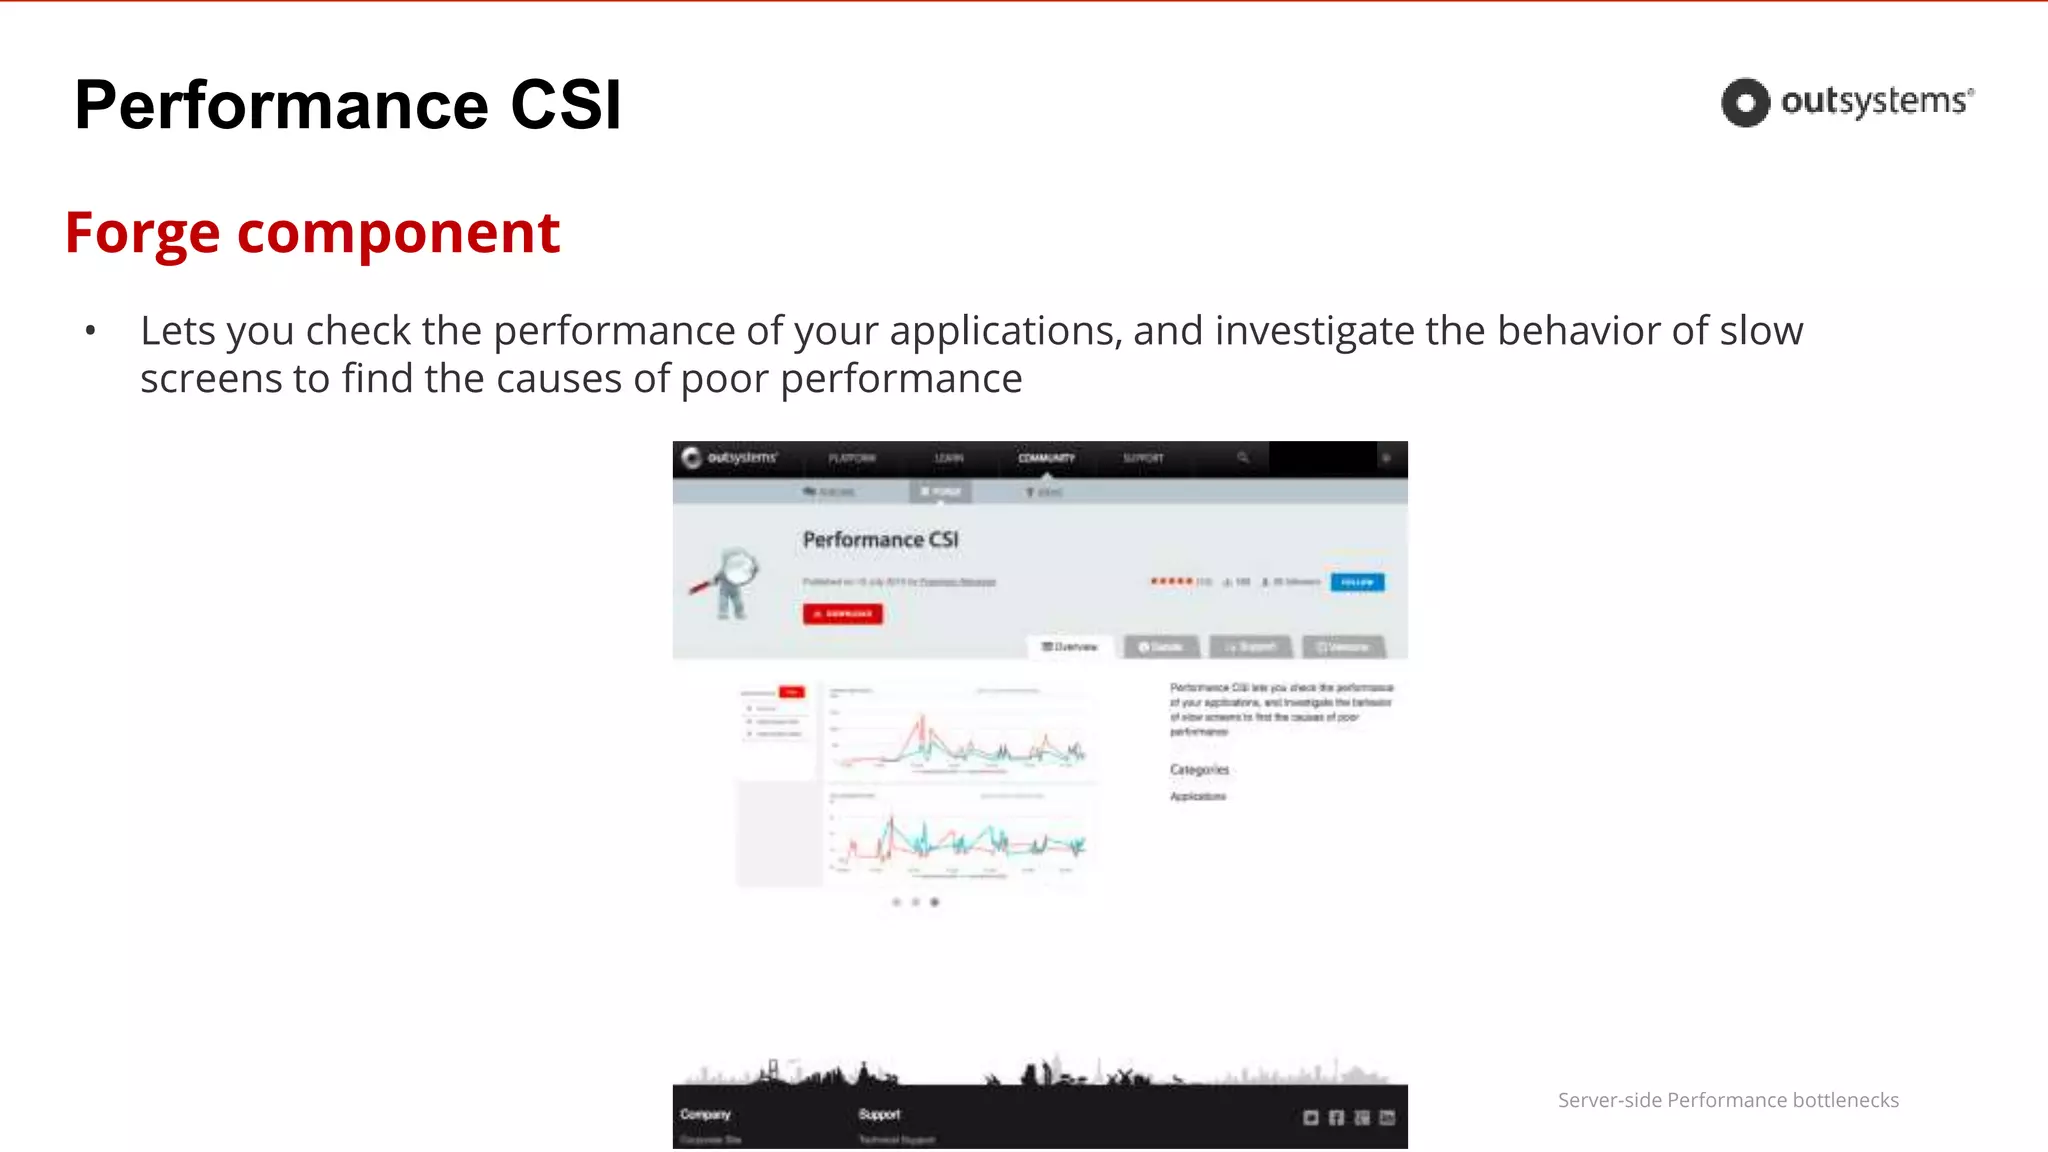
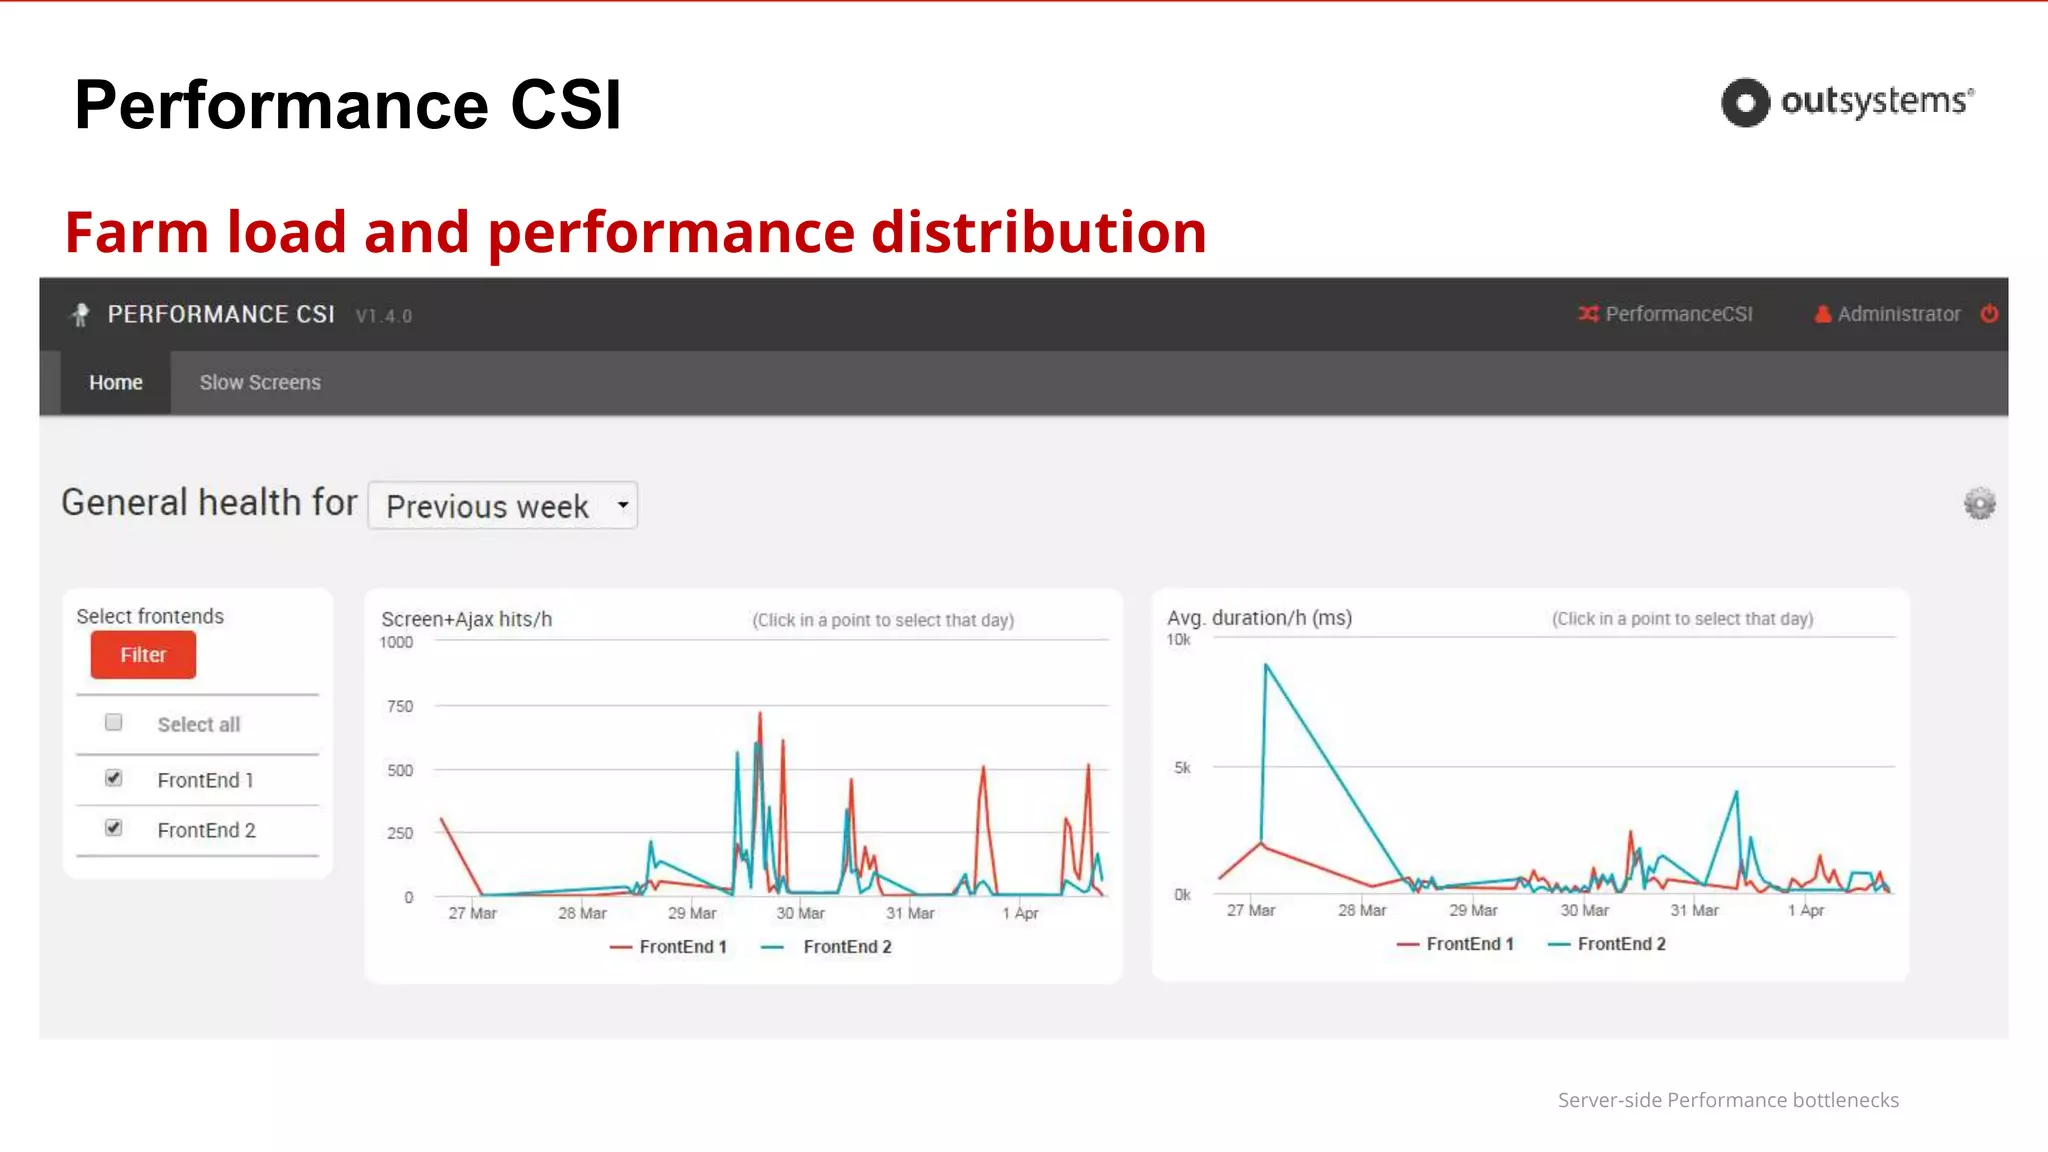
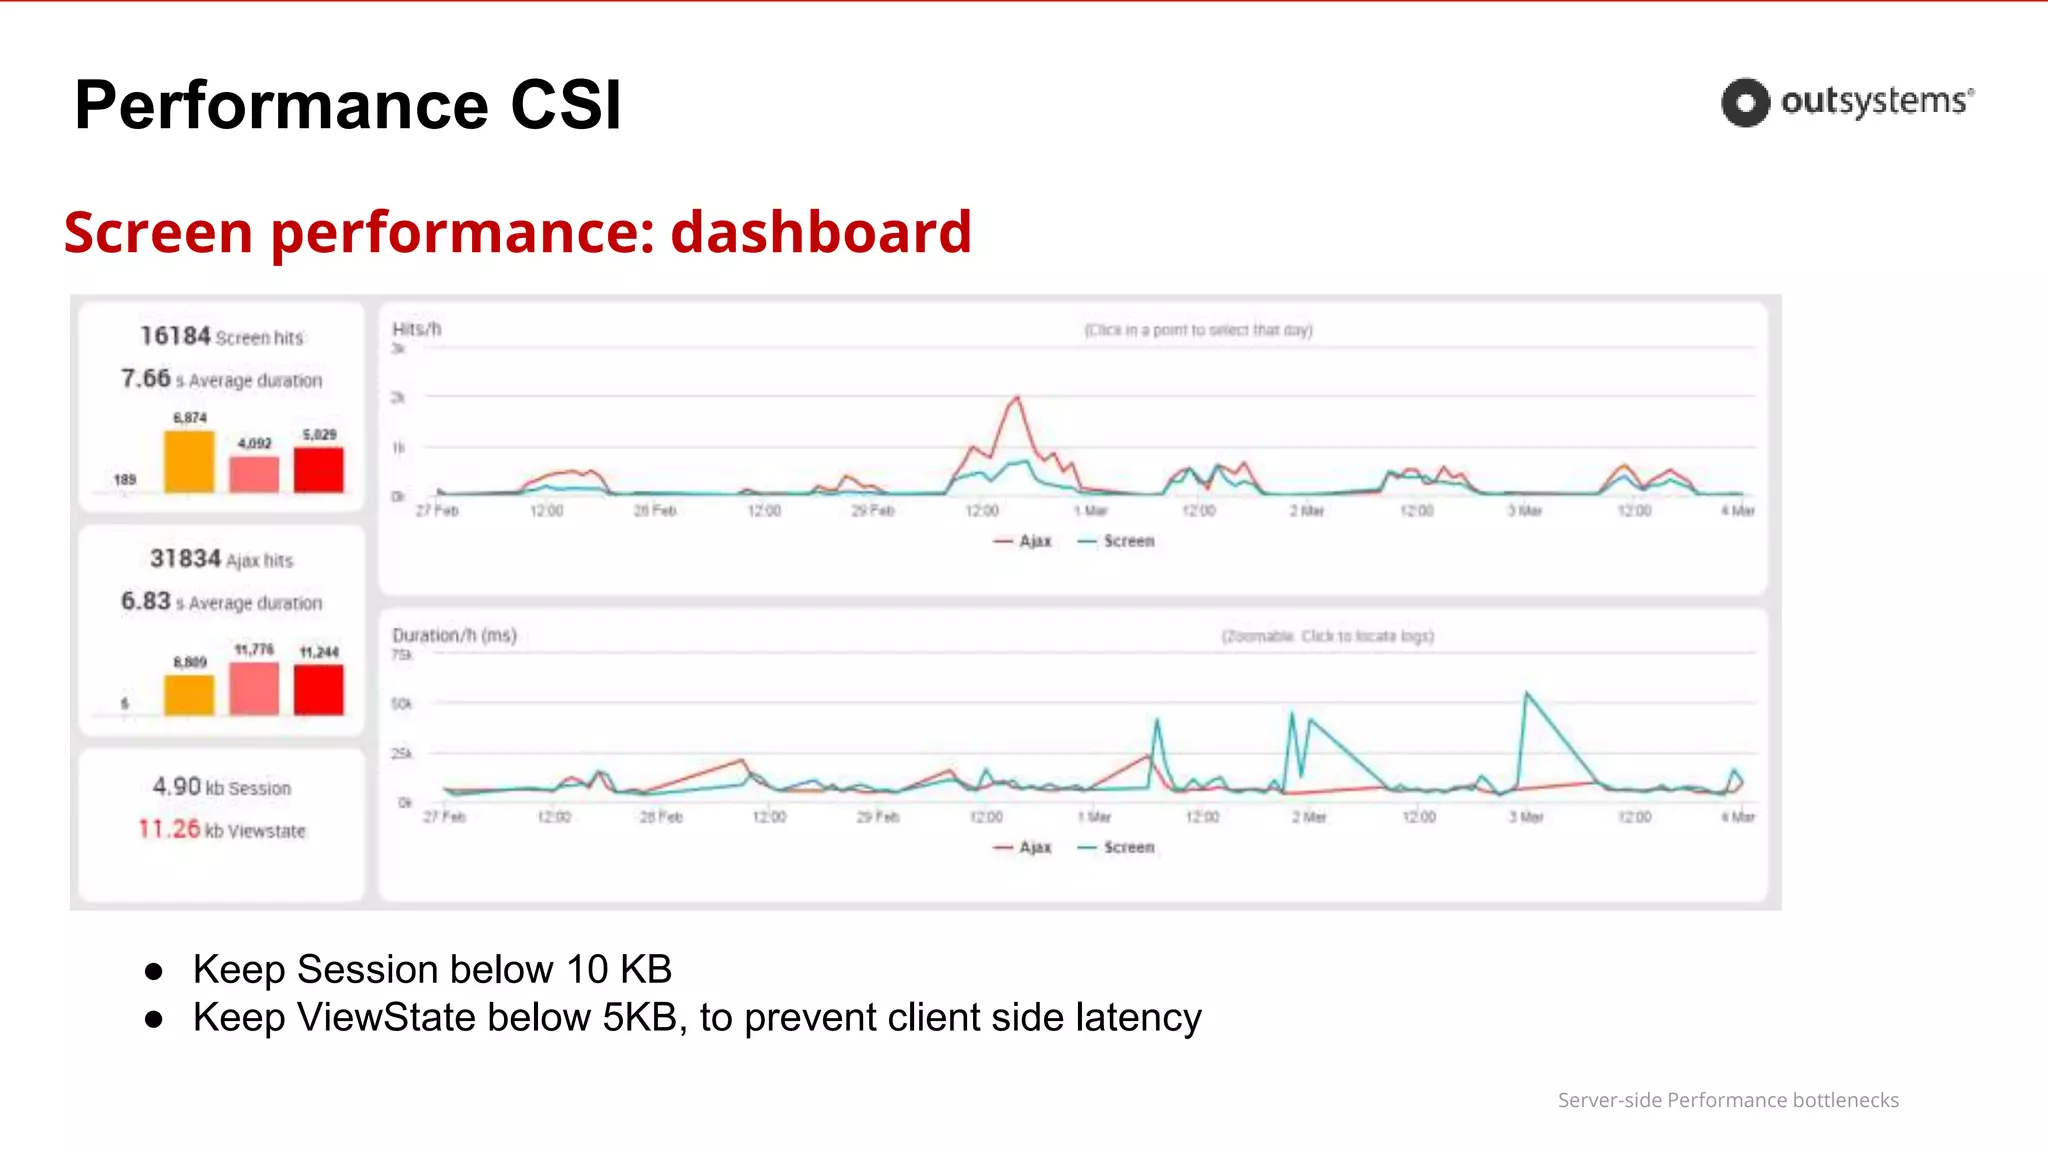
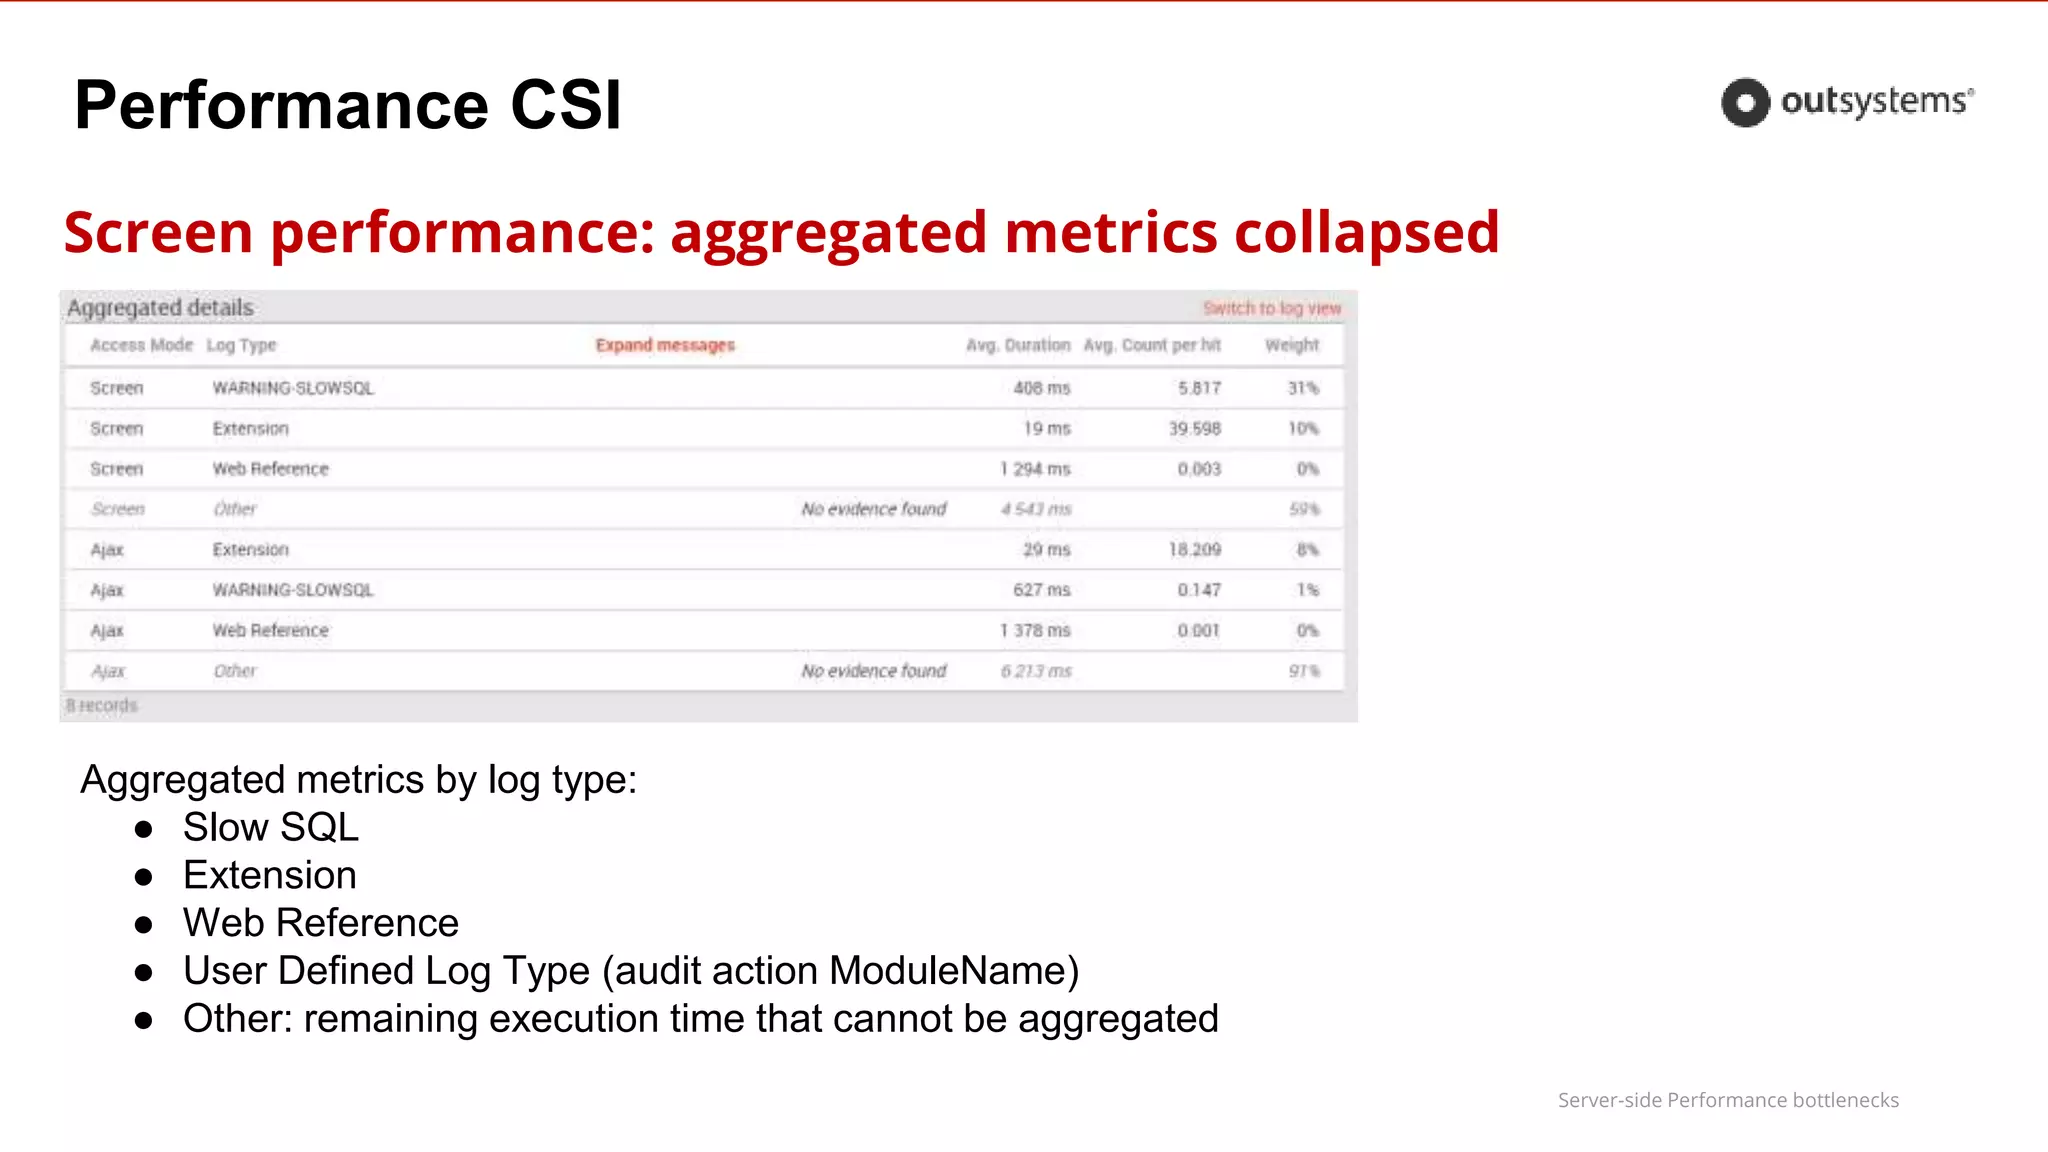
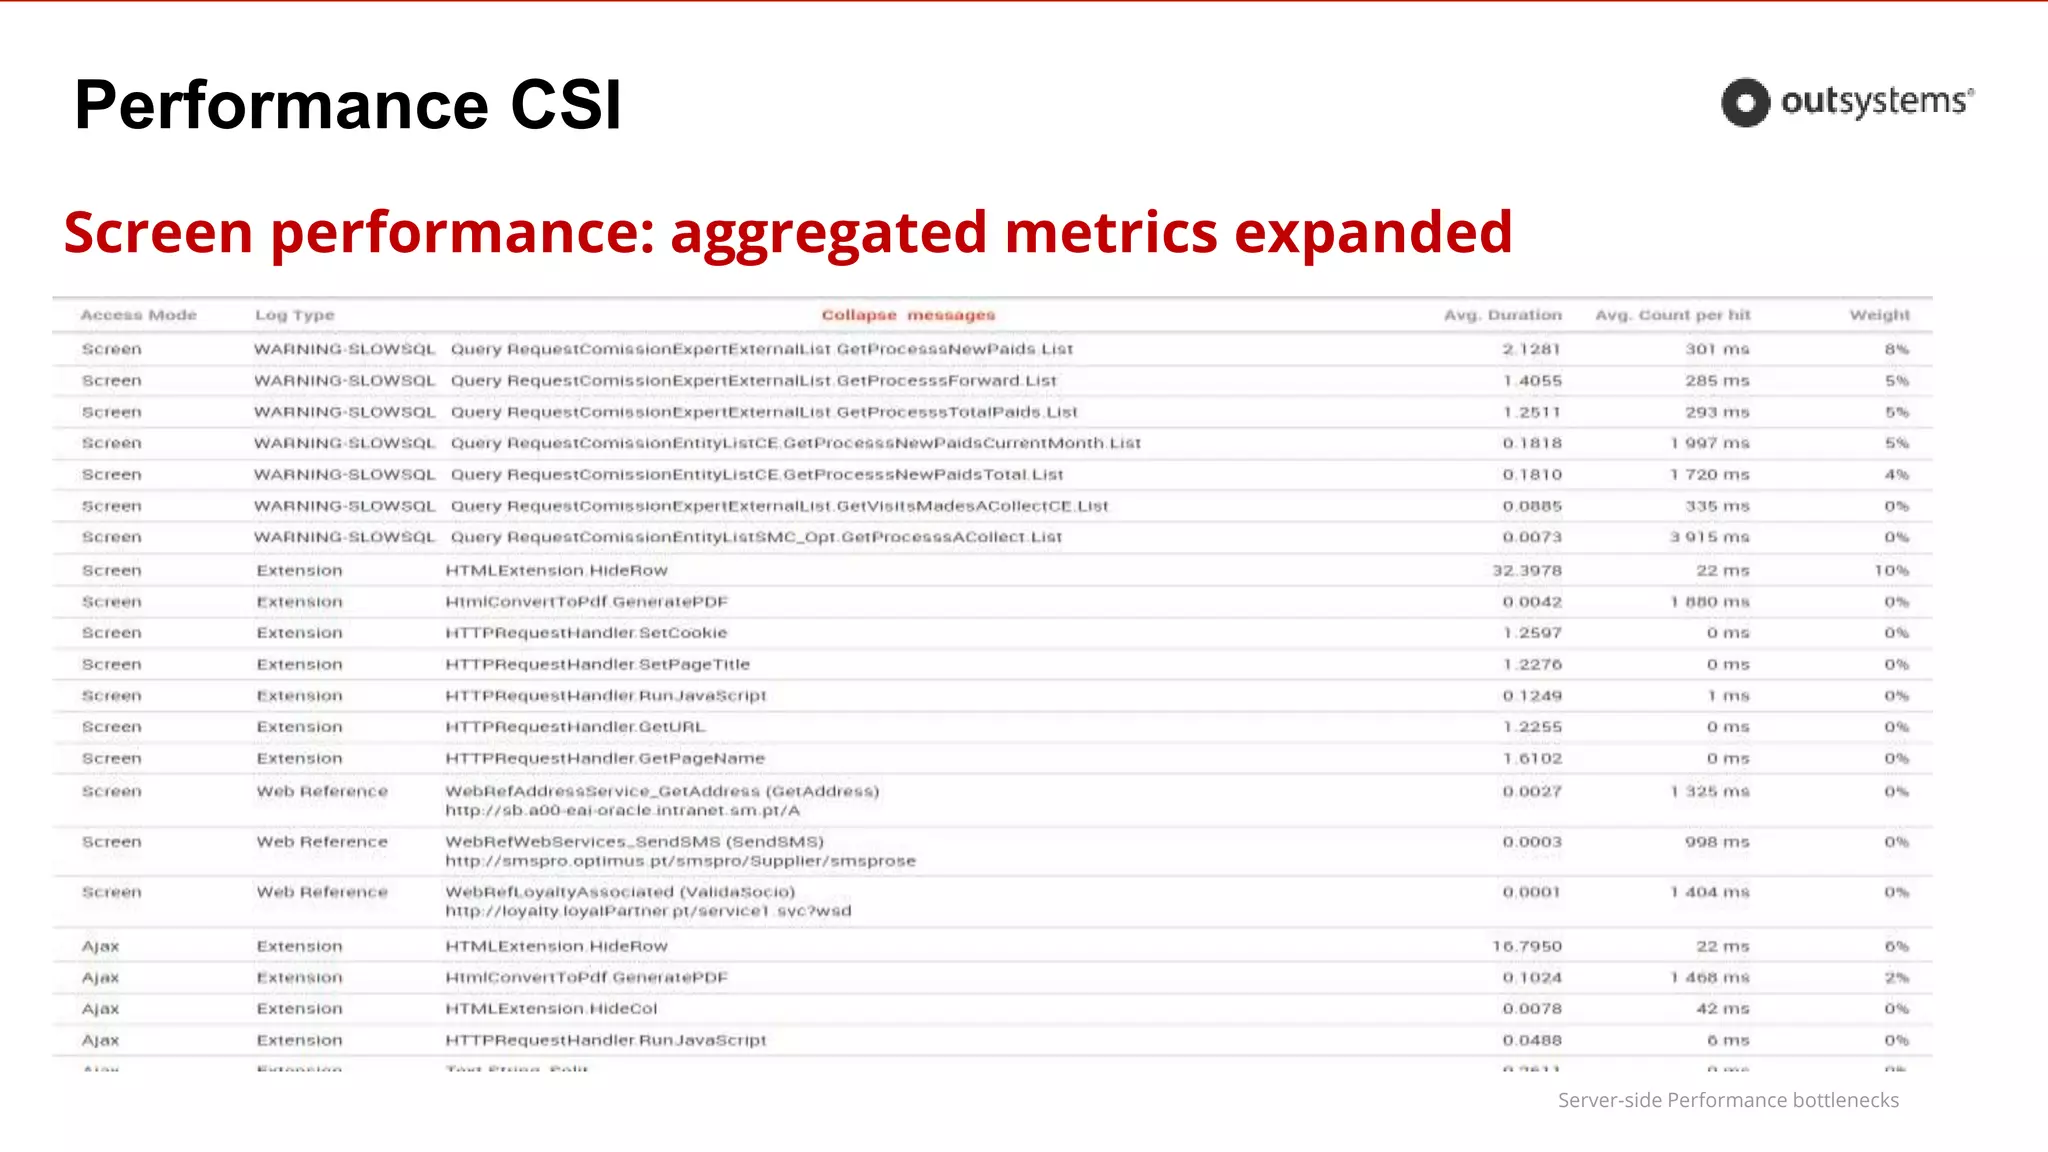
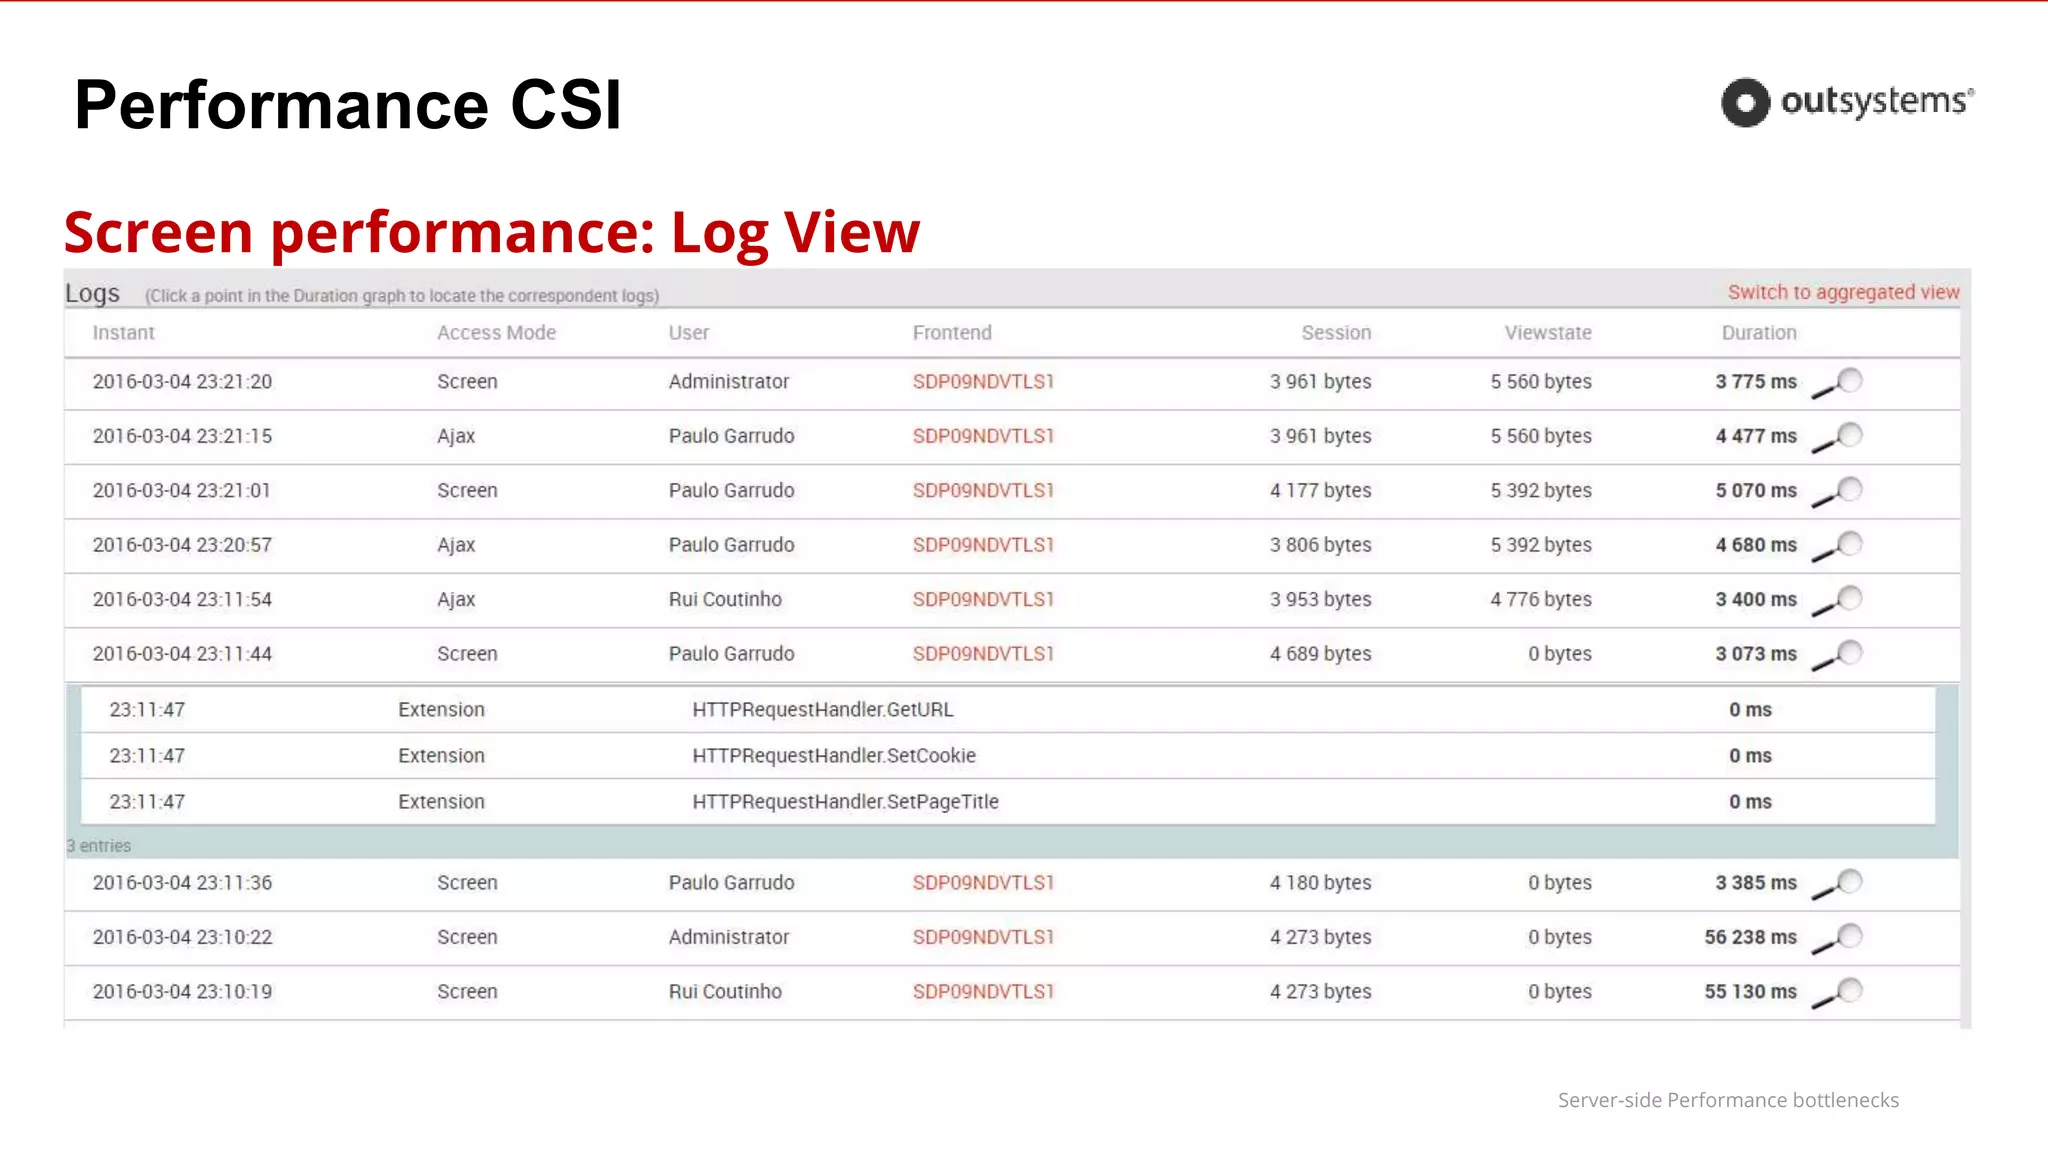
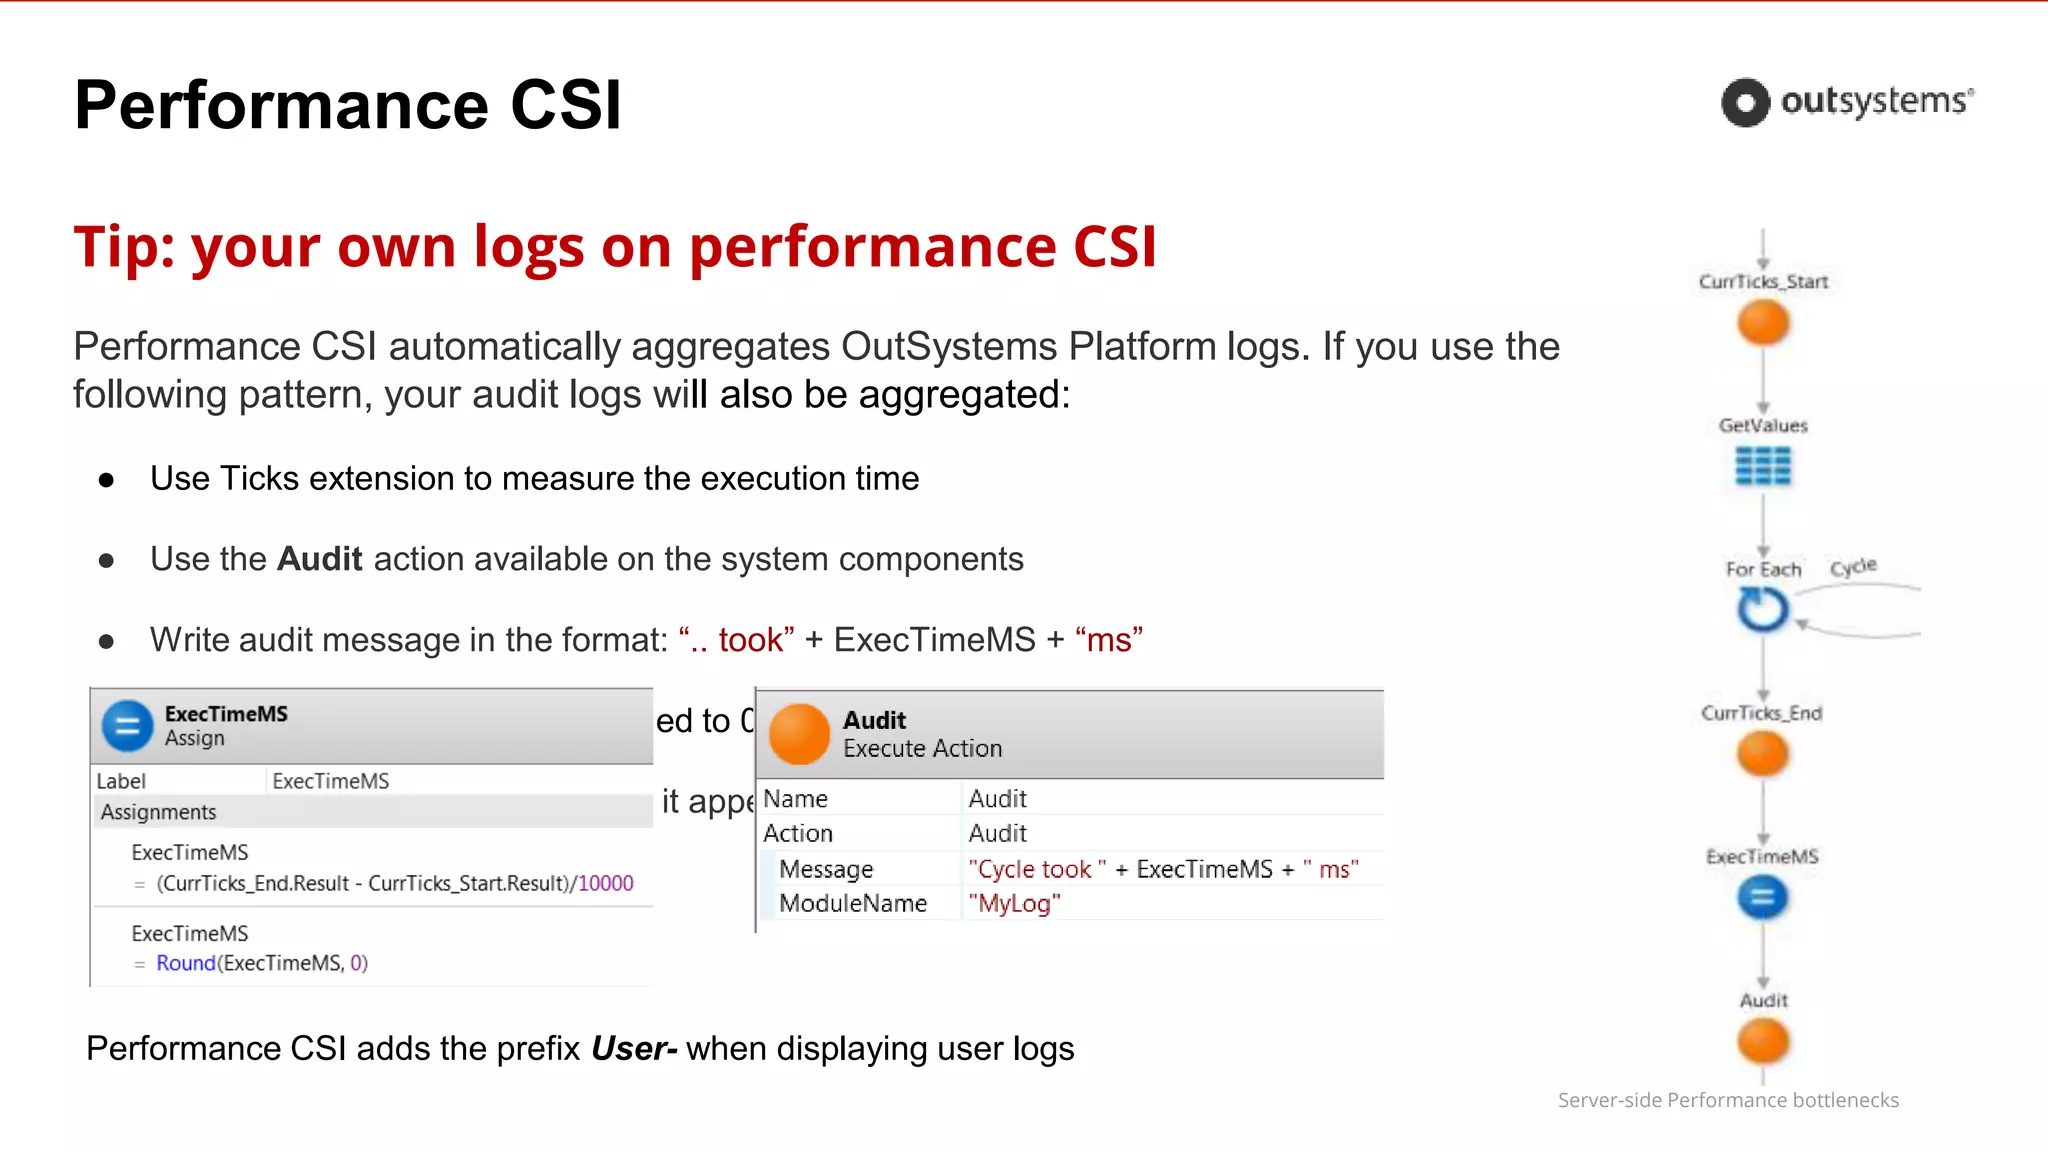
Performance CSI
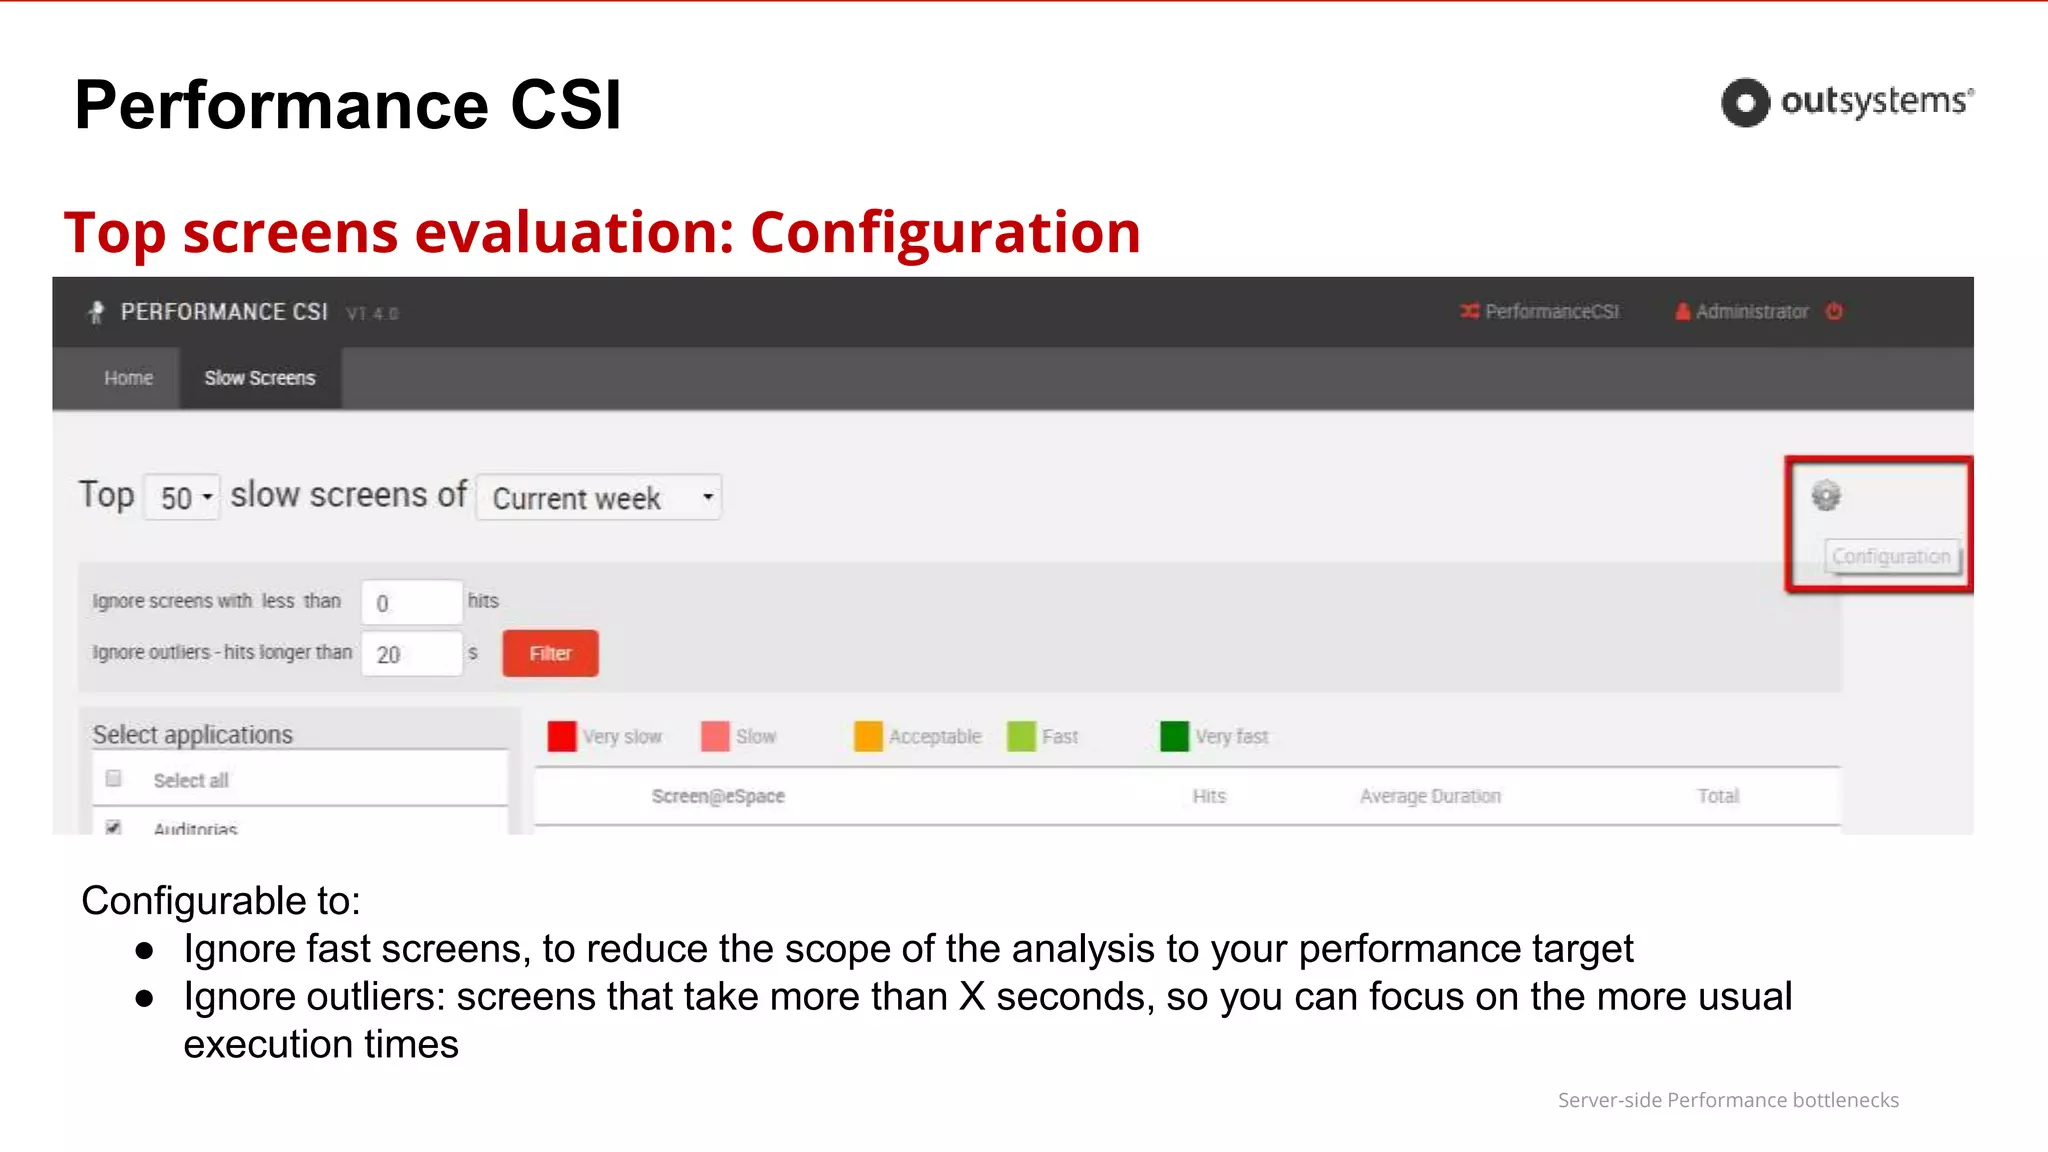
Top screens evaluation
Weekly slow screen list:
● Number of hits (screen & ajax)
● Average Duration (screen & ajax)
● Total time = Hits * Avg. Duration
Allows to
● filter by application
● Sort screen by the metrics more
important for your application
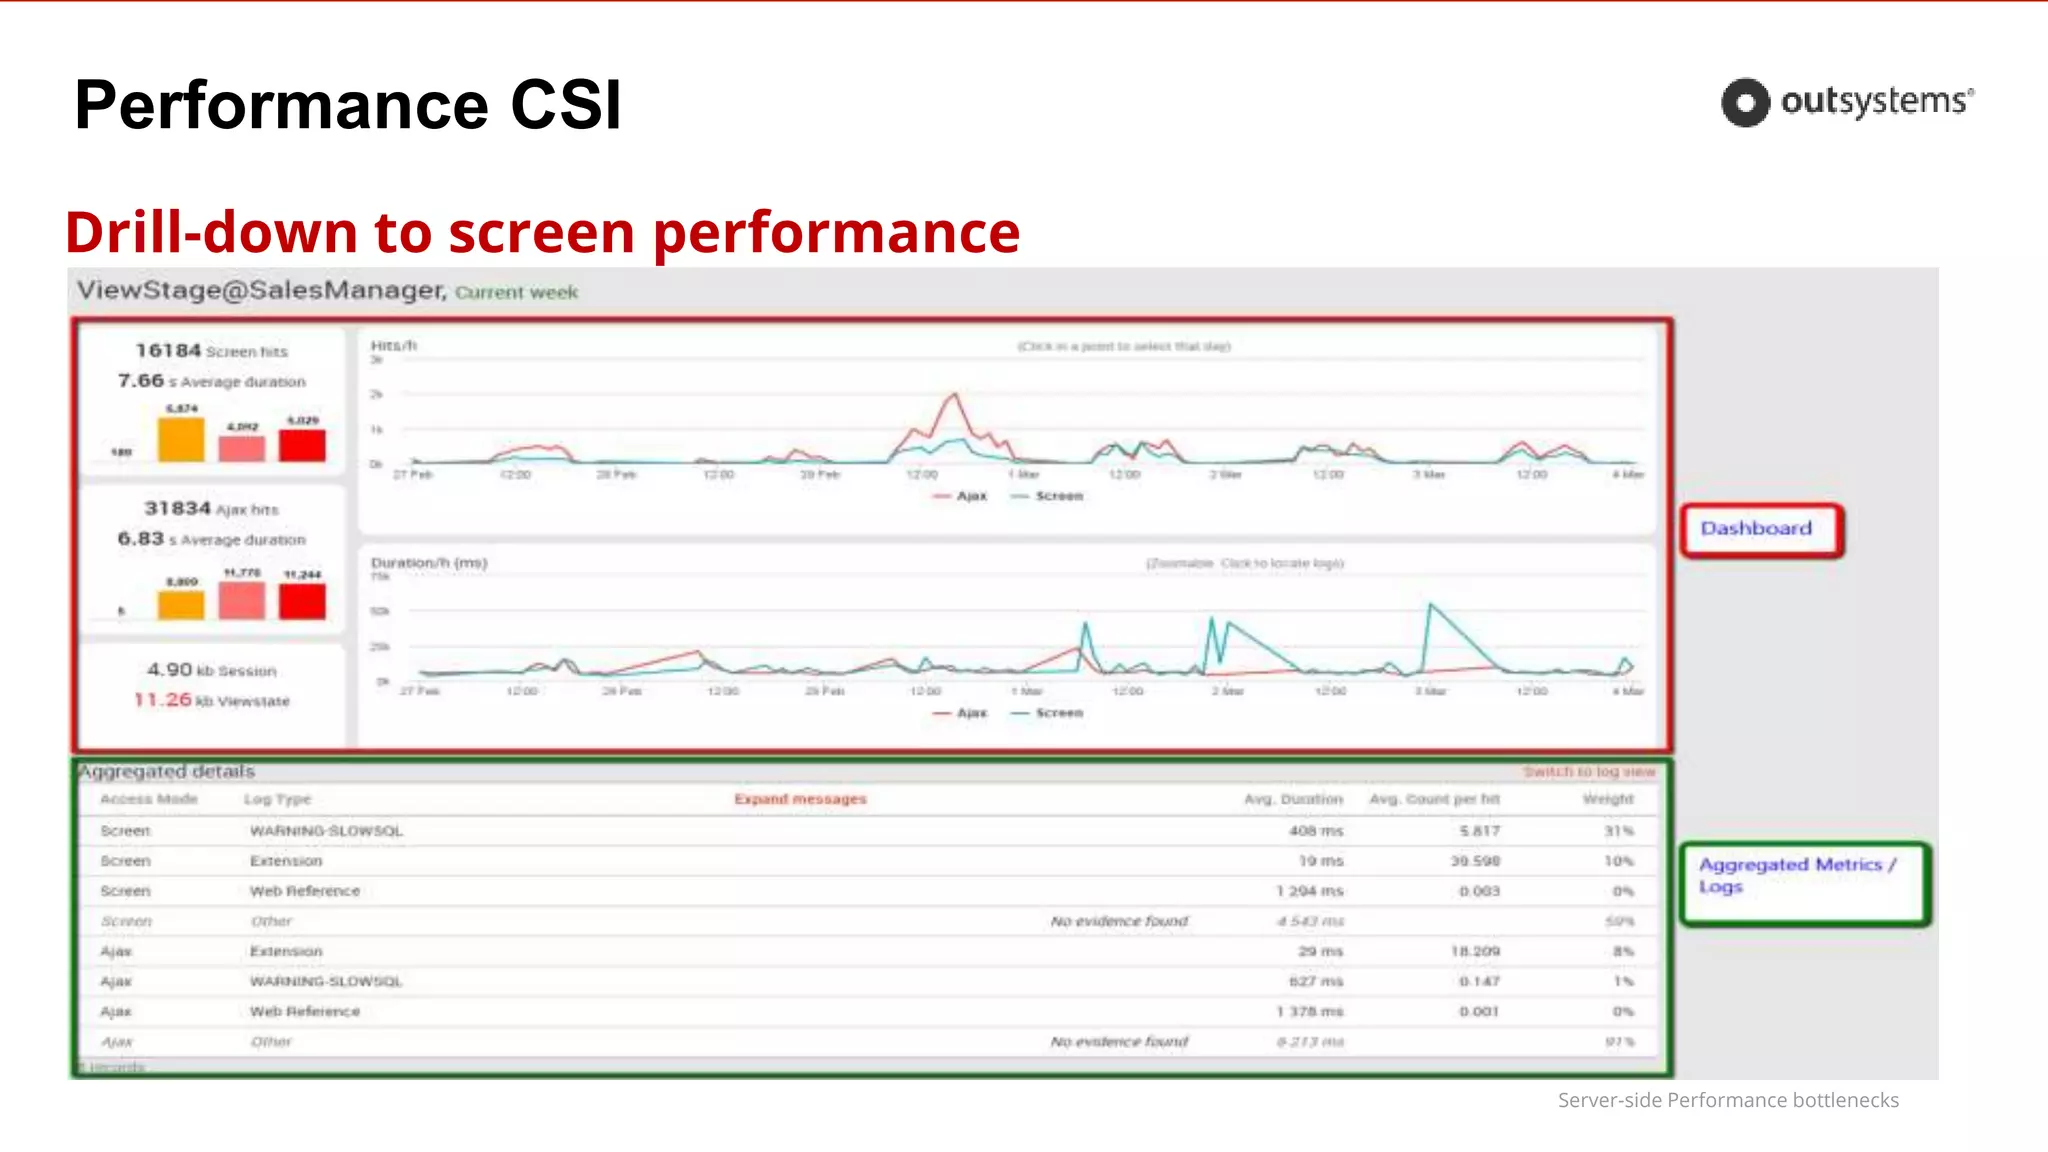
● Drill-down to screen details
Very Slow > 6s
Slow ]4 to 6] s
Acceptable ]2 to 4] s
Fast [1 to 2] s
Very fast < 1s](https://image.slidesharecdn.com/webinar-detectperformancebottlenecksofapplications-160502103359/75/Training-Webinar-Detect-Performance-Bottlenecks-of-Applications-22-2048.jpg)


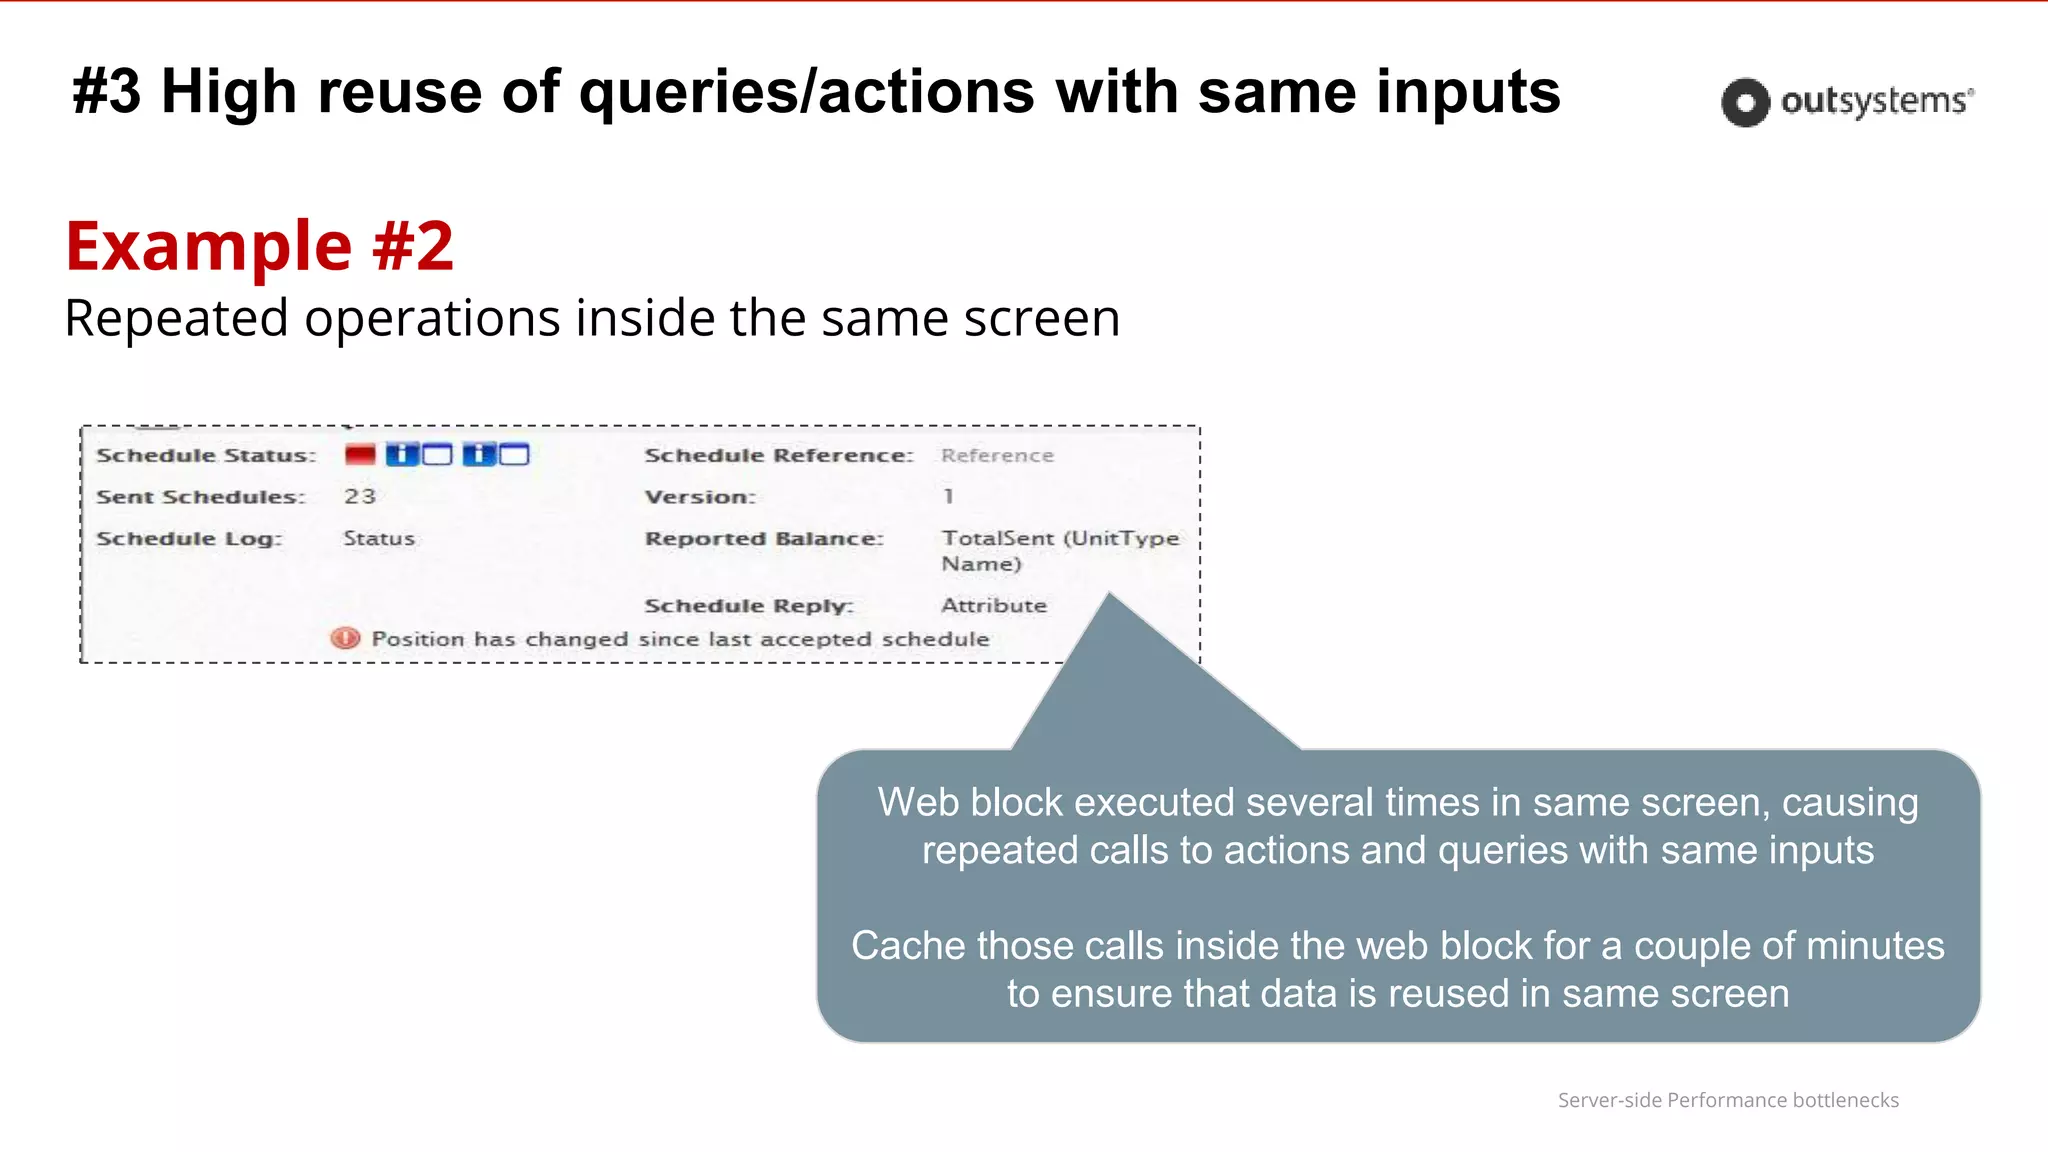
![Server-side Performance bottlenecks
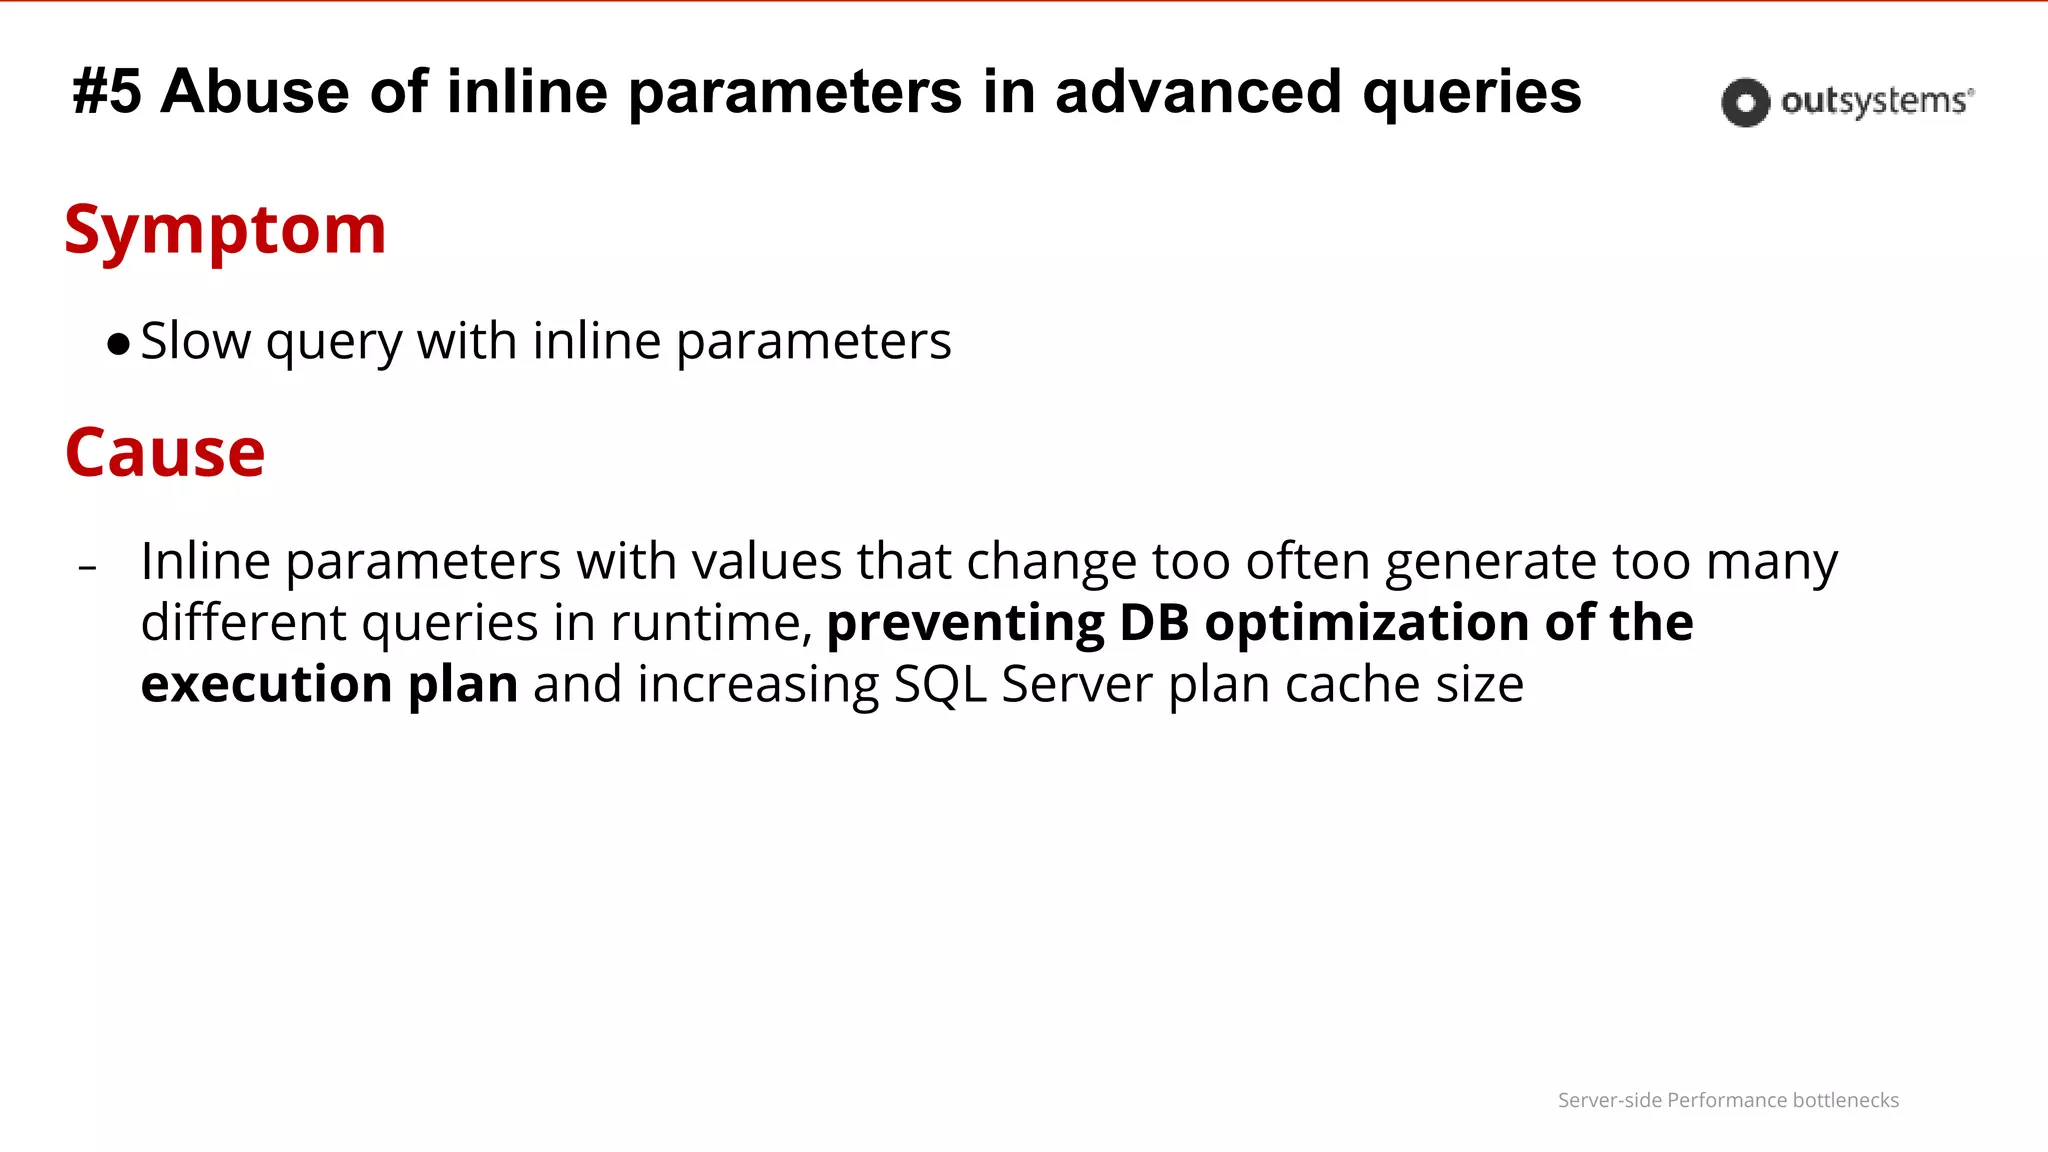
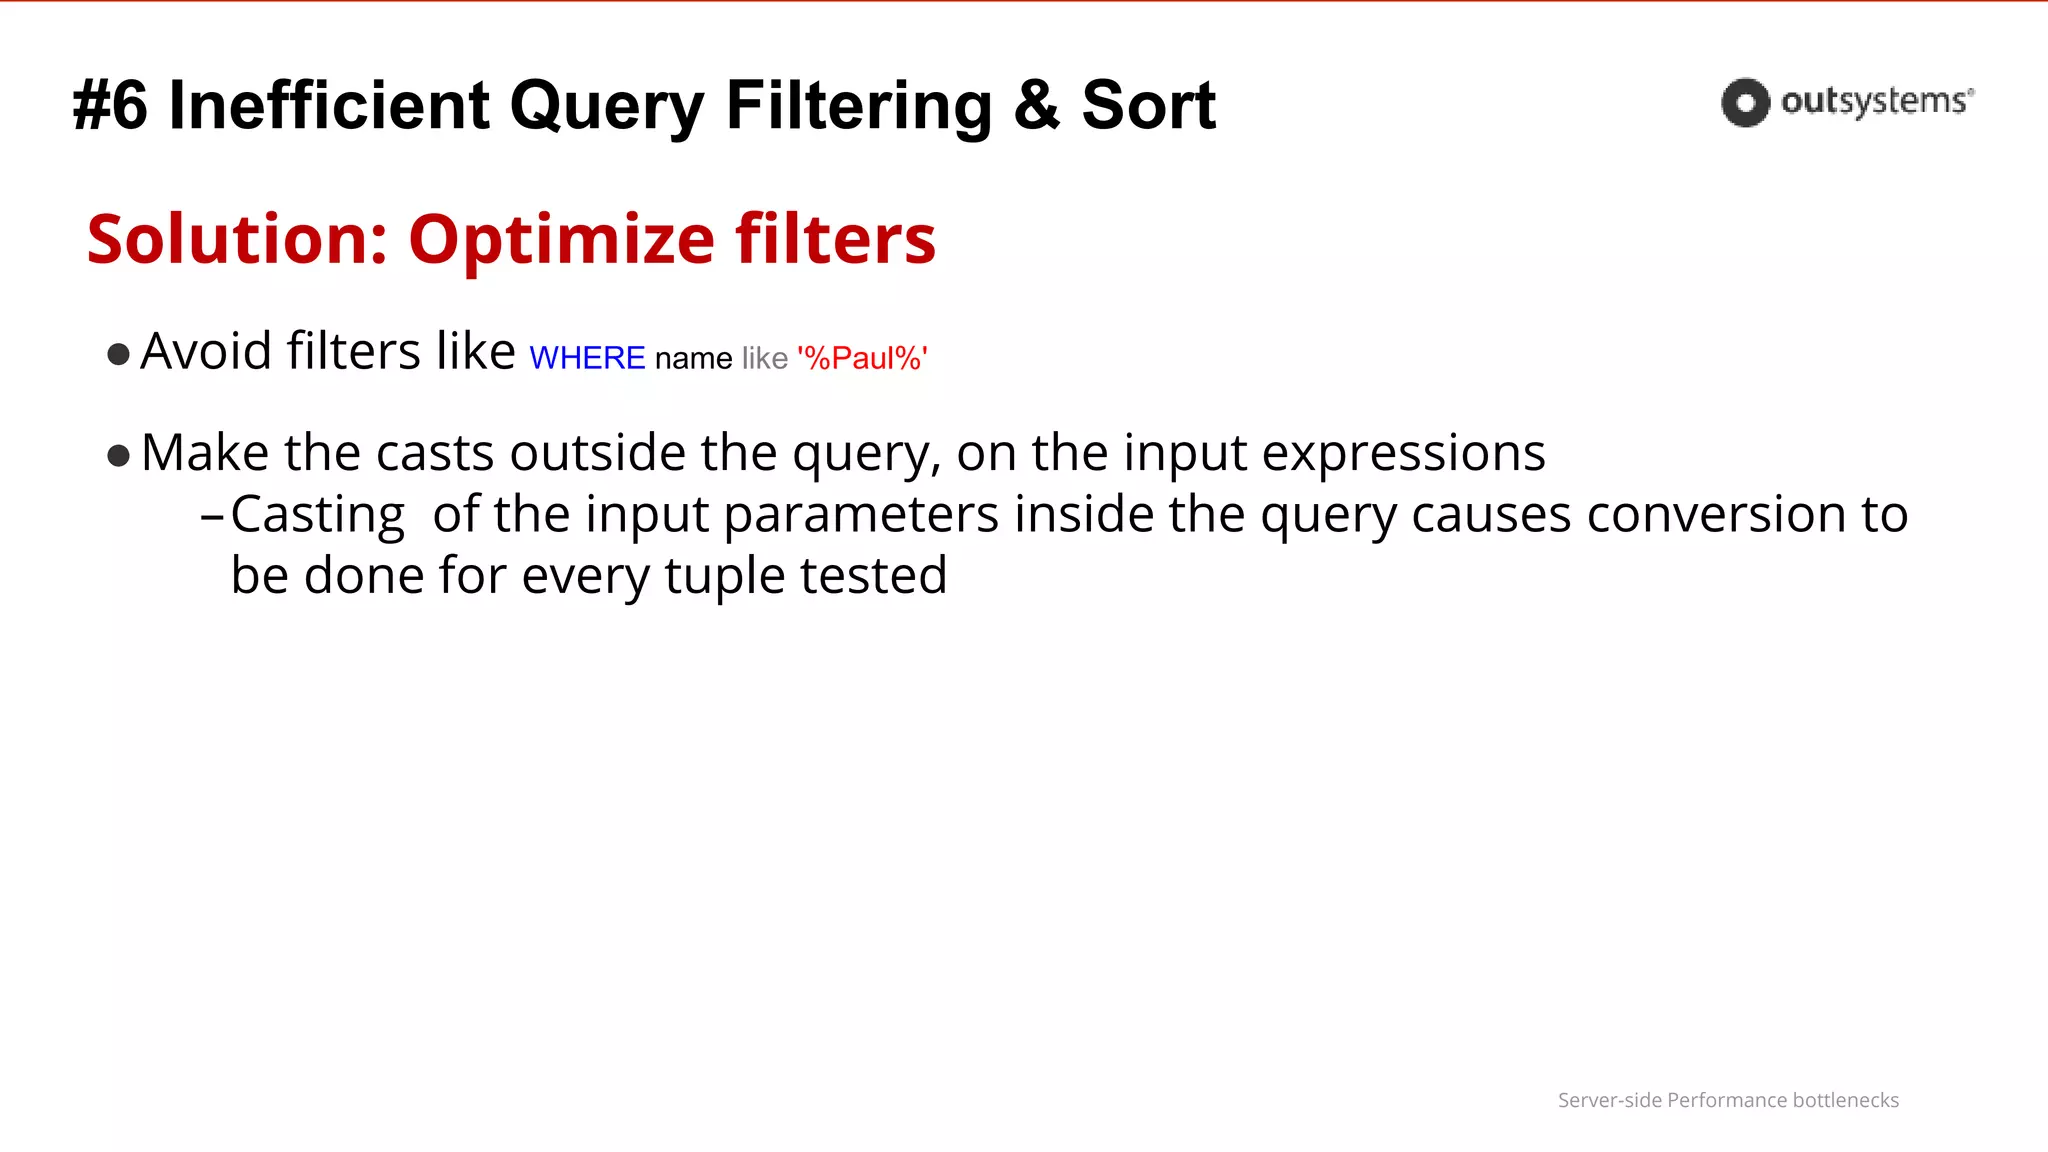
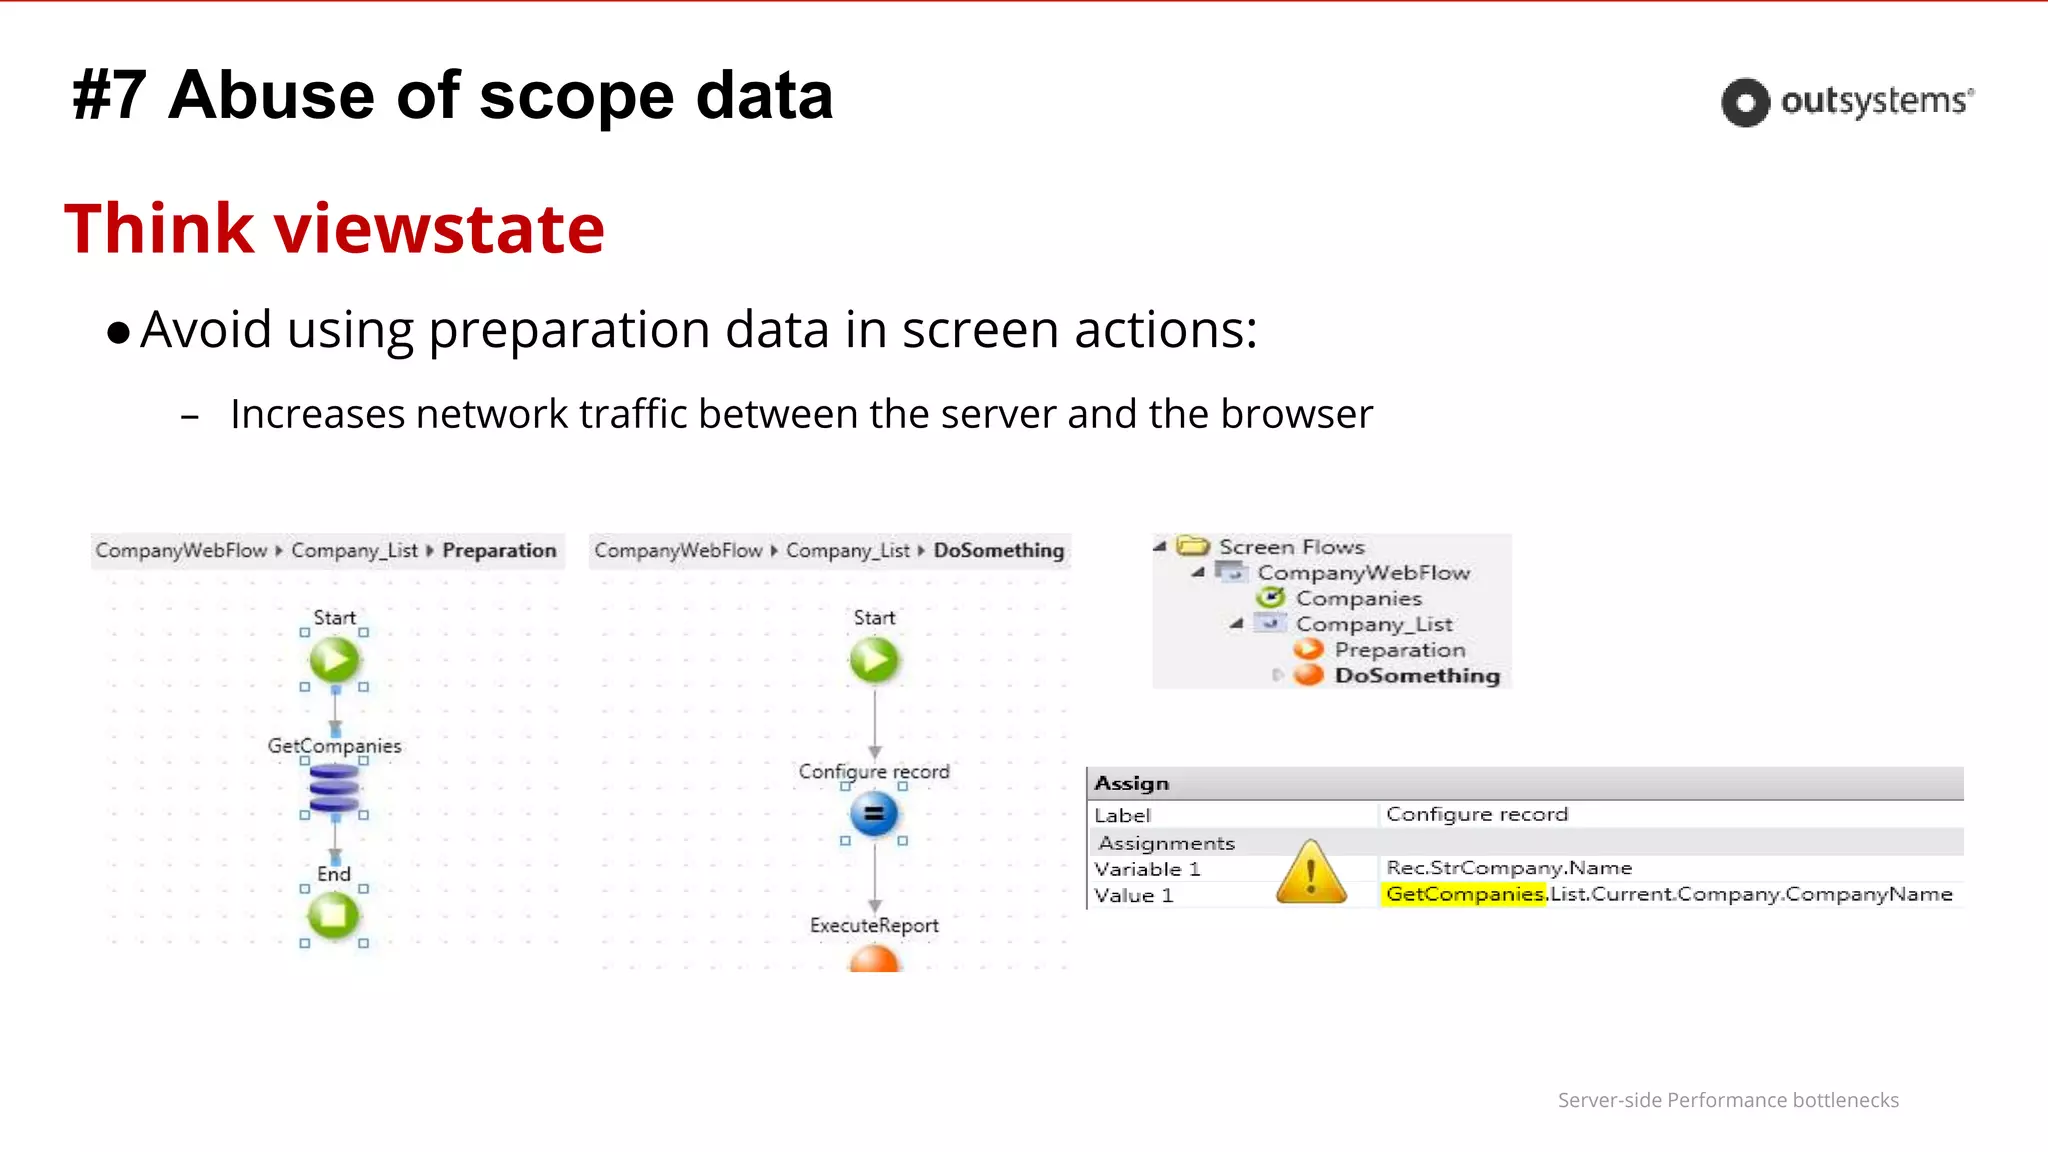
#5 Abuse of inline parameters in advanced queries
This common pattern always results in performance issues once data
volume increases
where [Id] in @IdList
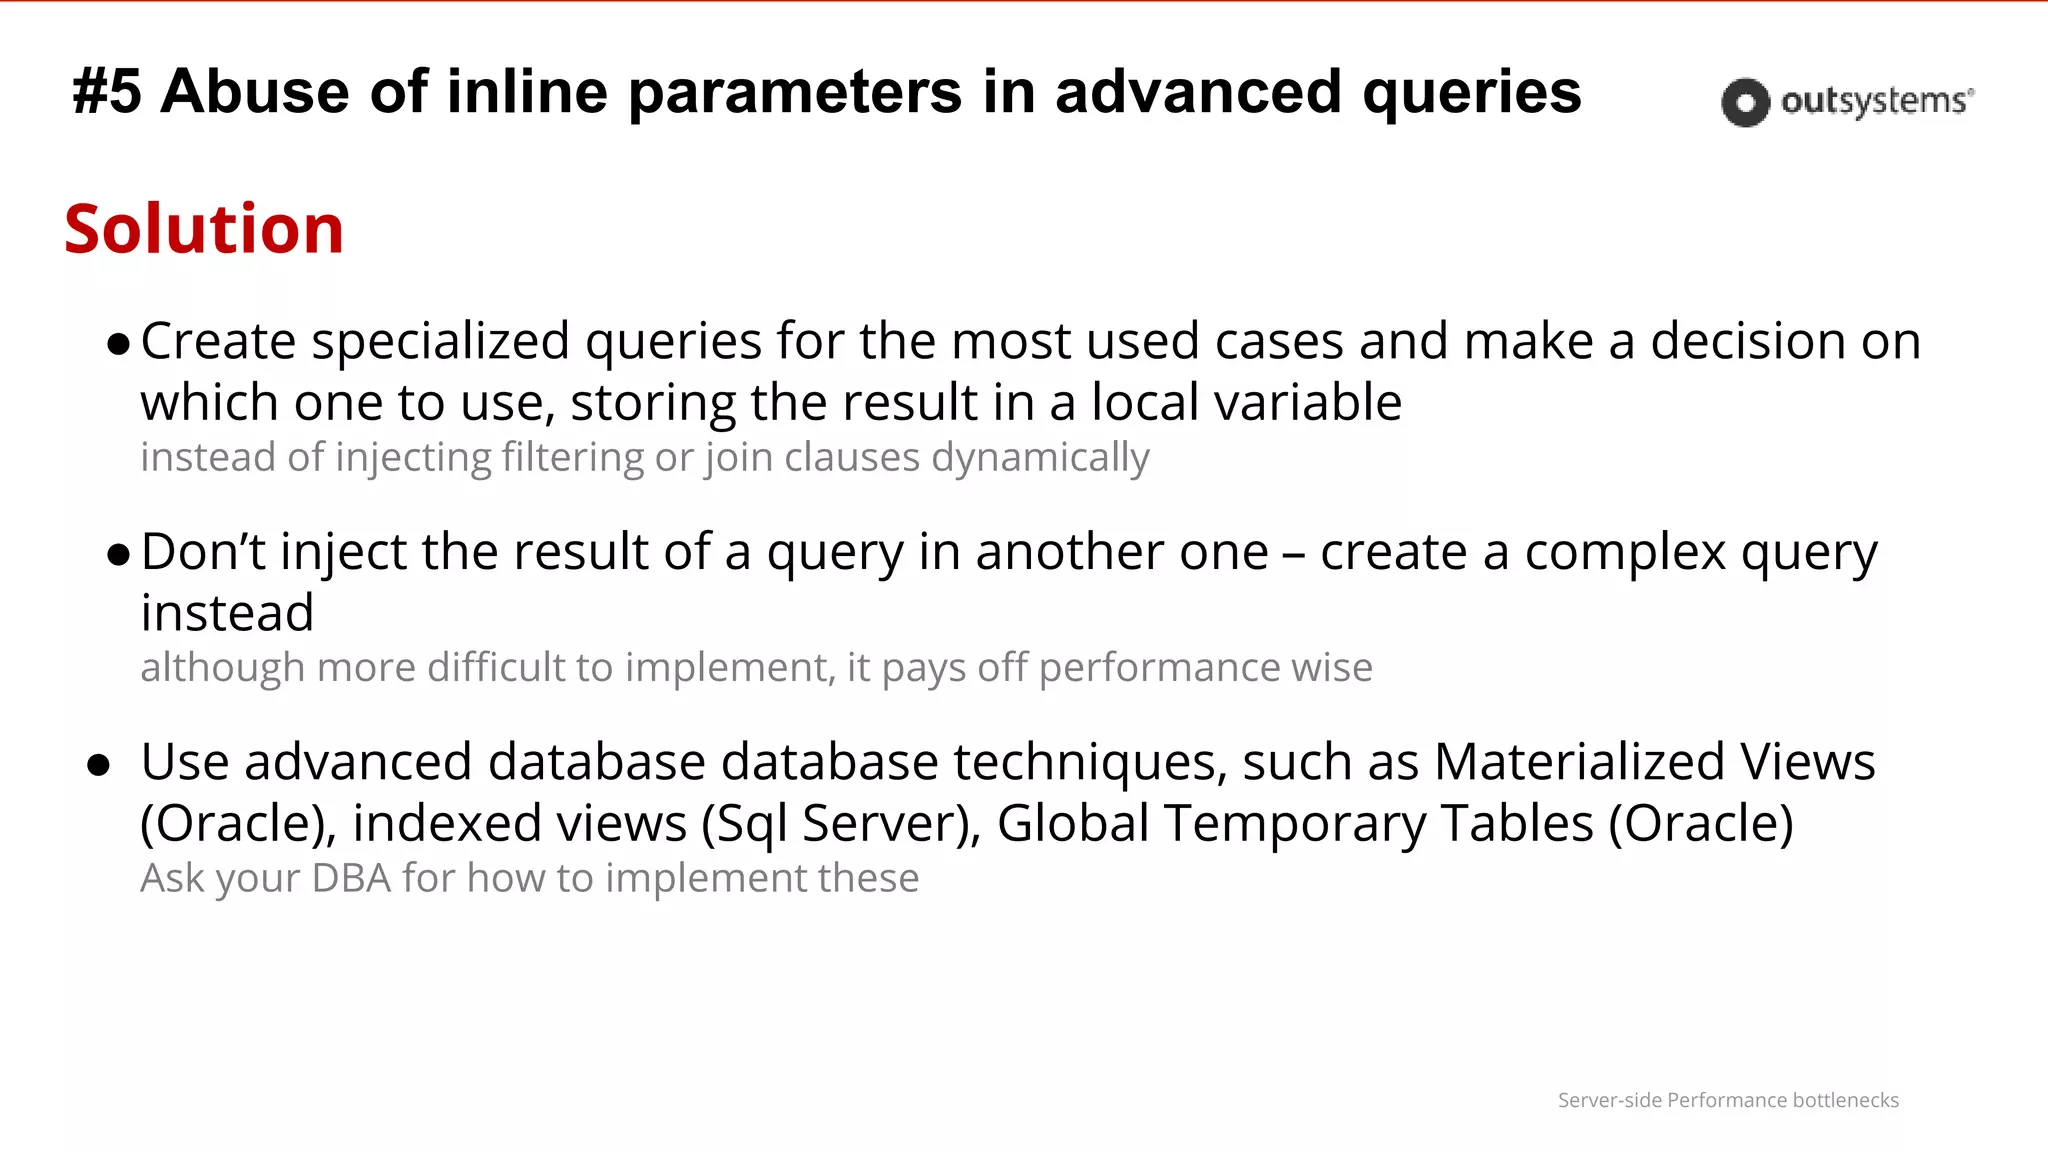
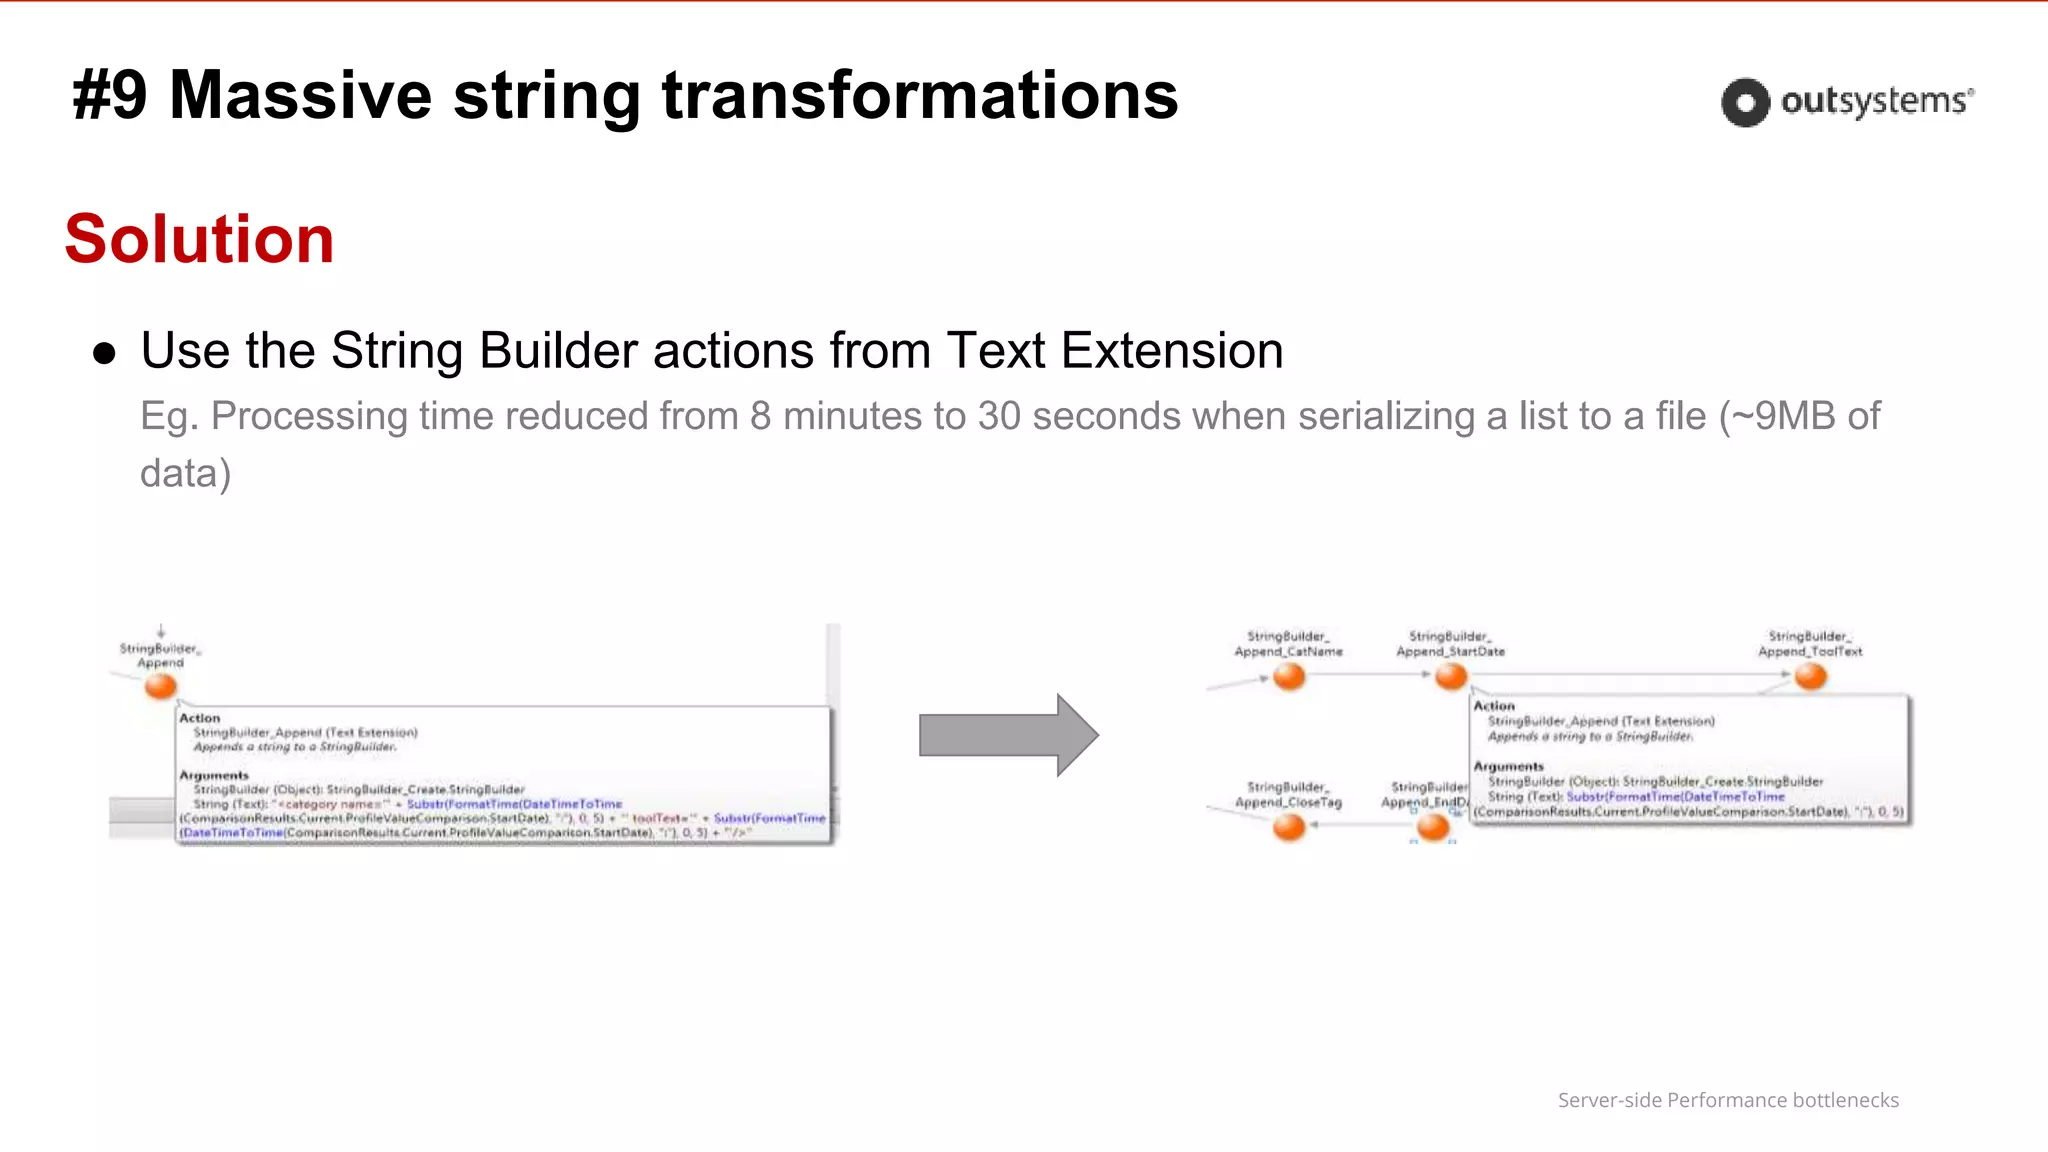
Solution
● Create a temporary table (using a WITH clause) with the list of id’s
WITH IdsTable as ( select … )
● Change the query to
where [Id] in (select id from IdsTable)
● Another advantage is not having to build the comma separated list
Inline parameter with comma separated Ids](https://image.slidesharecdn.com/webinar-detectperformancebottlenecksofapplications-160502103359/75/Training-Webinar-Detect-Performance-Bottlenecks-of-Applications-53-2048.jpg)

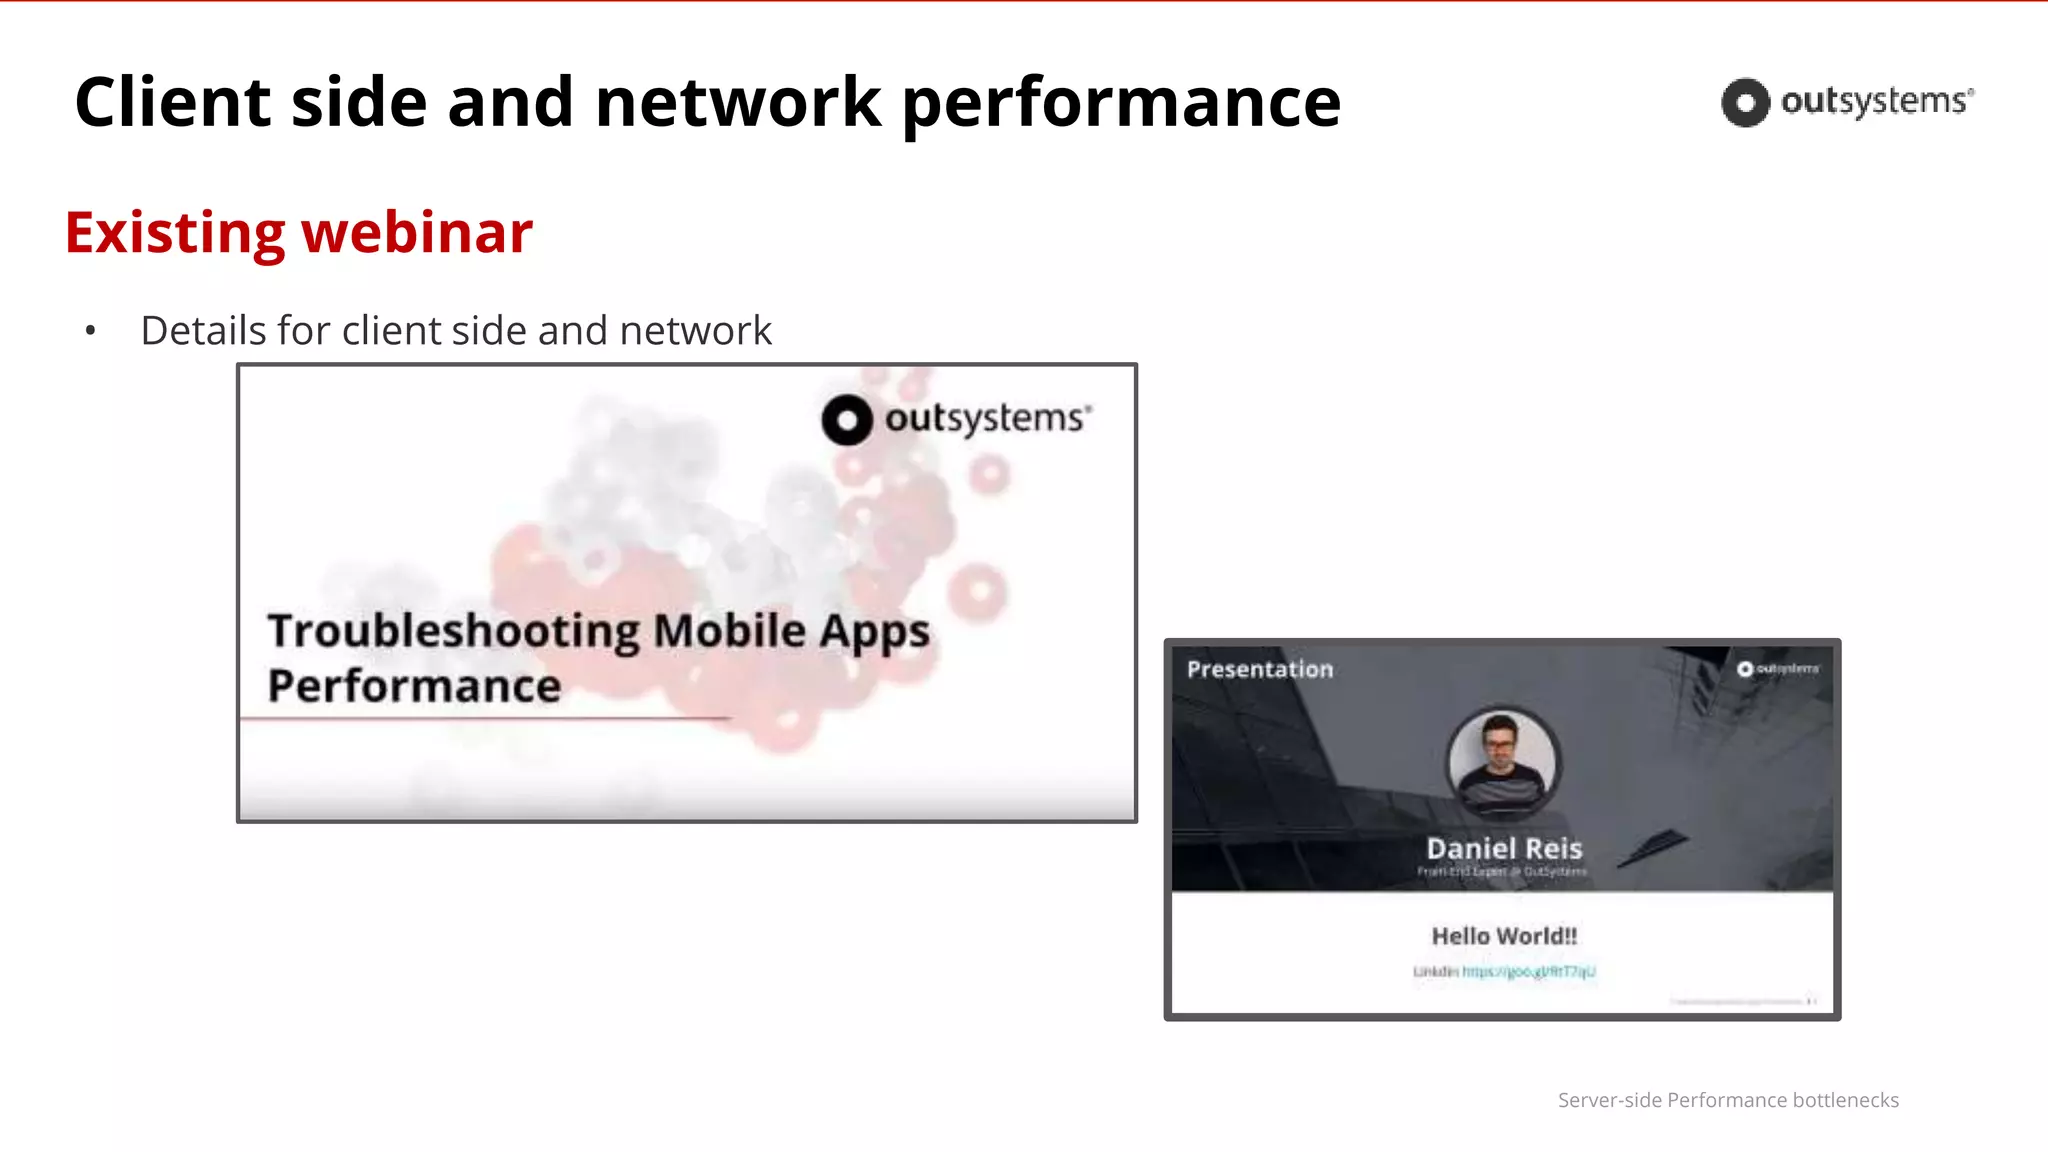
The document outlines a webinar hosted by Paulo Garrudo on server-side performance bottlenecks in web applications, detailing important aspects like performance monitoring, measuring elapsed times, and identifying best practices to improve efficiency. It emphasizes the challenges developers face in troubleshooting slow applications and provides insights into tools and logs available within the OutSystems platform to help gauge performance. Additionally, it lists the top ten worst practices that can hinder application performance and offers solutions for optimizing server-side operations.
Introduction to server-side performance bottlenecks with an overview of the webinar and speaker.
Agenda overview focusing on performance metrics and the challenges of achieving fast response times.
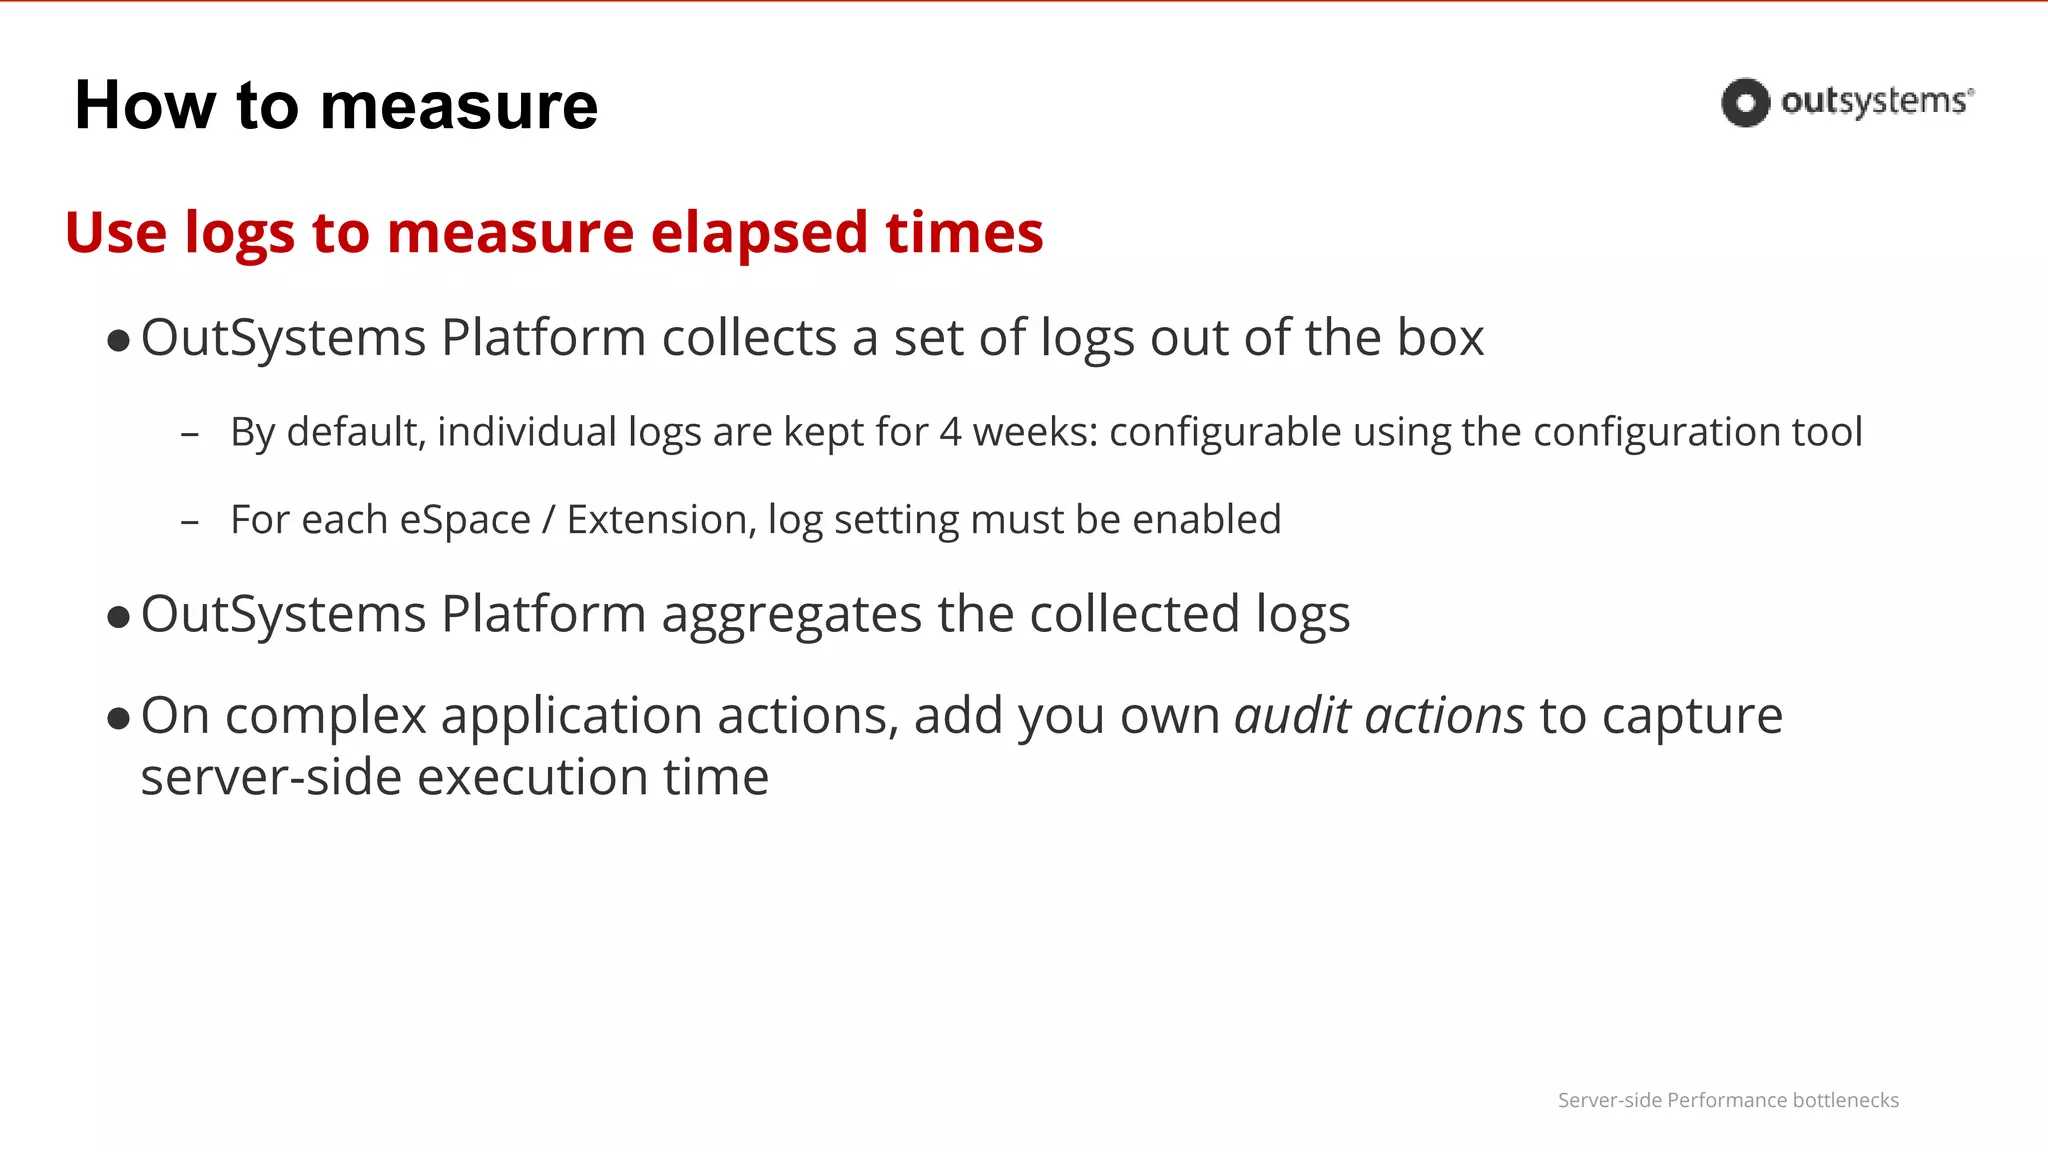
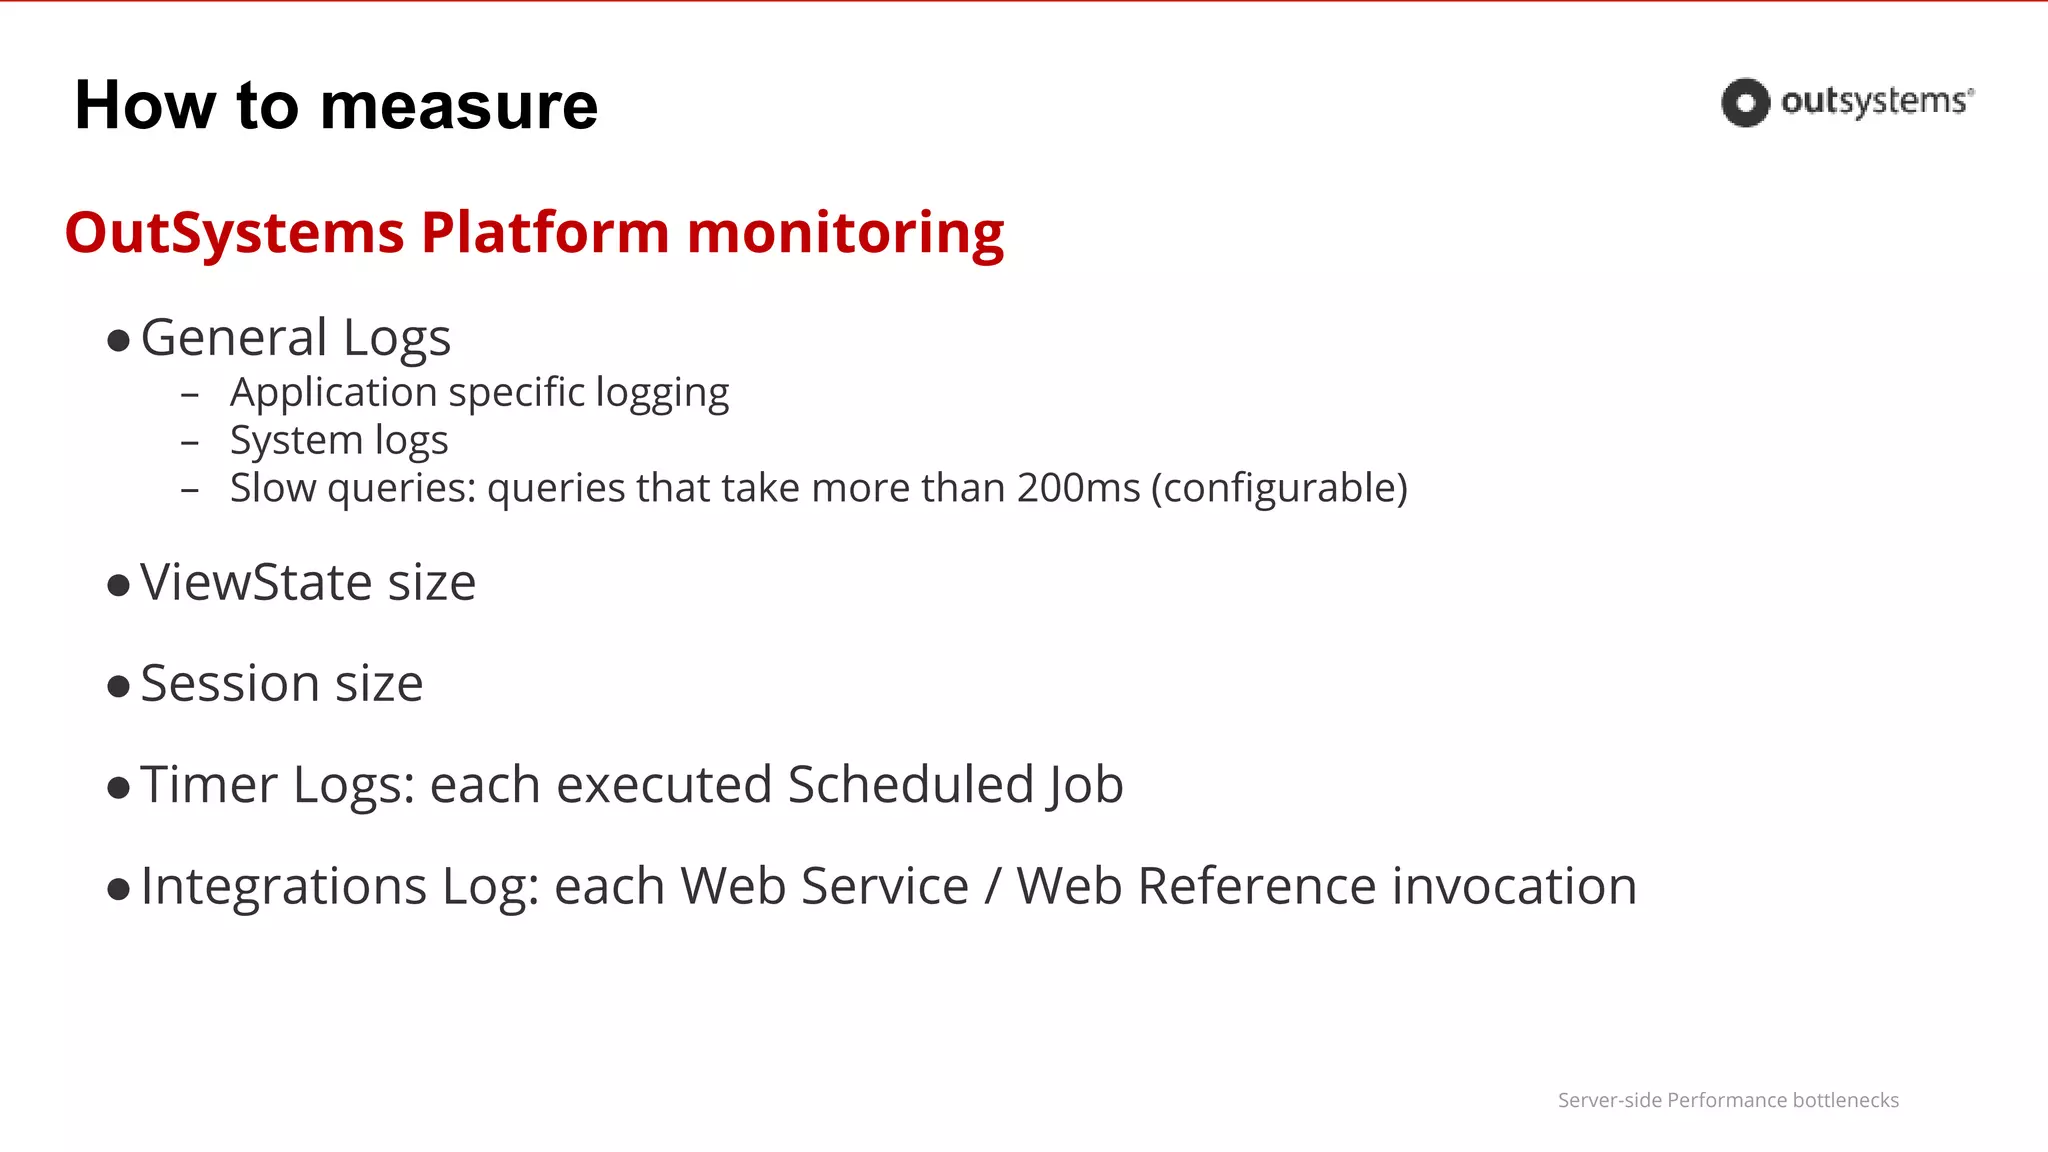
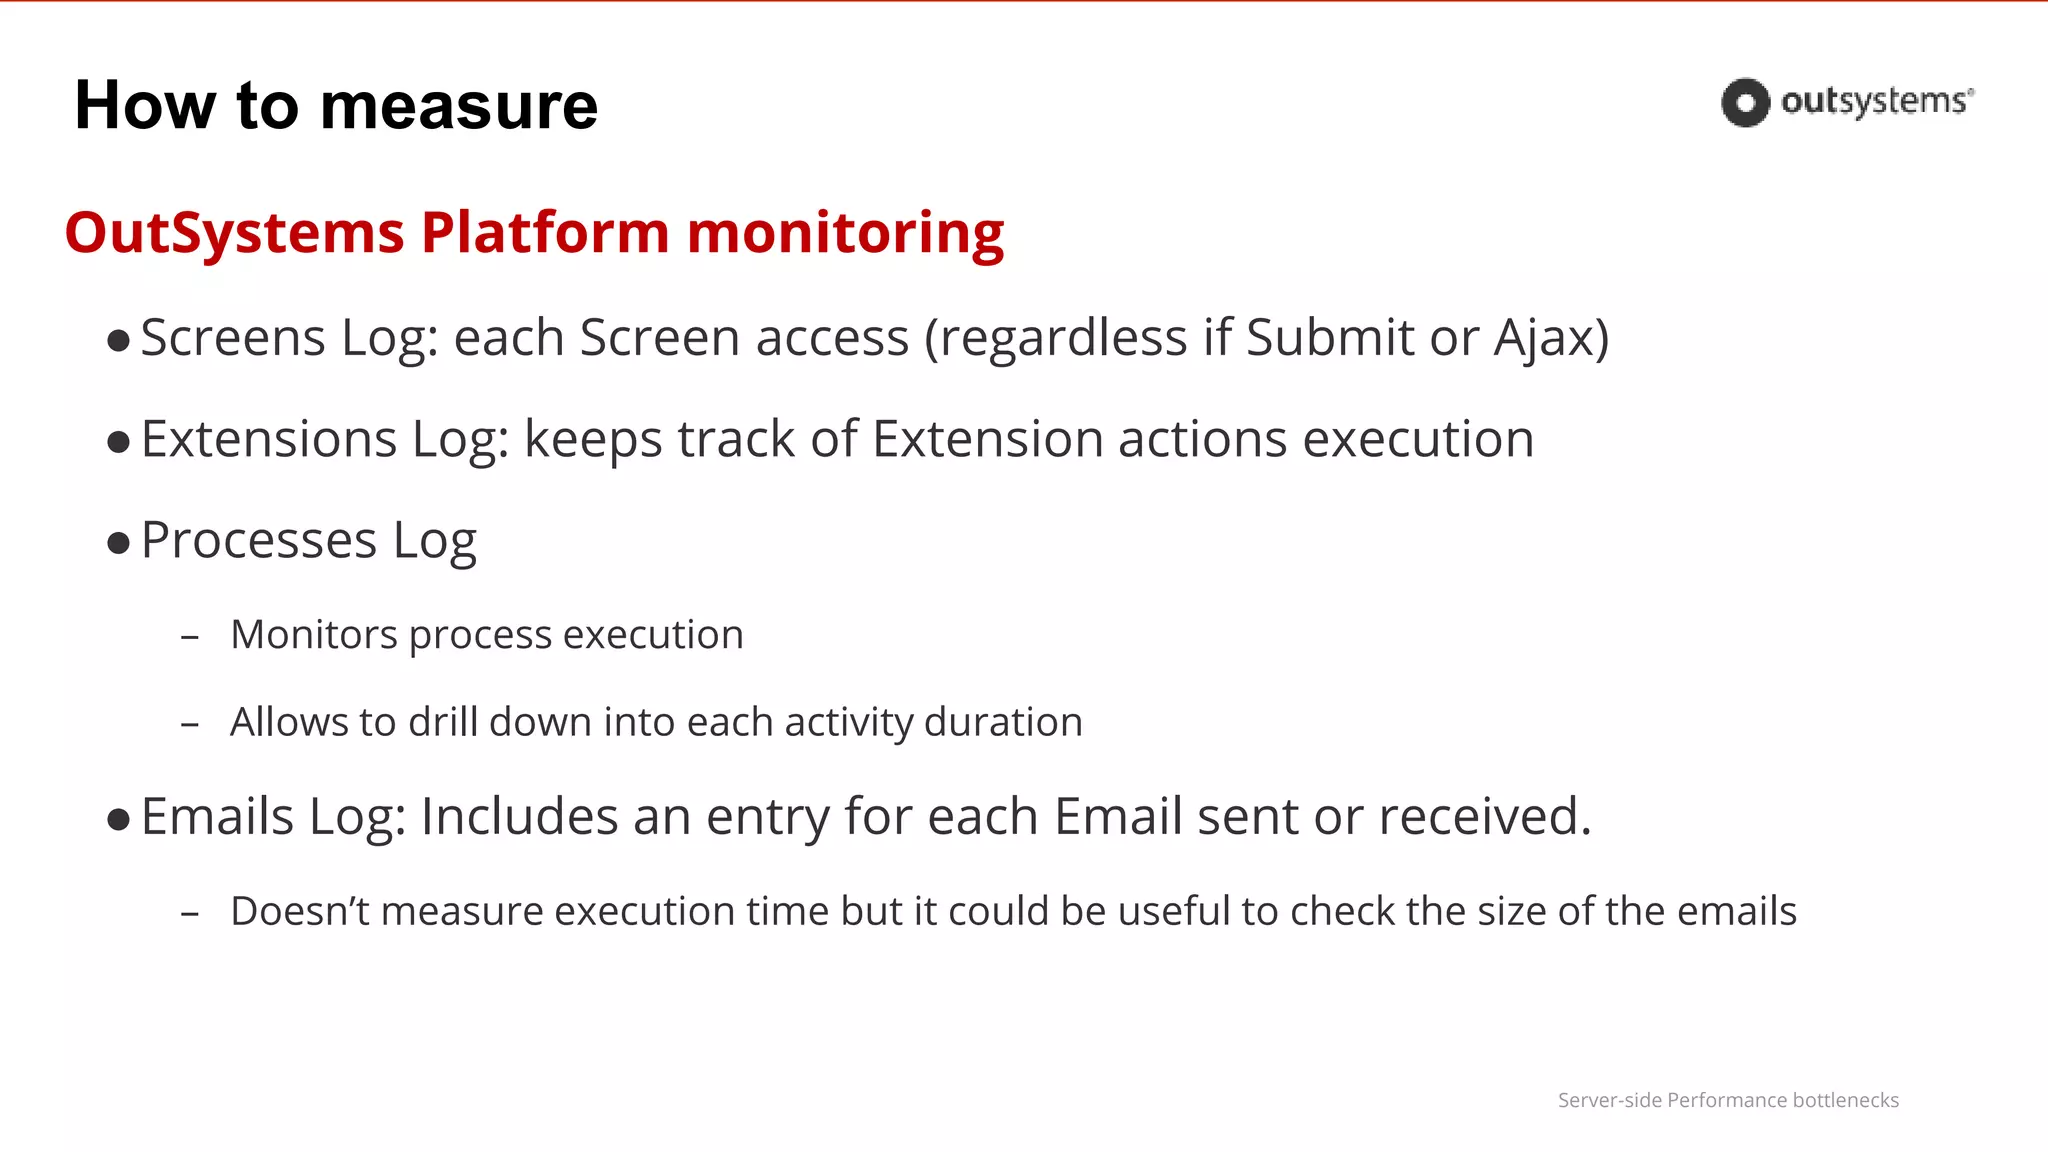
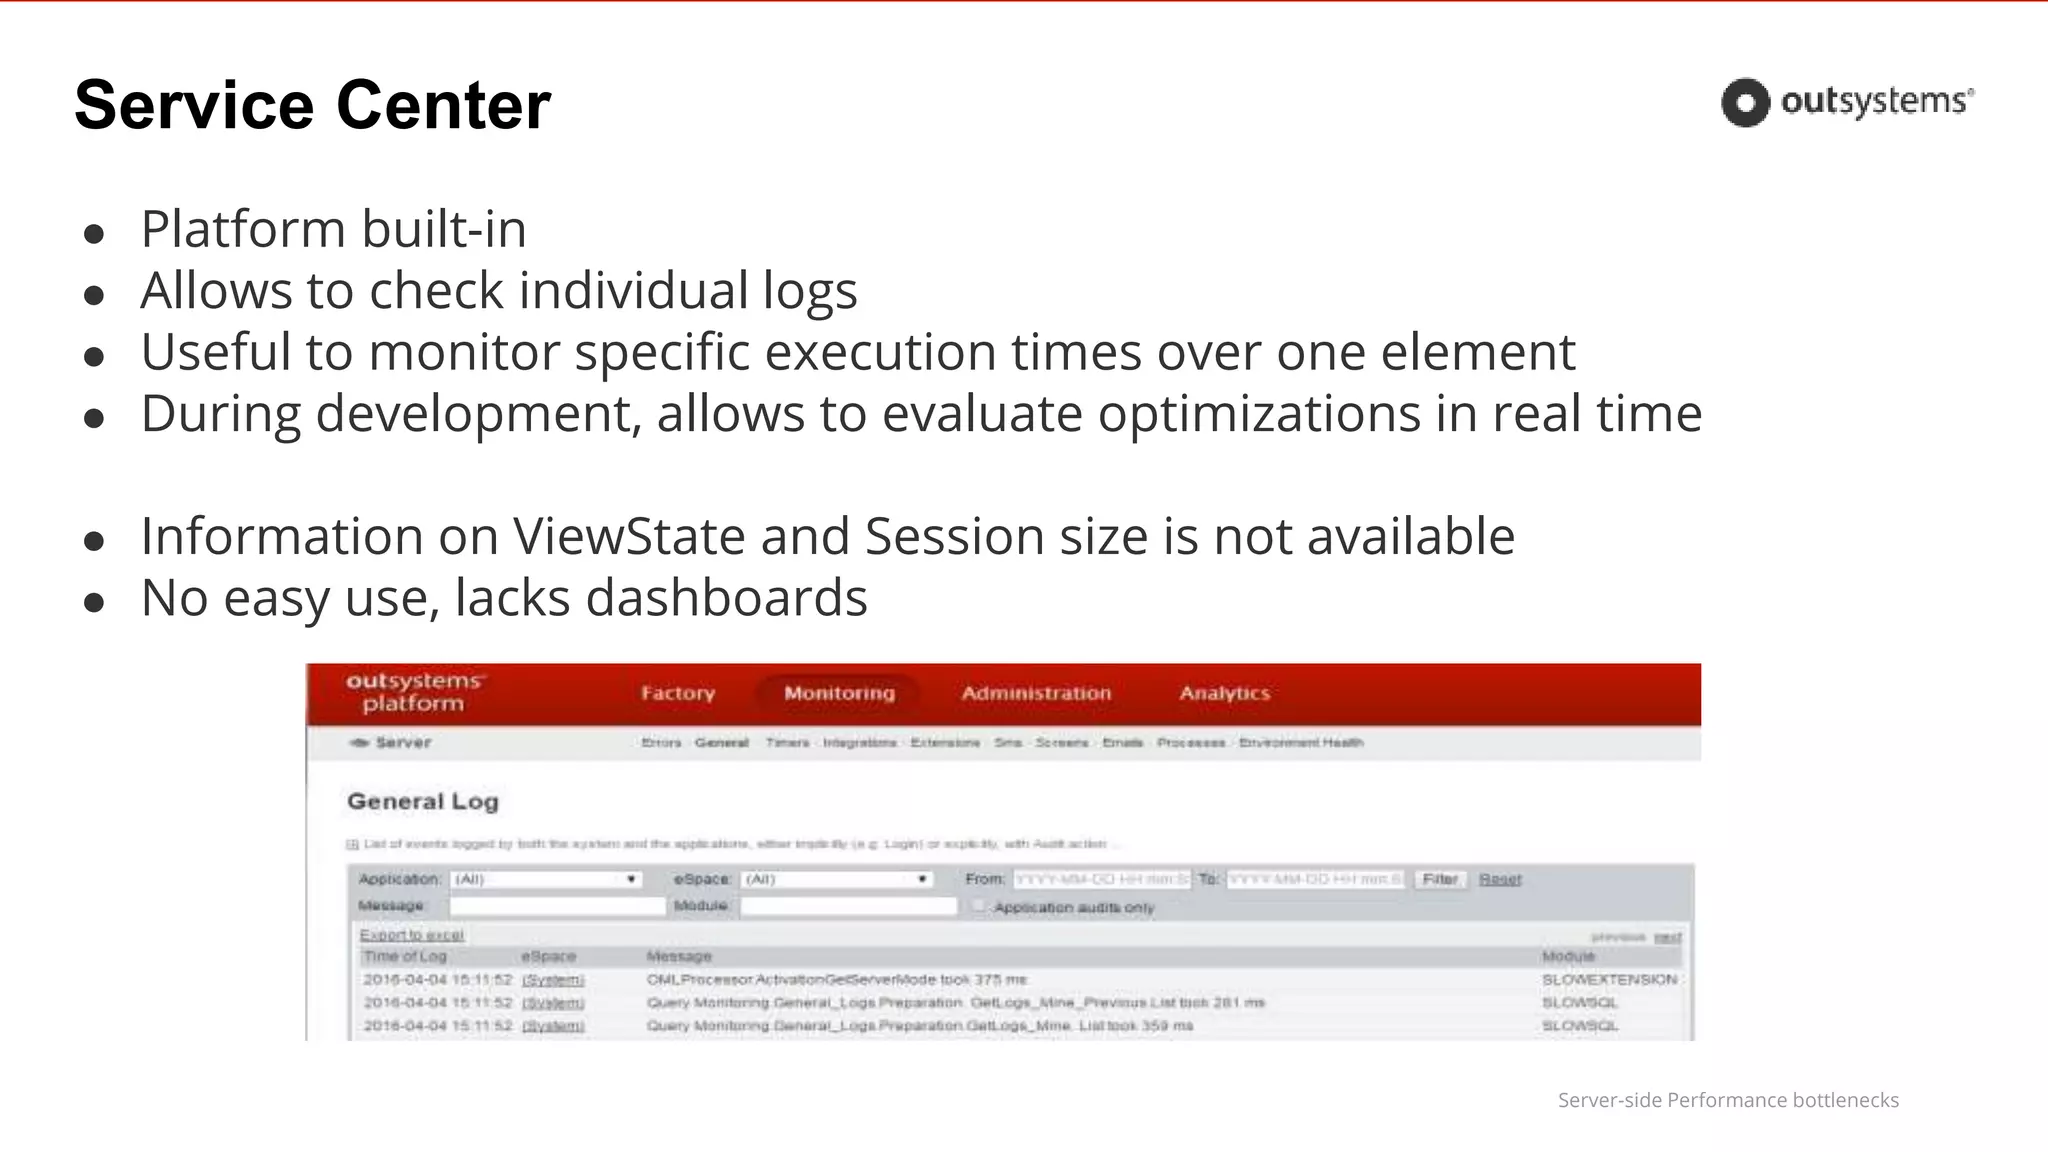
Explanation of how to measure performance using OutSystems logs, including types and specific log settings.
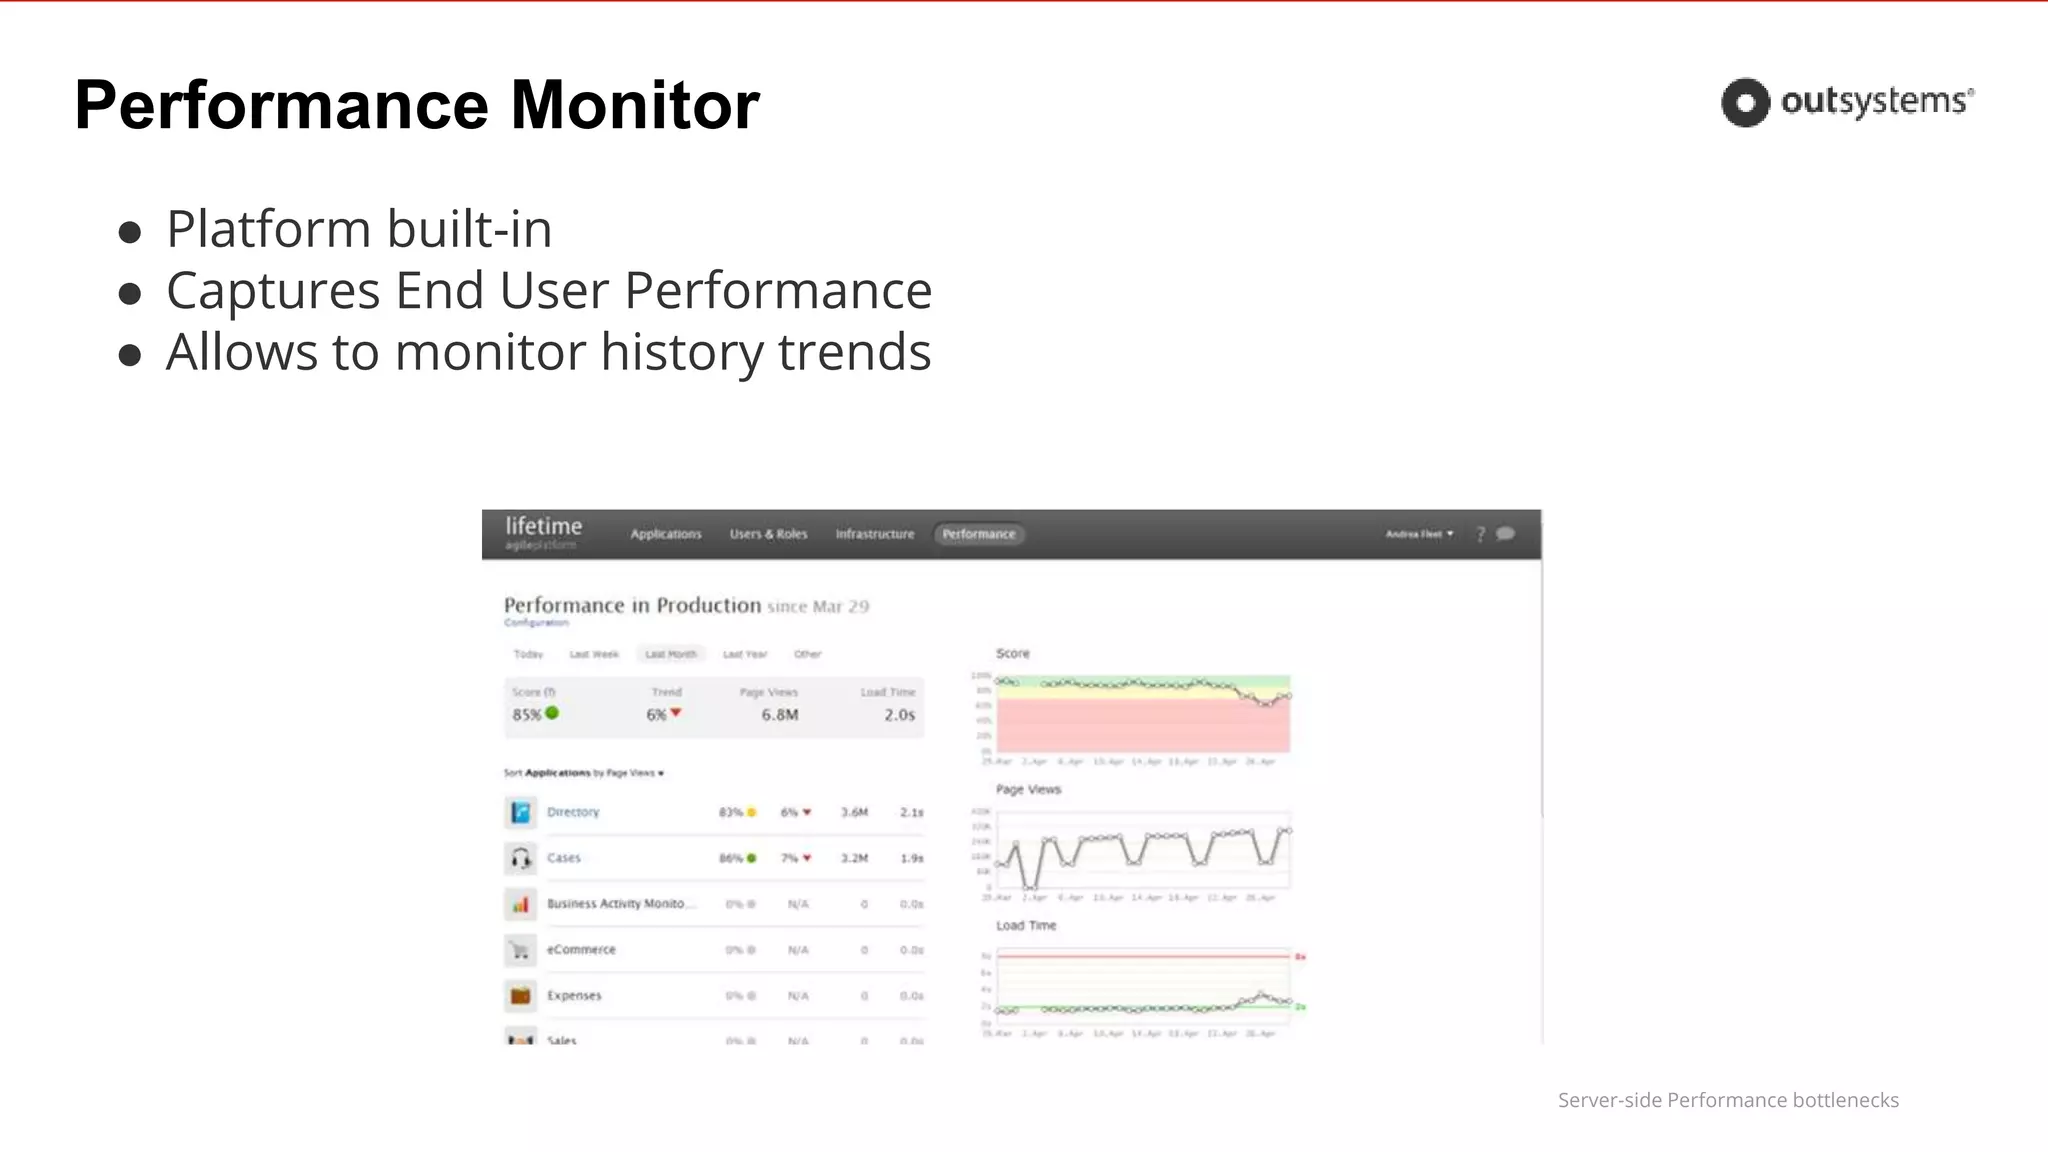
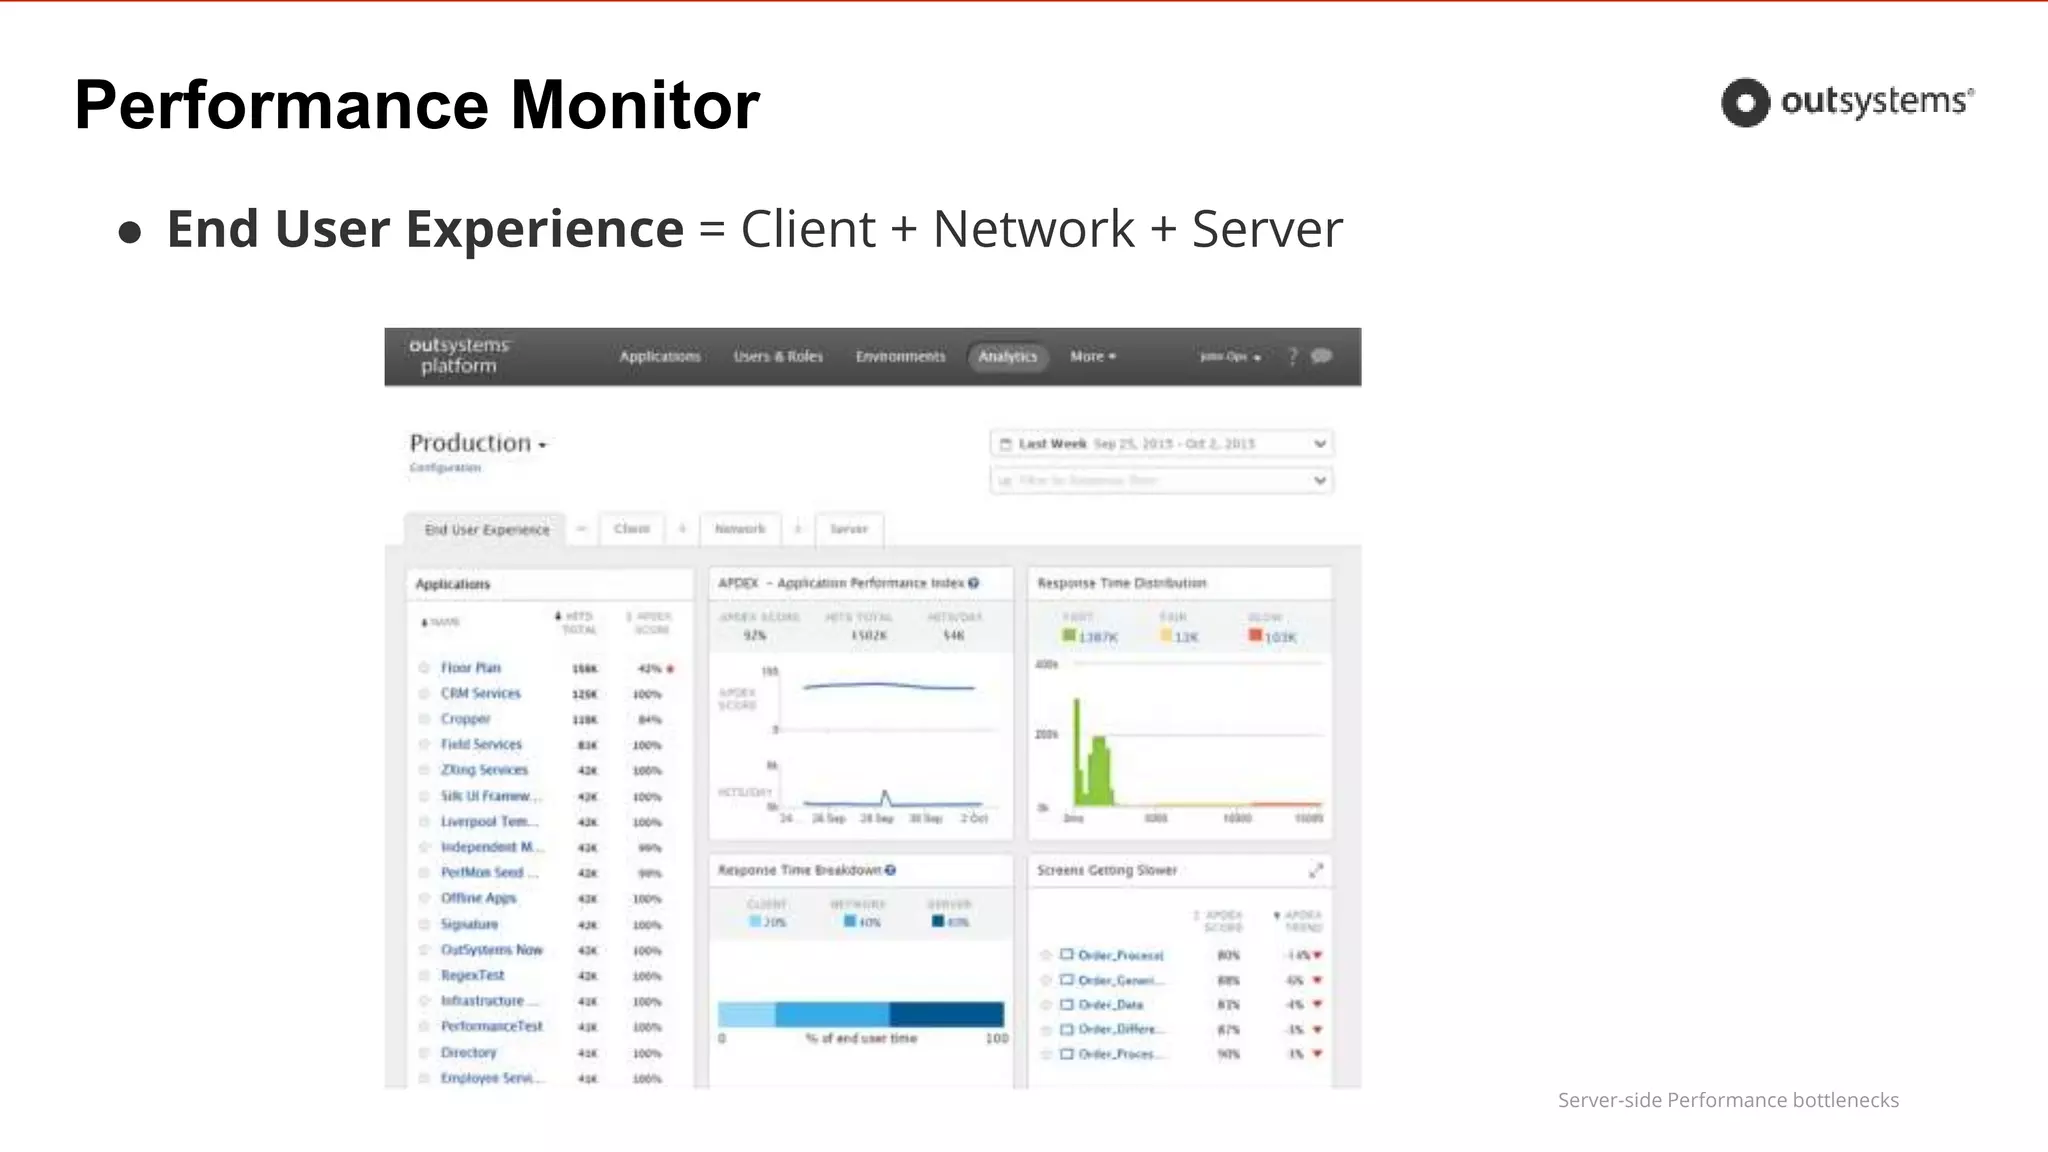
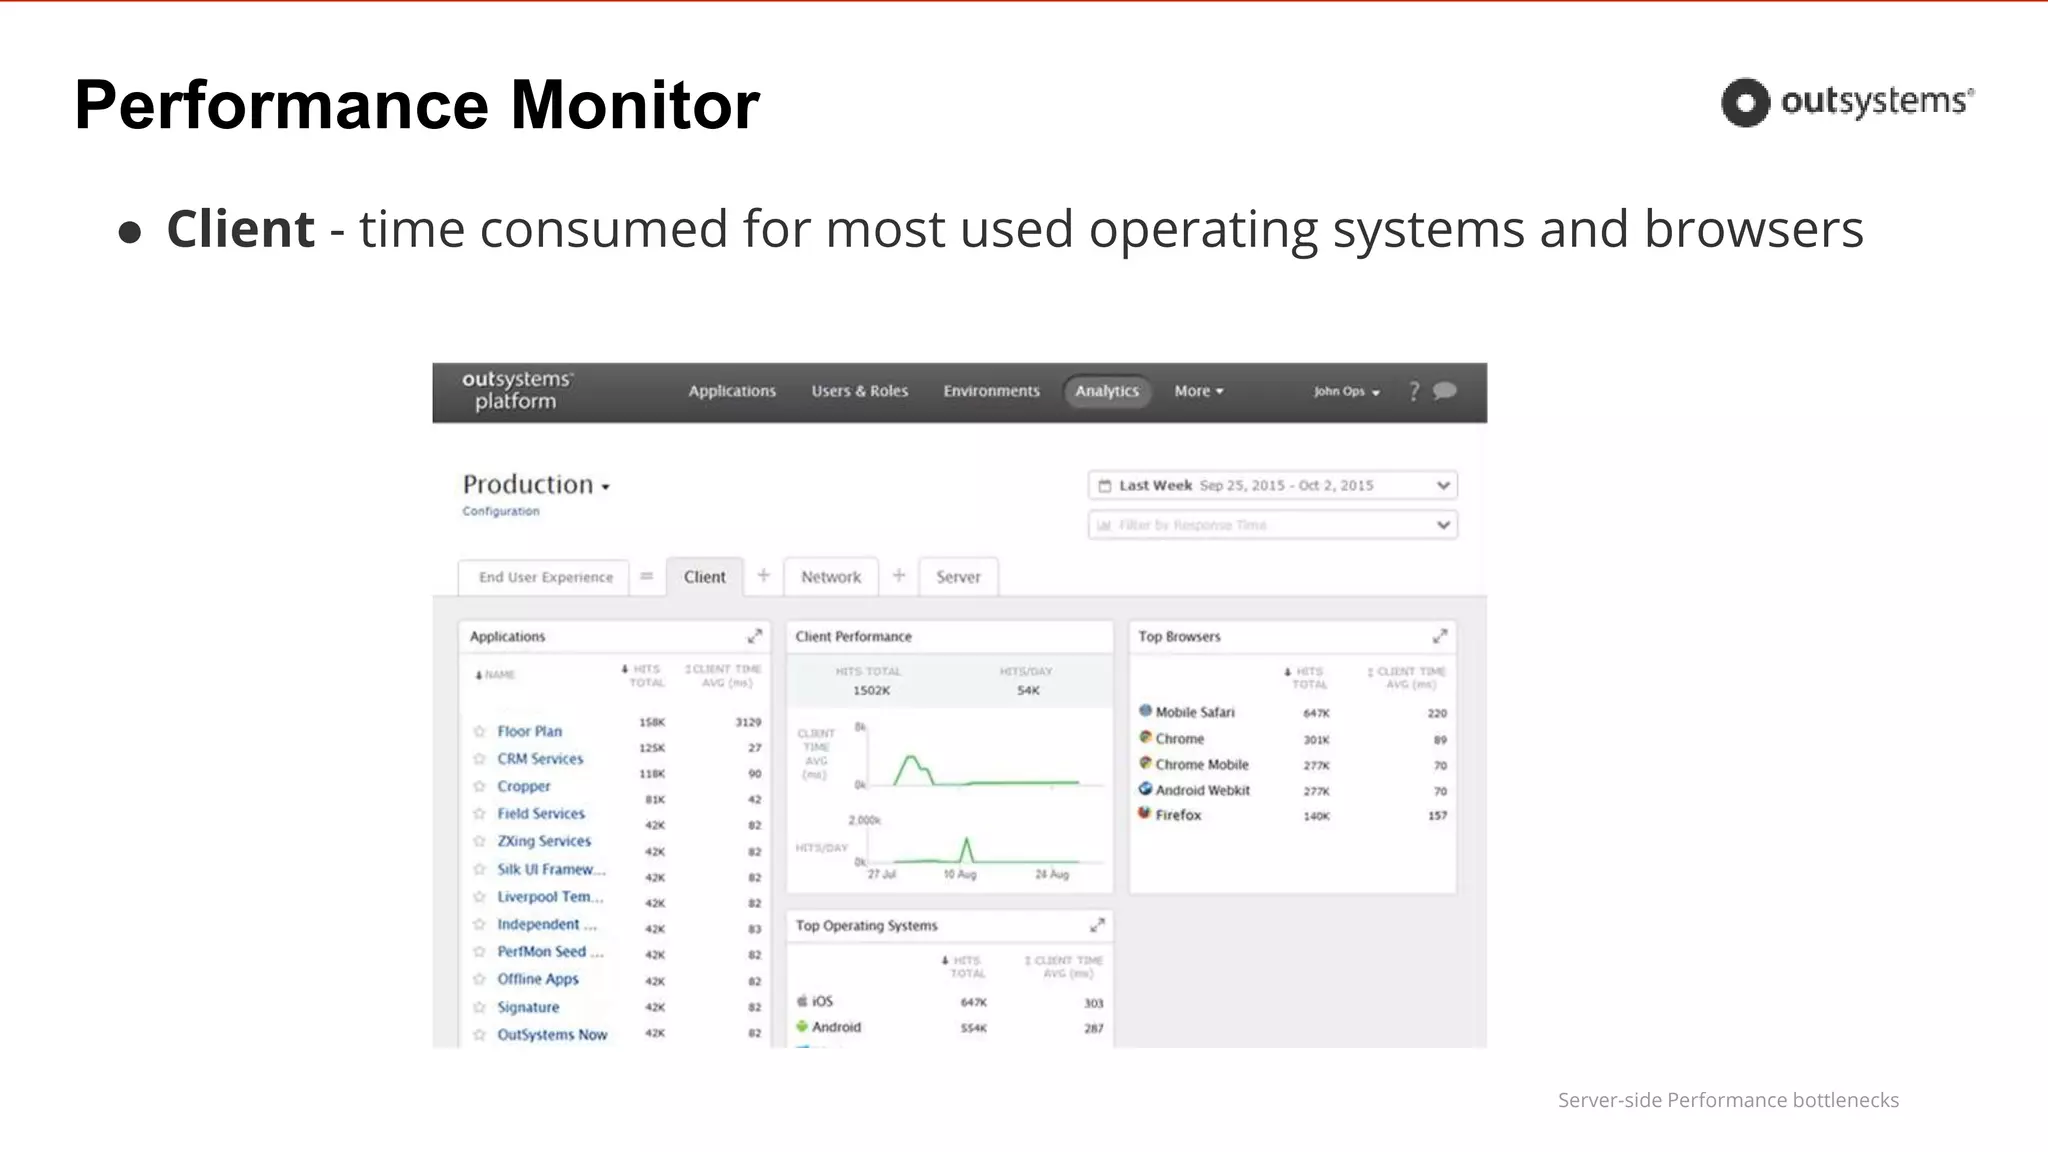
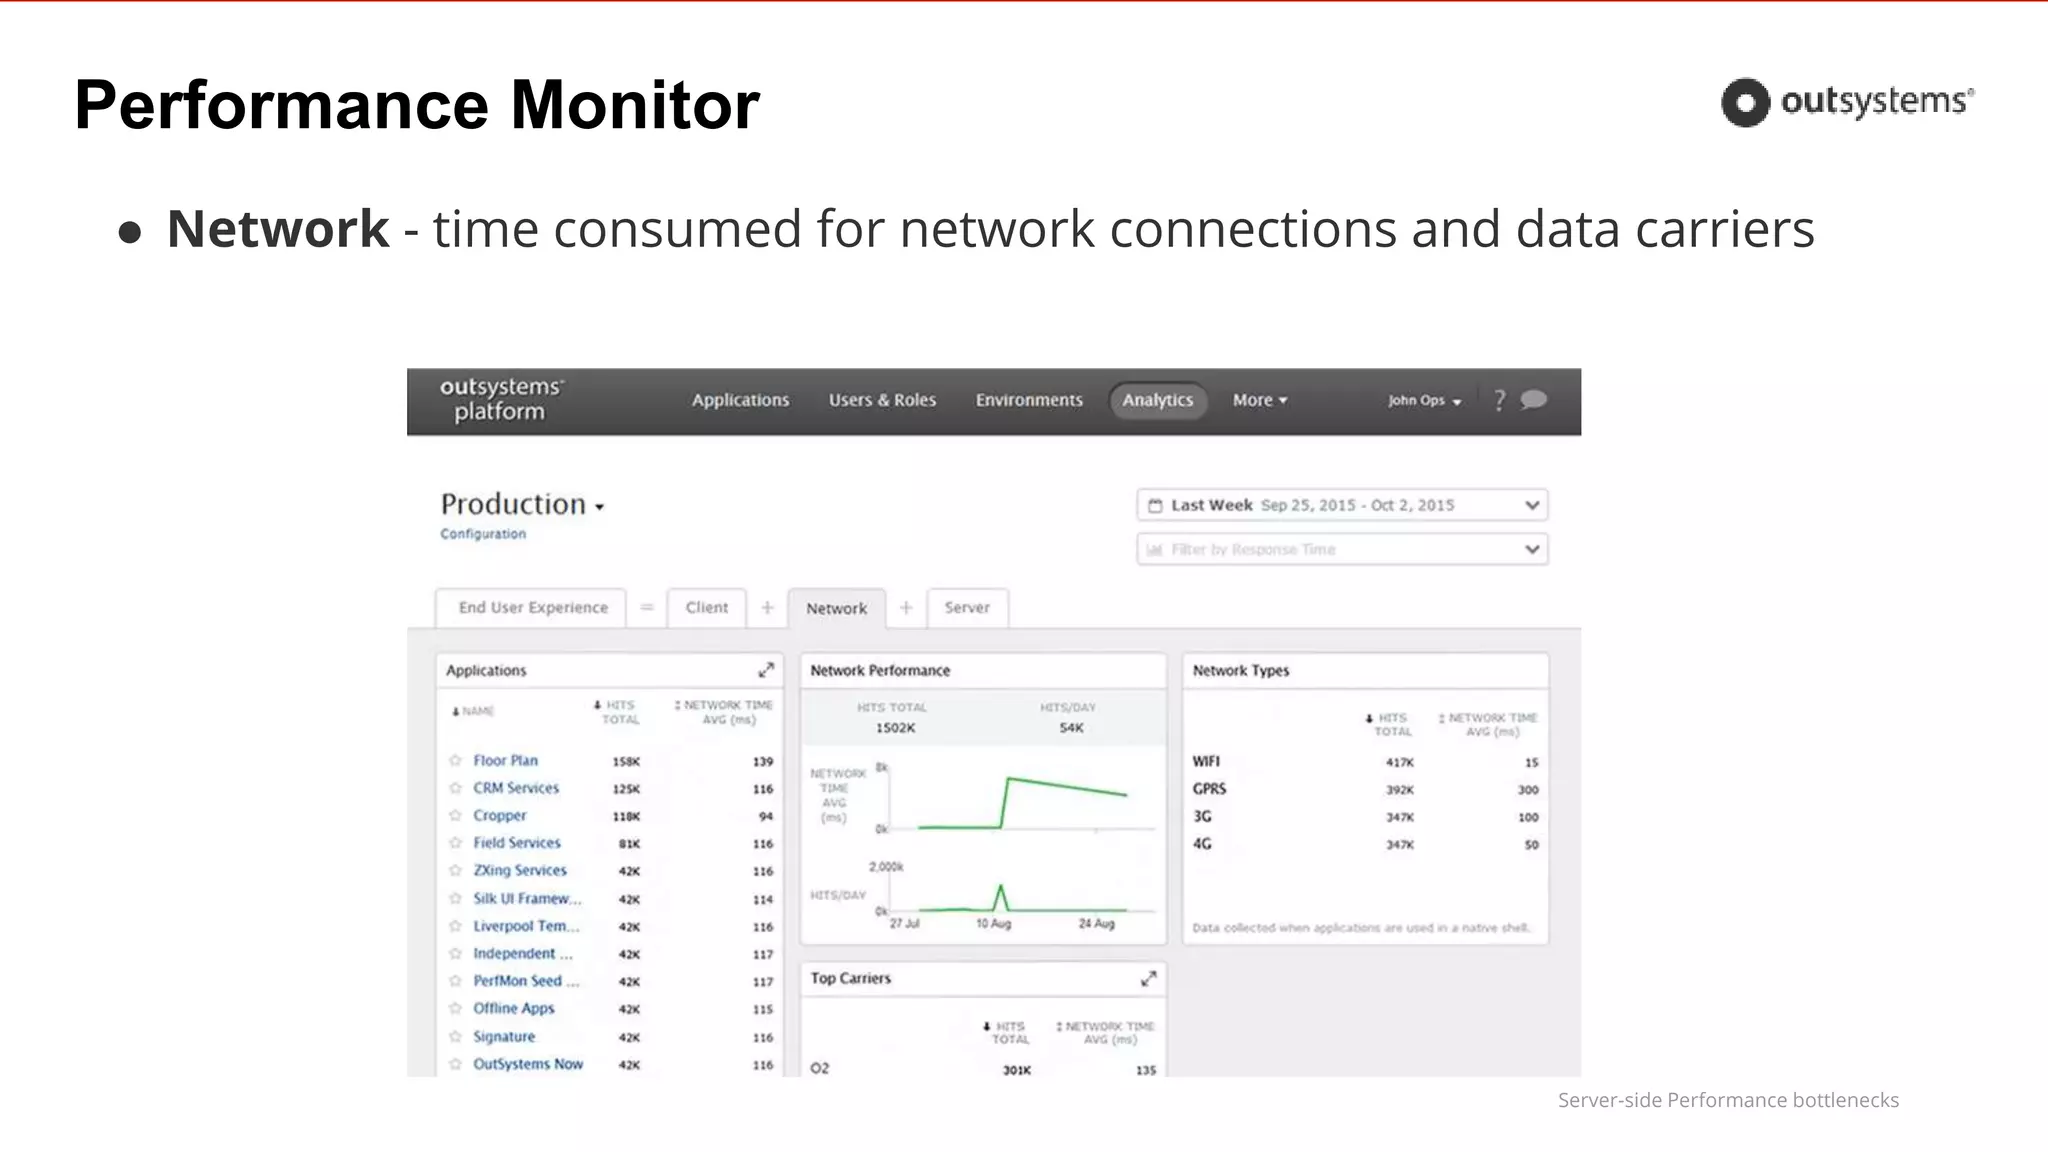
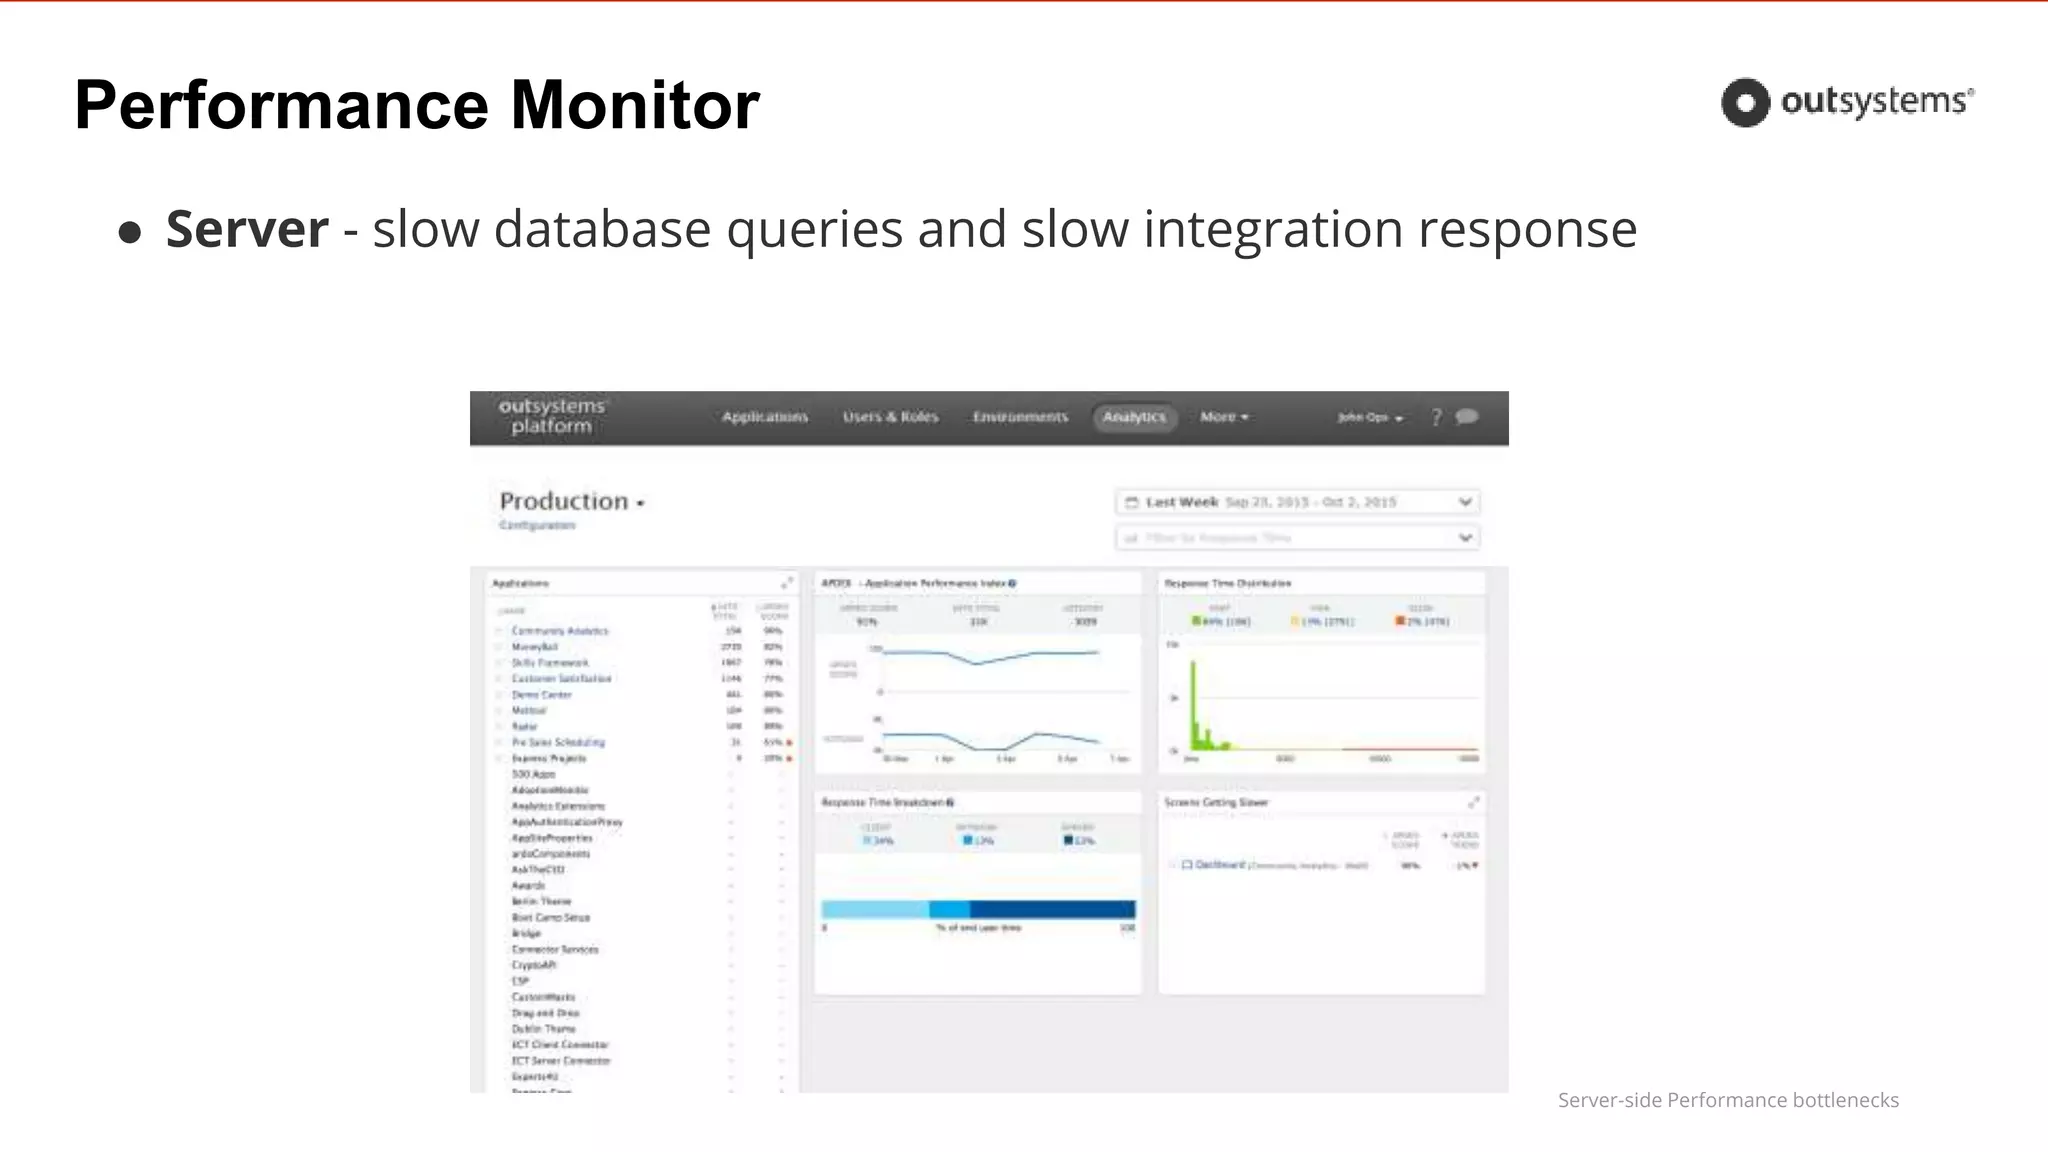
Description of various monitoring tools like Performance Monitor and Performance CSI to track application performance.
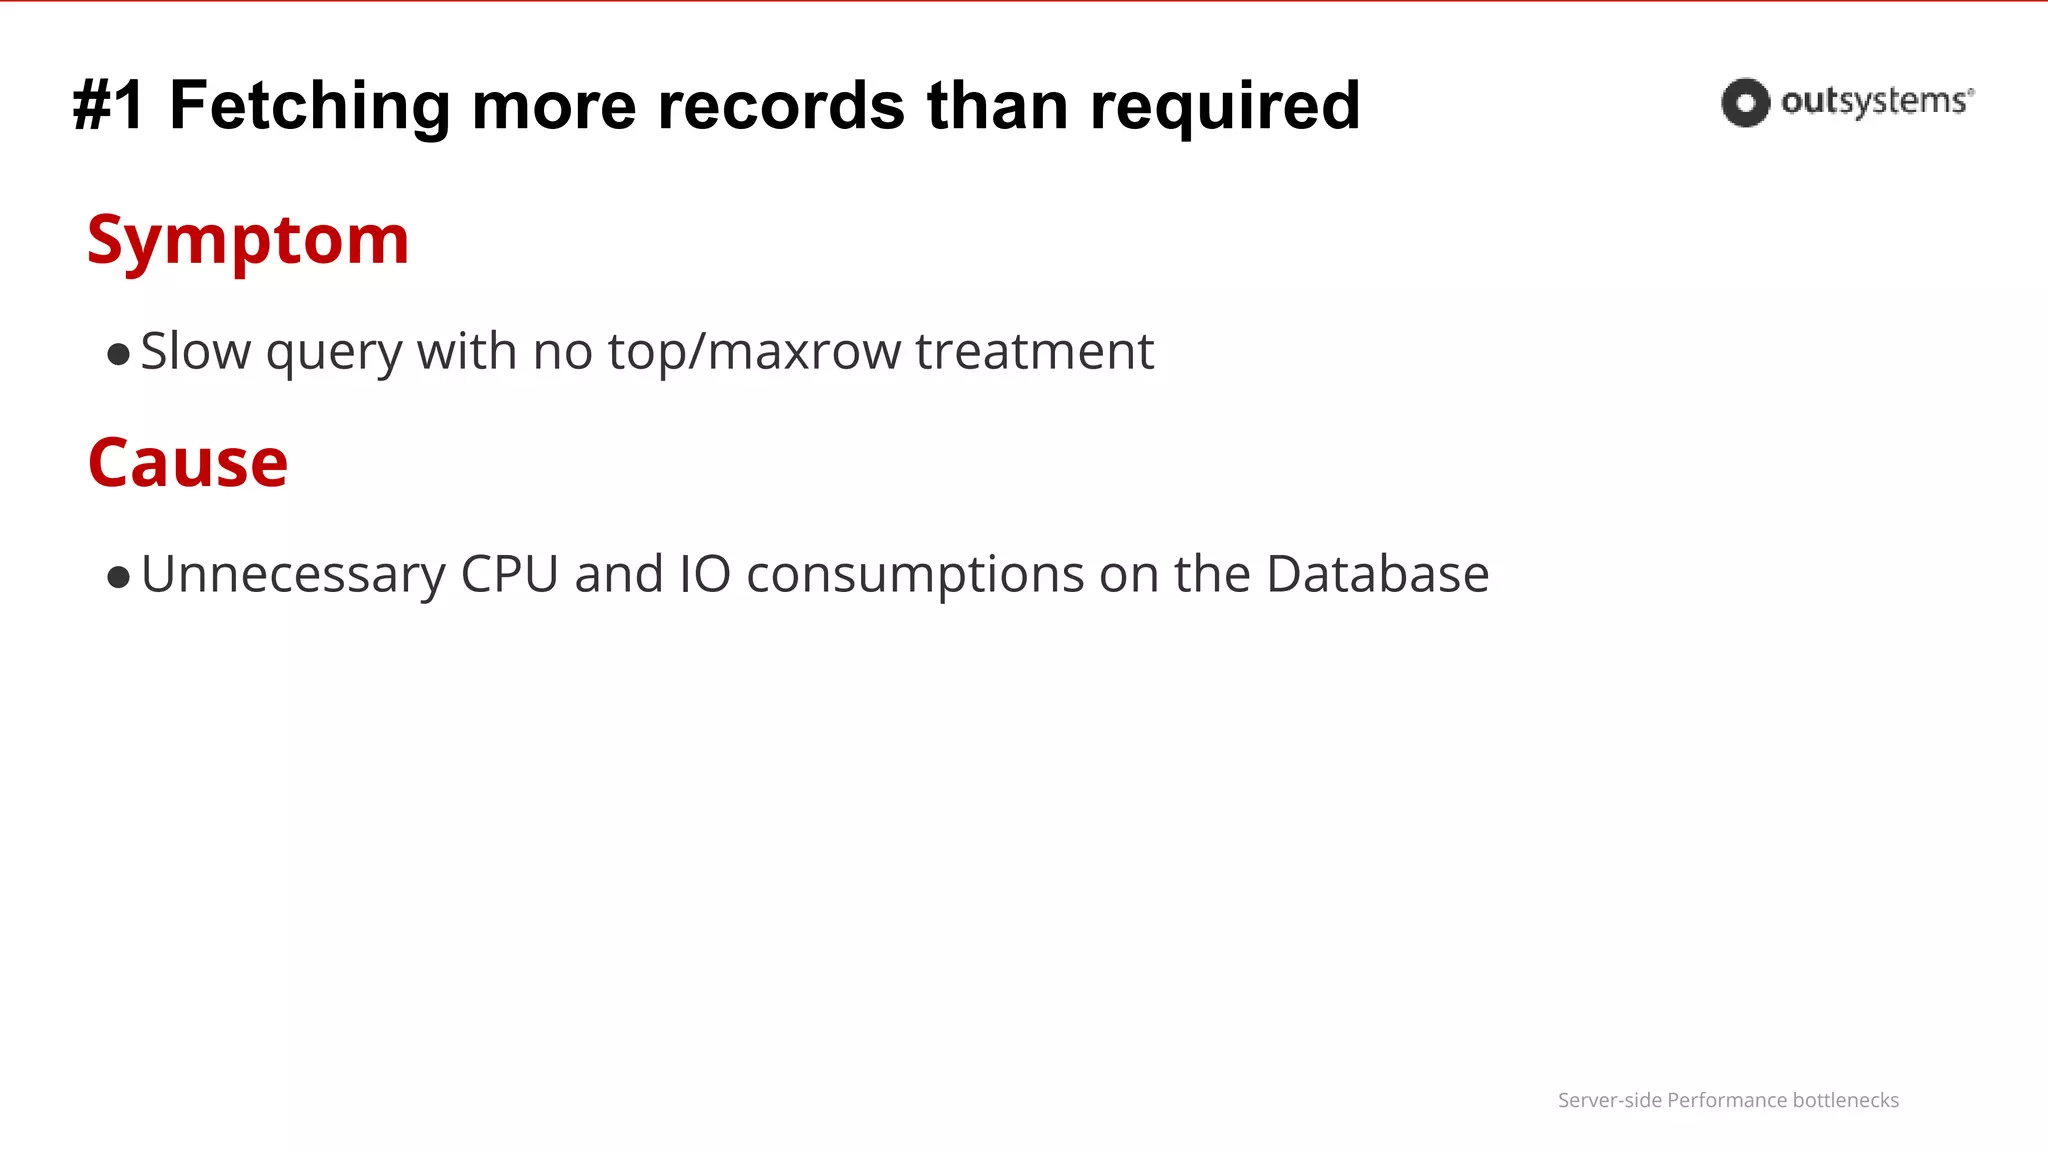
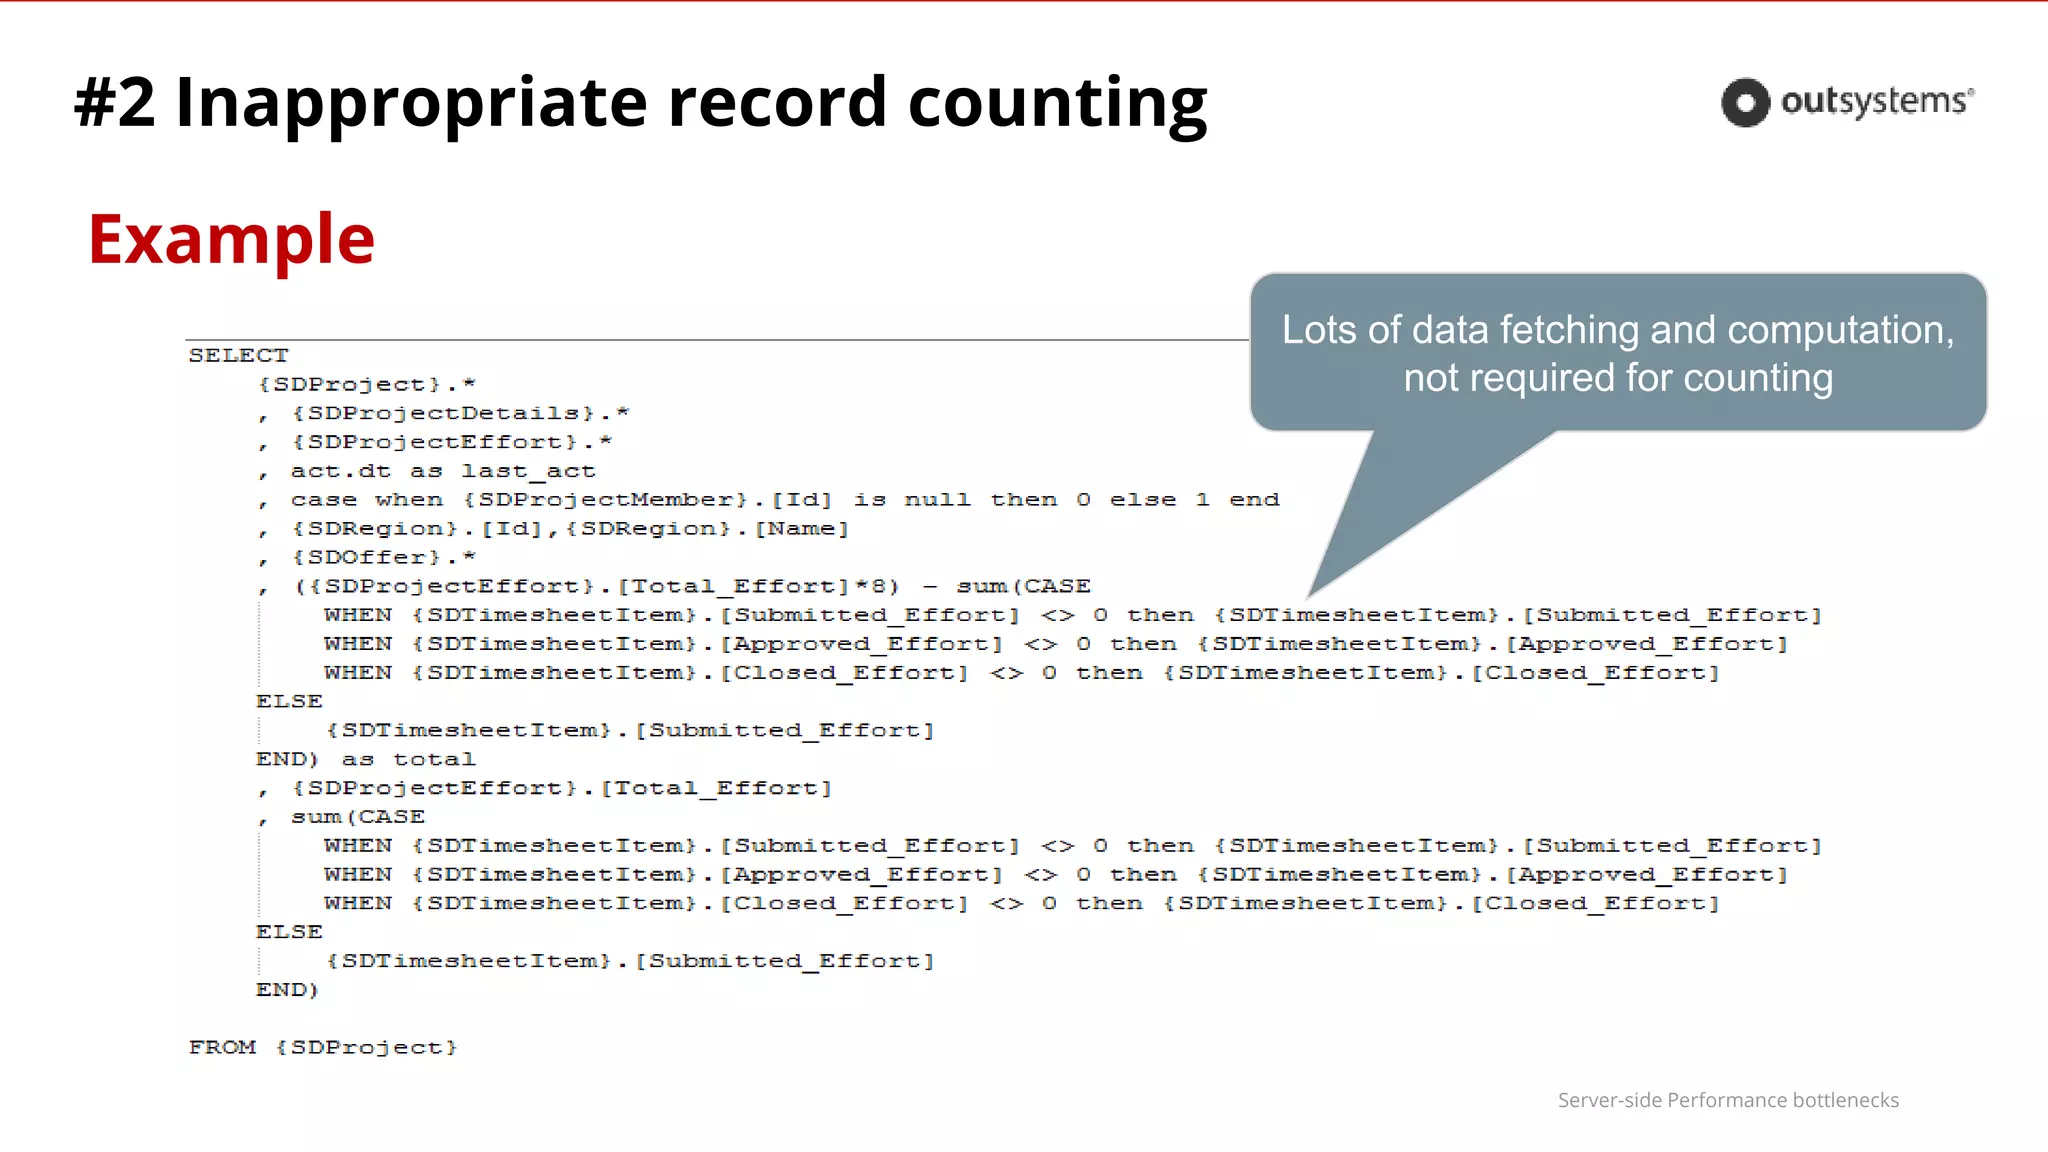
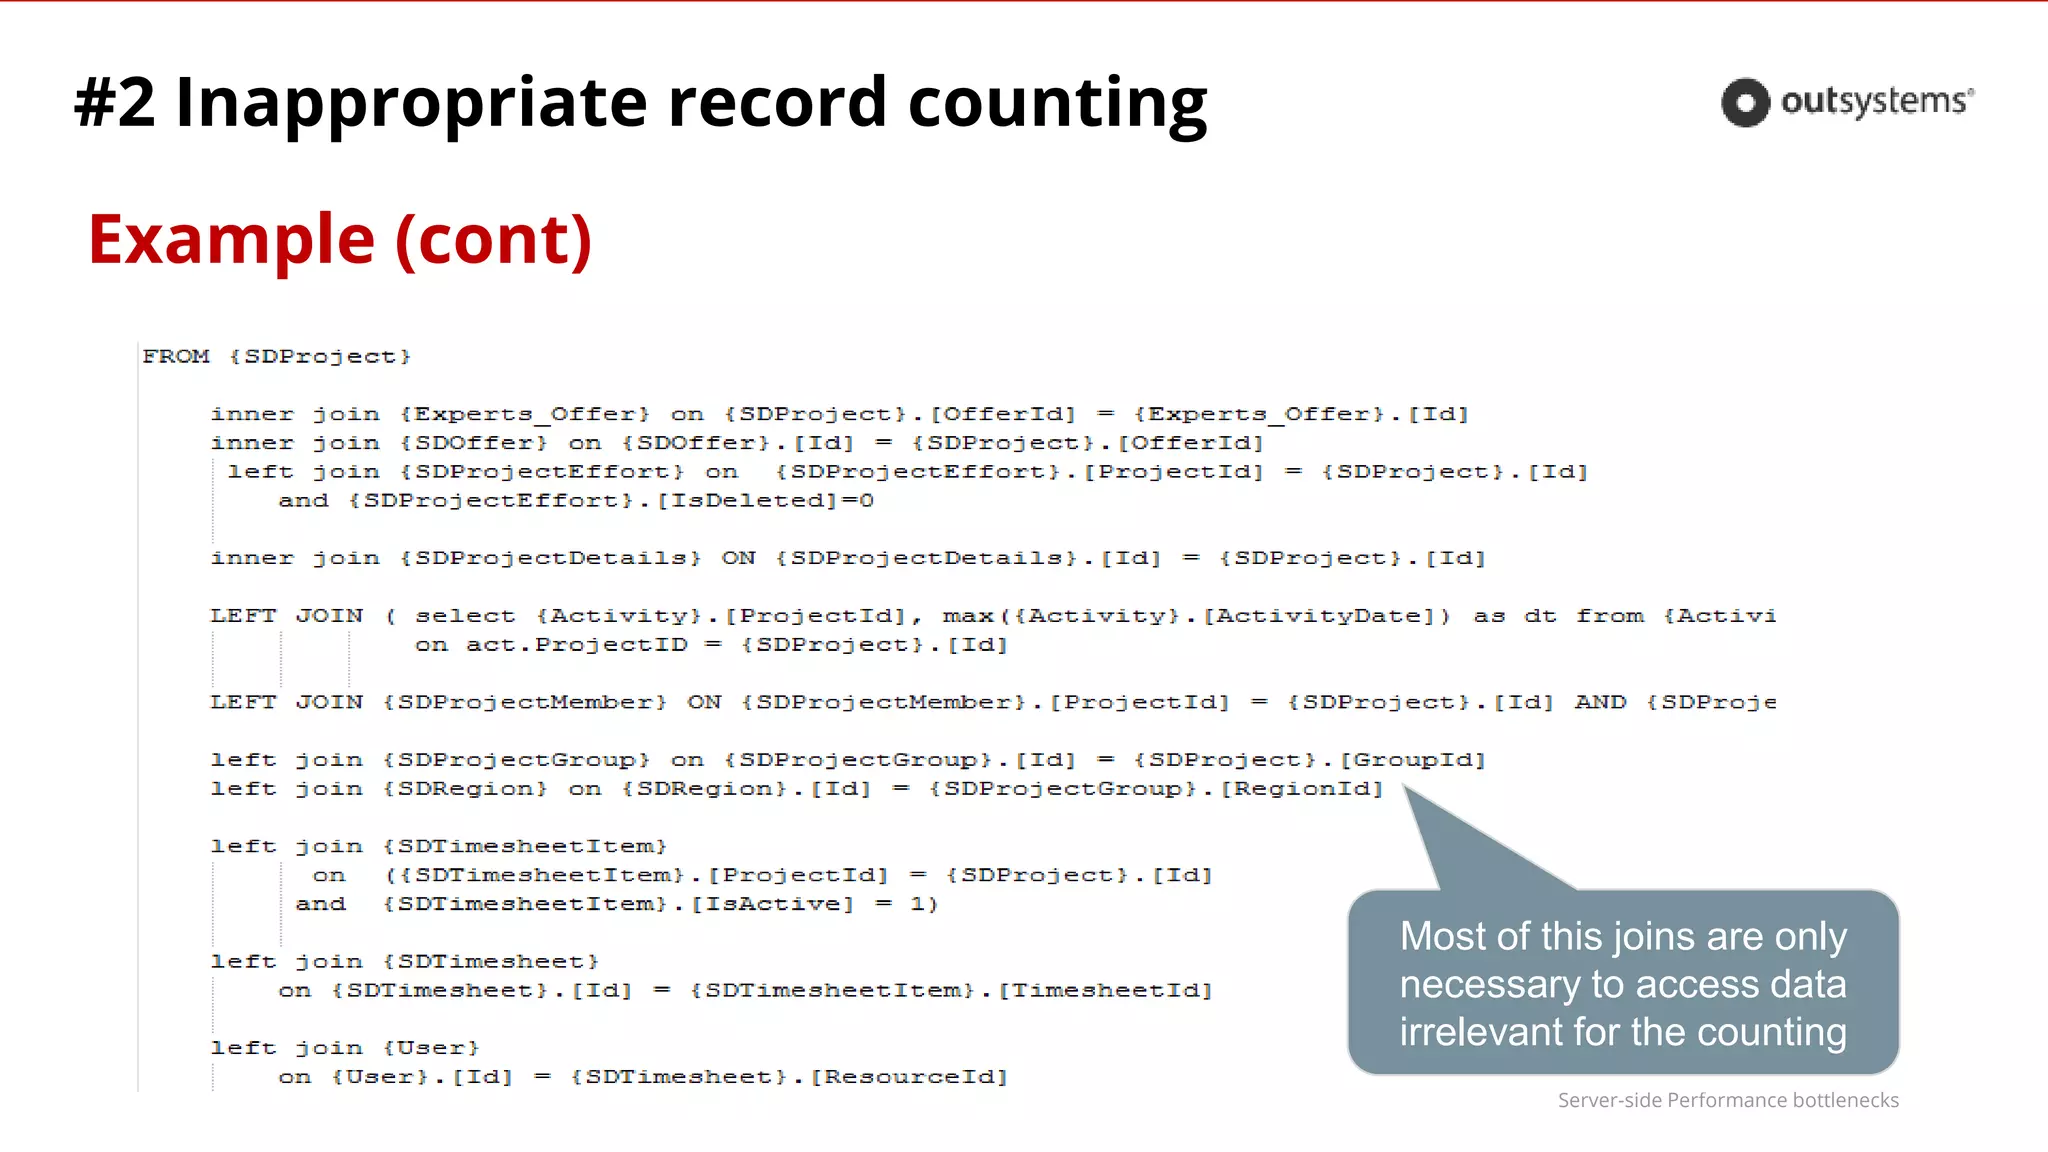
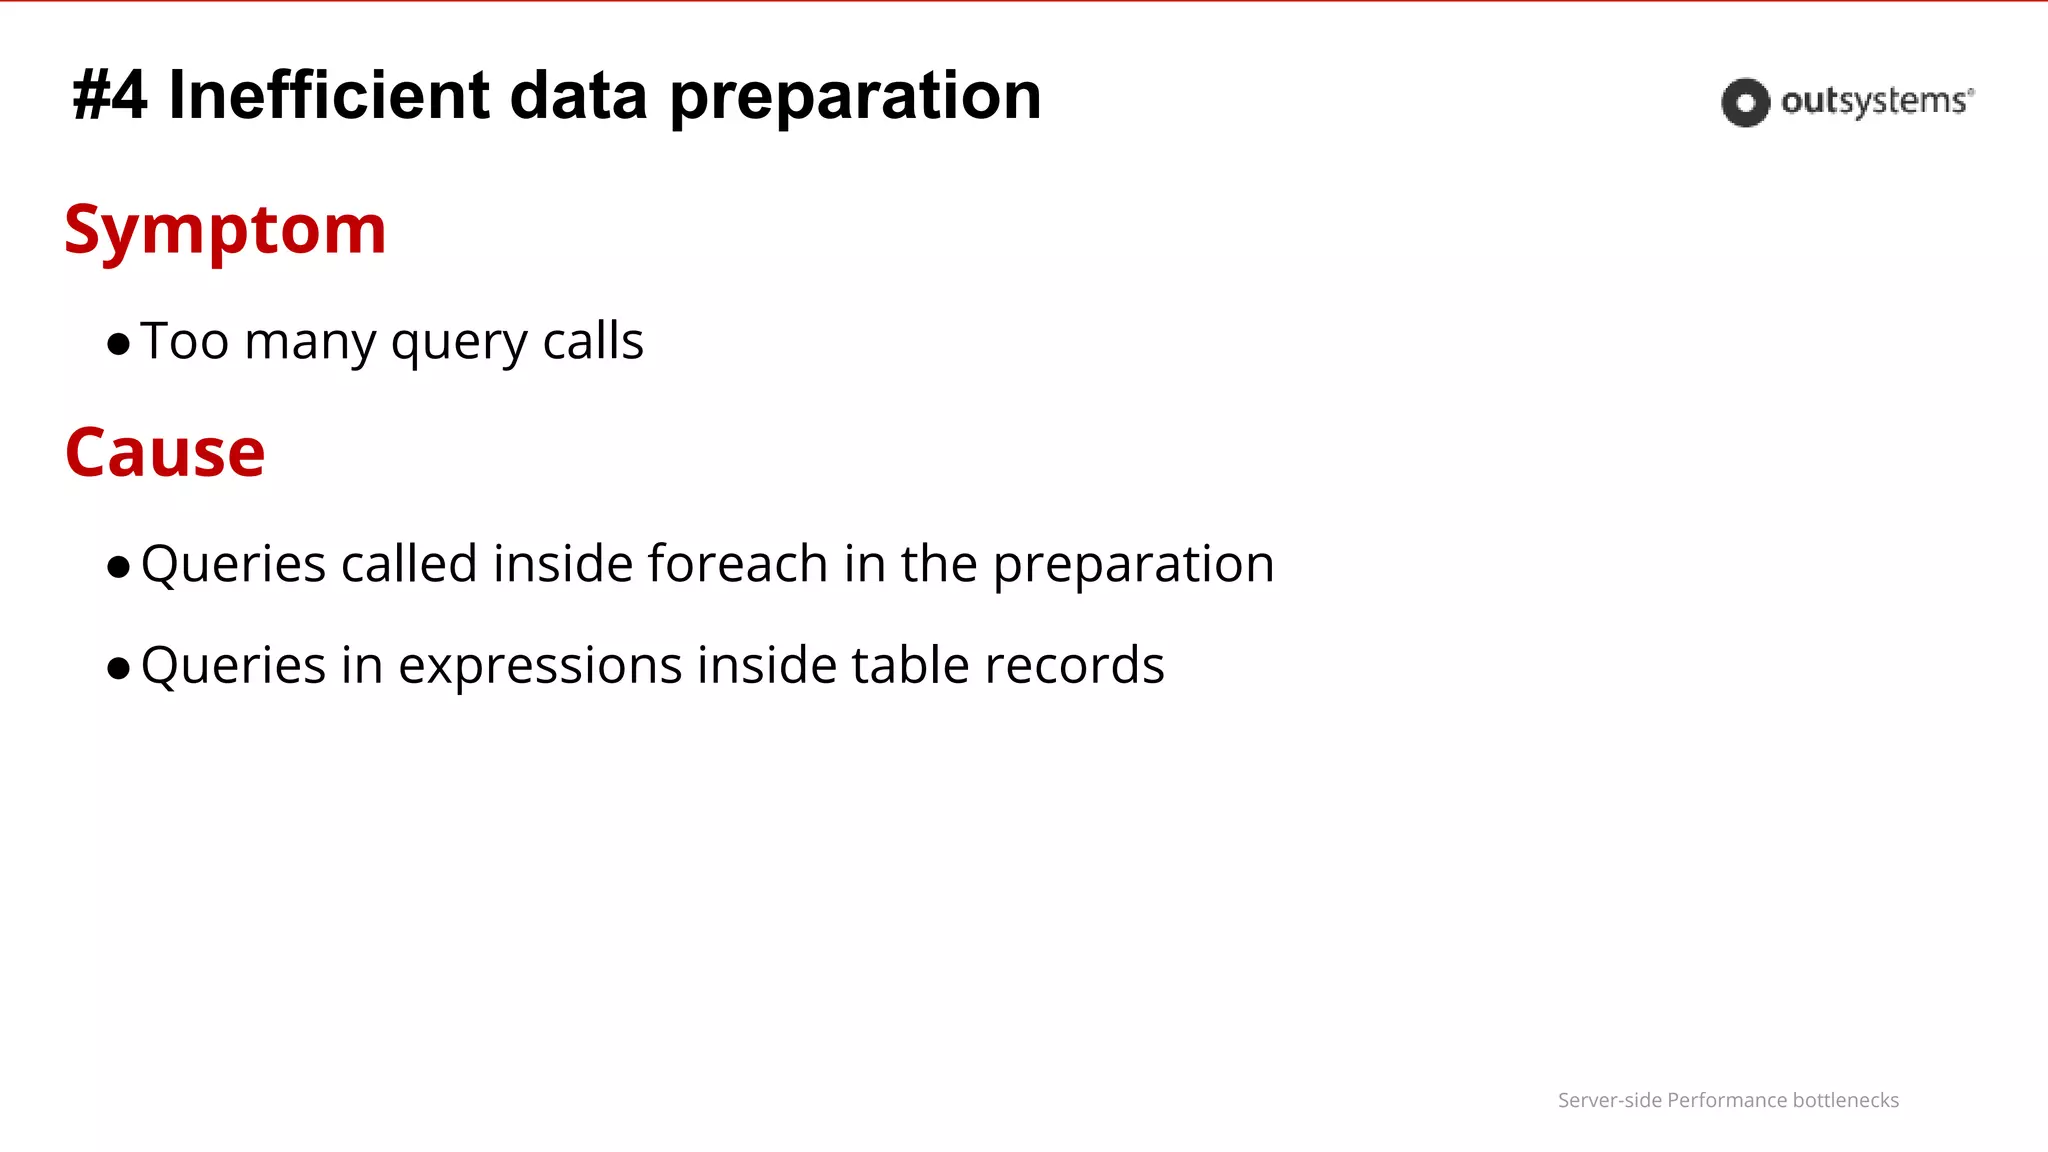
Introduction to the ten worst practices impacting performance, focusing on data fetching and counting issues.
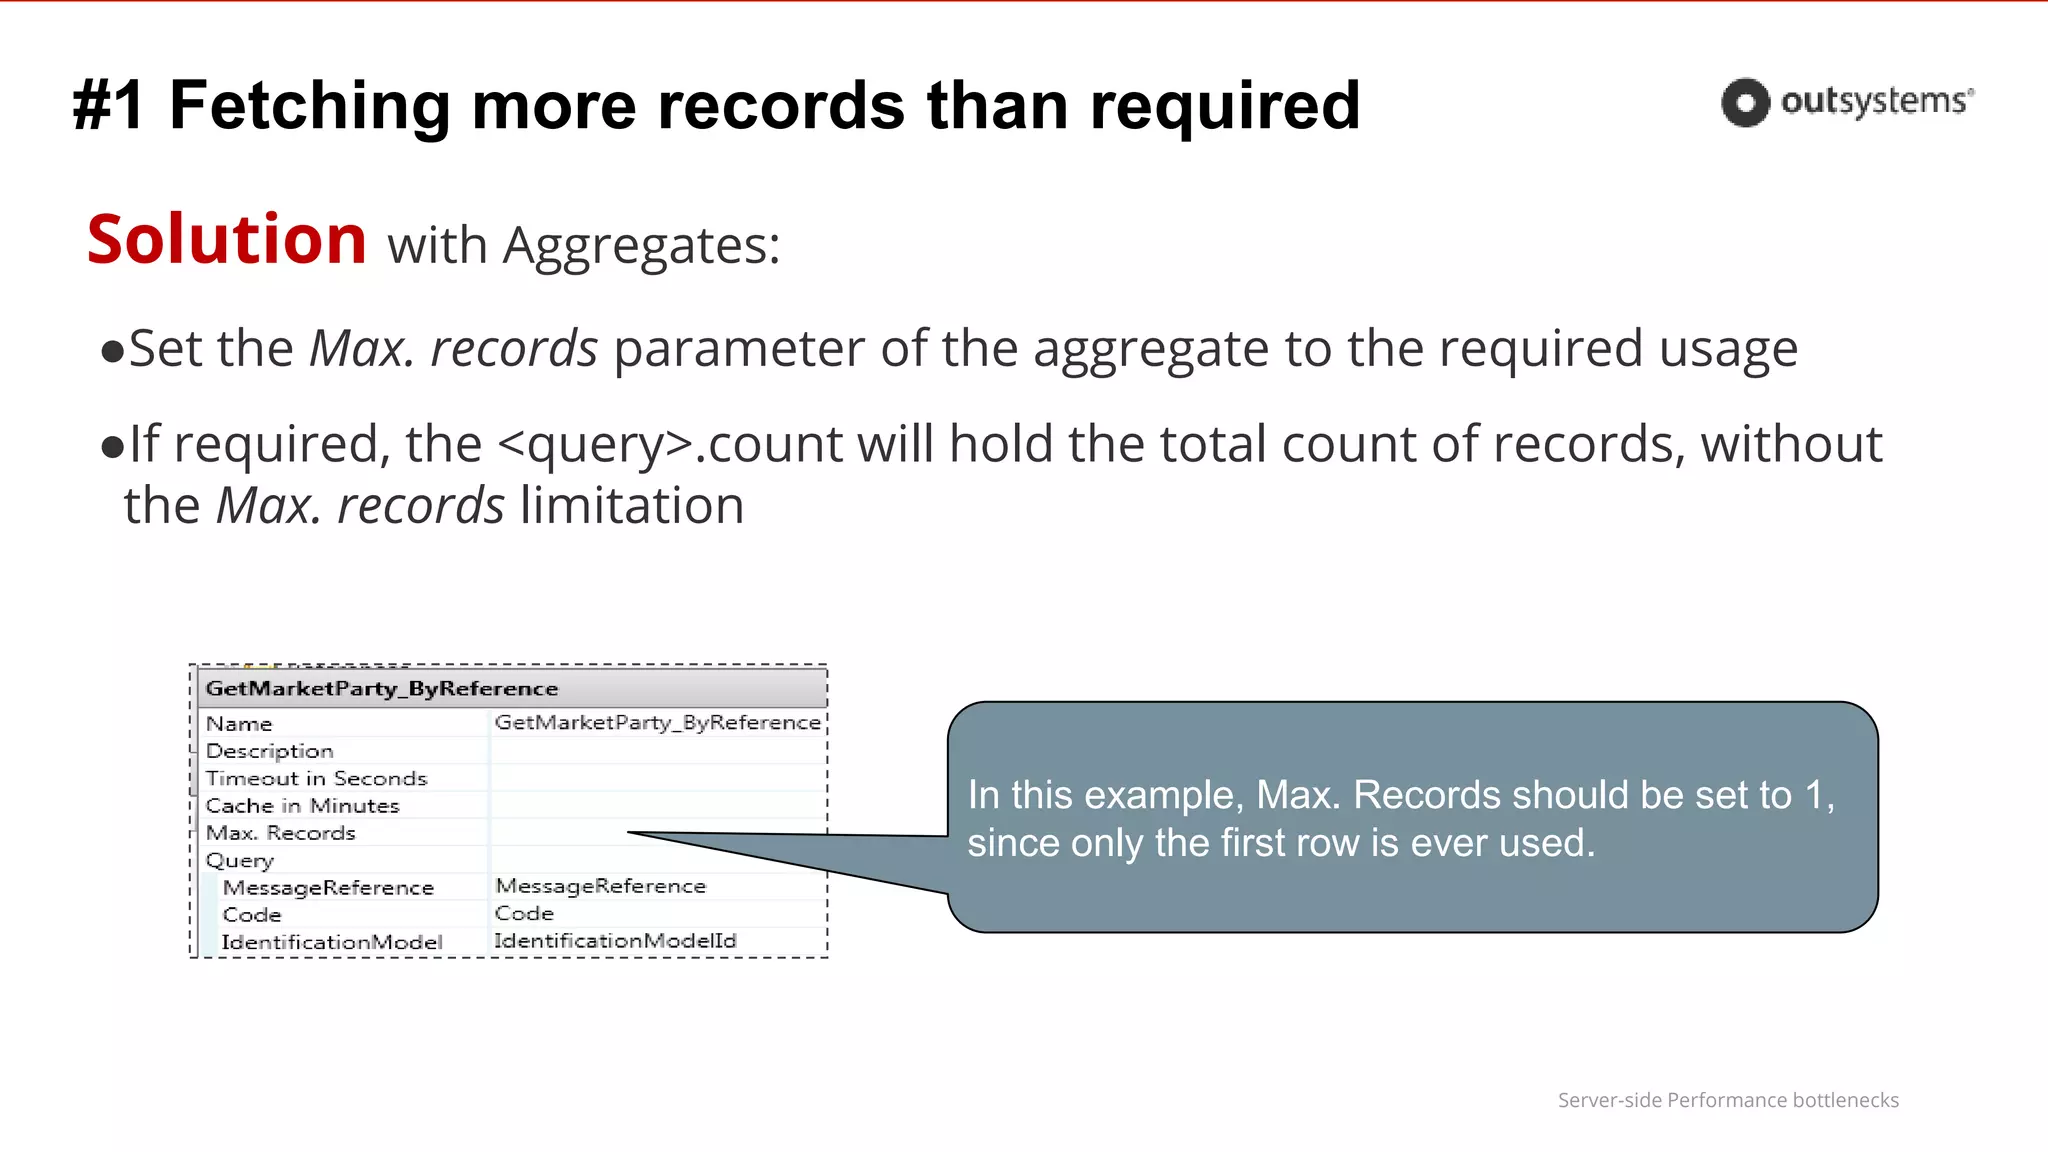
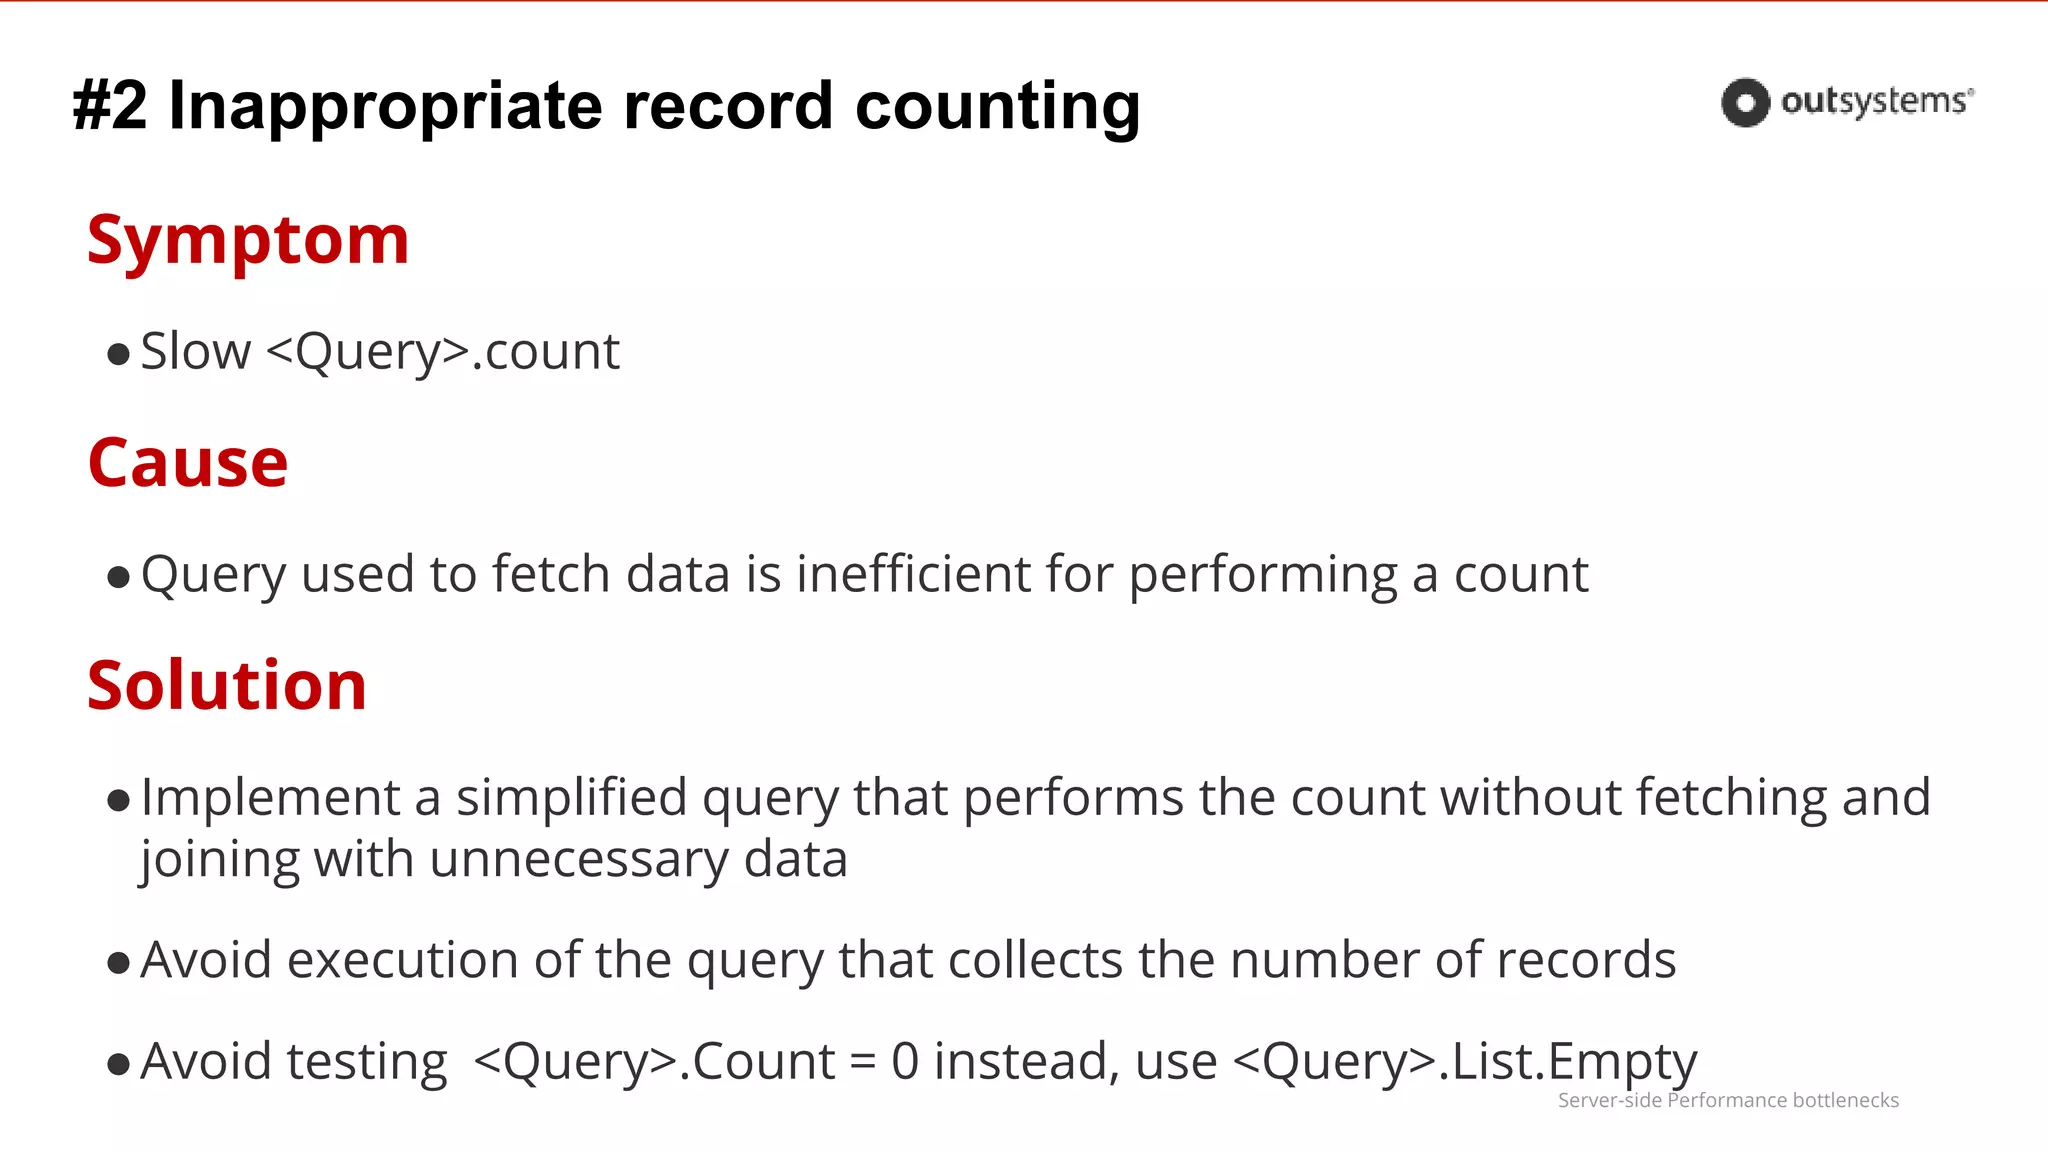
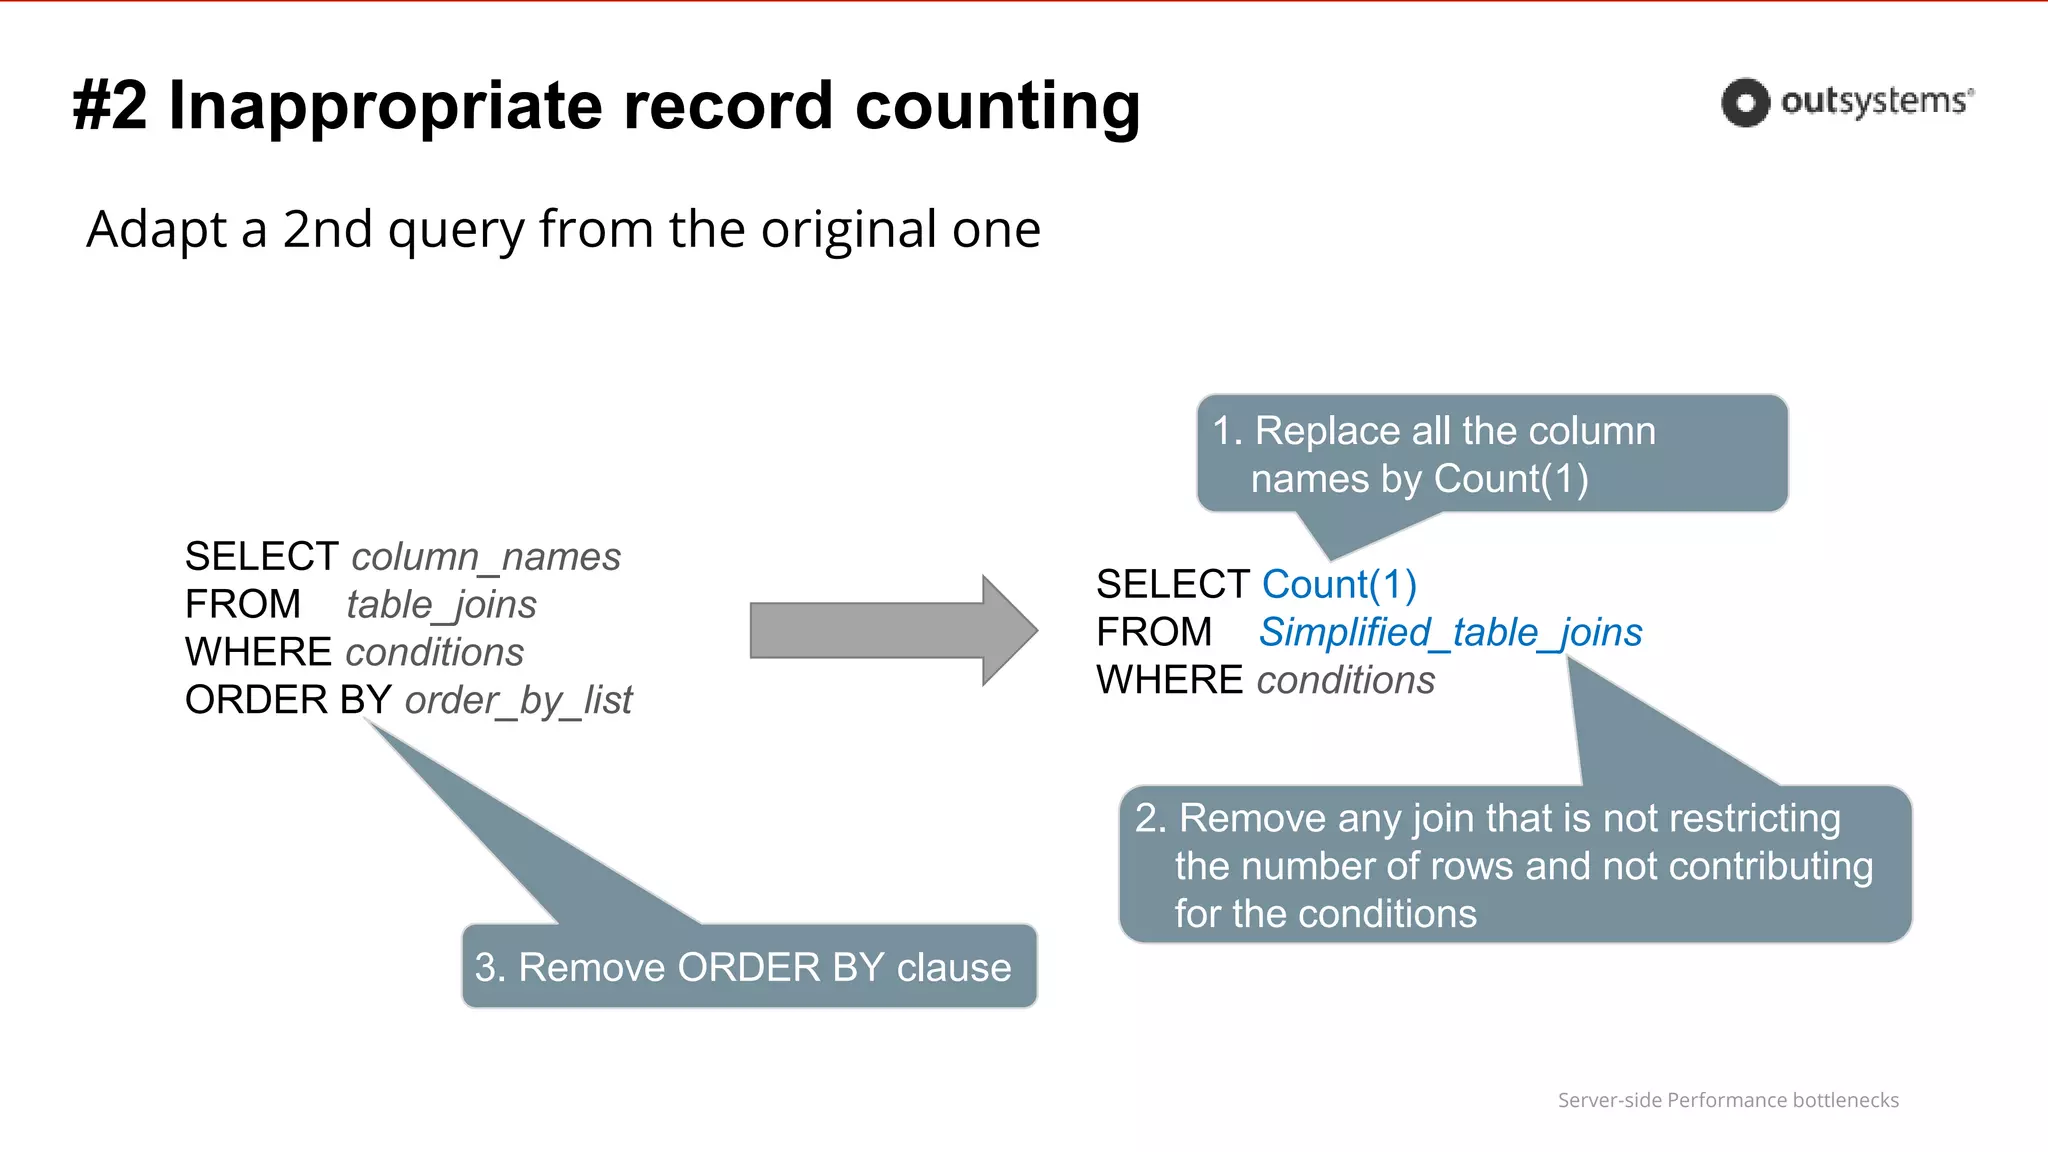
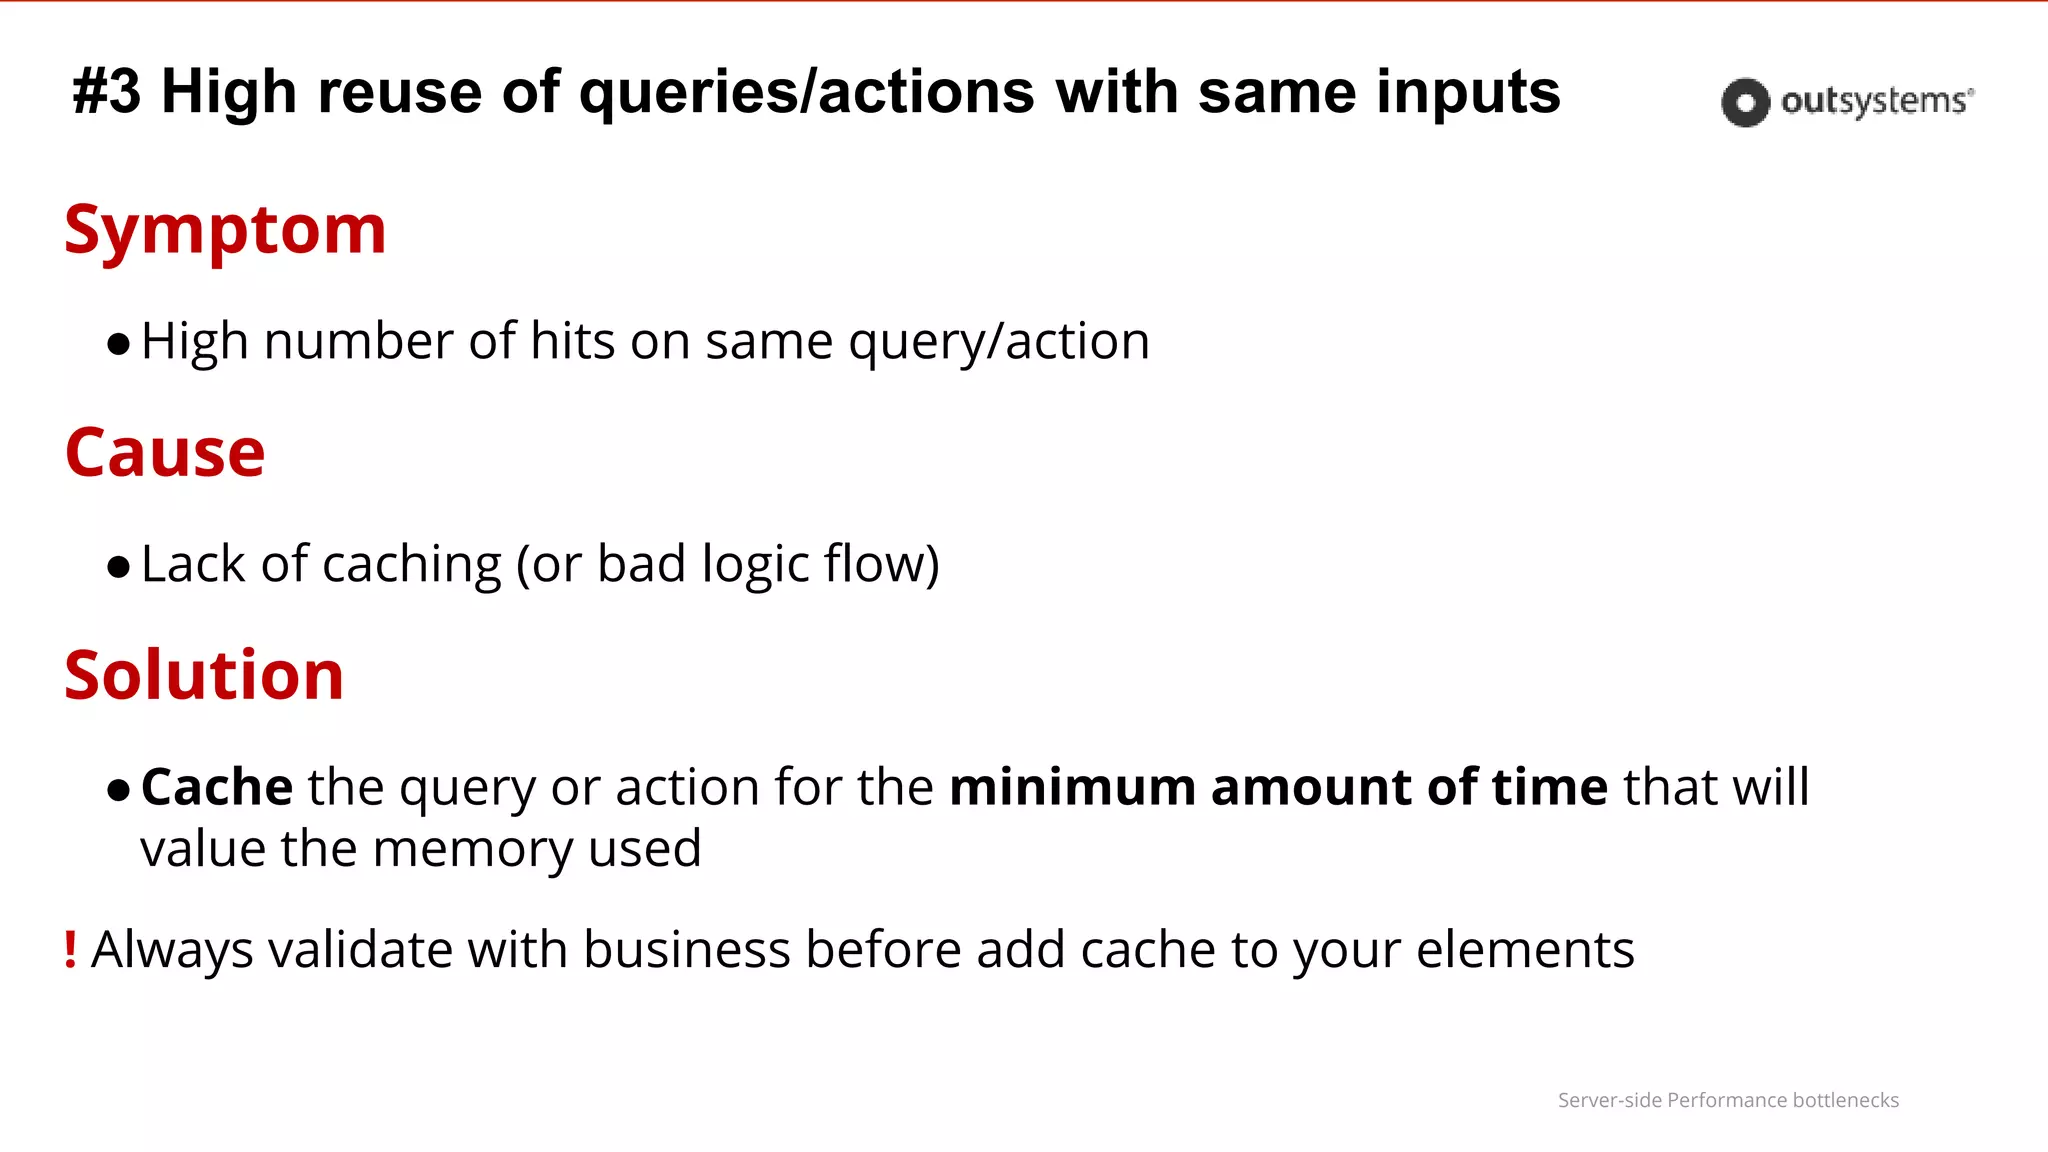
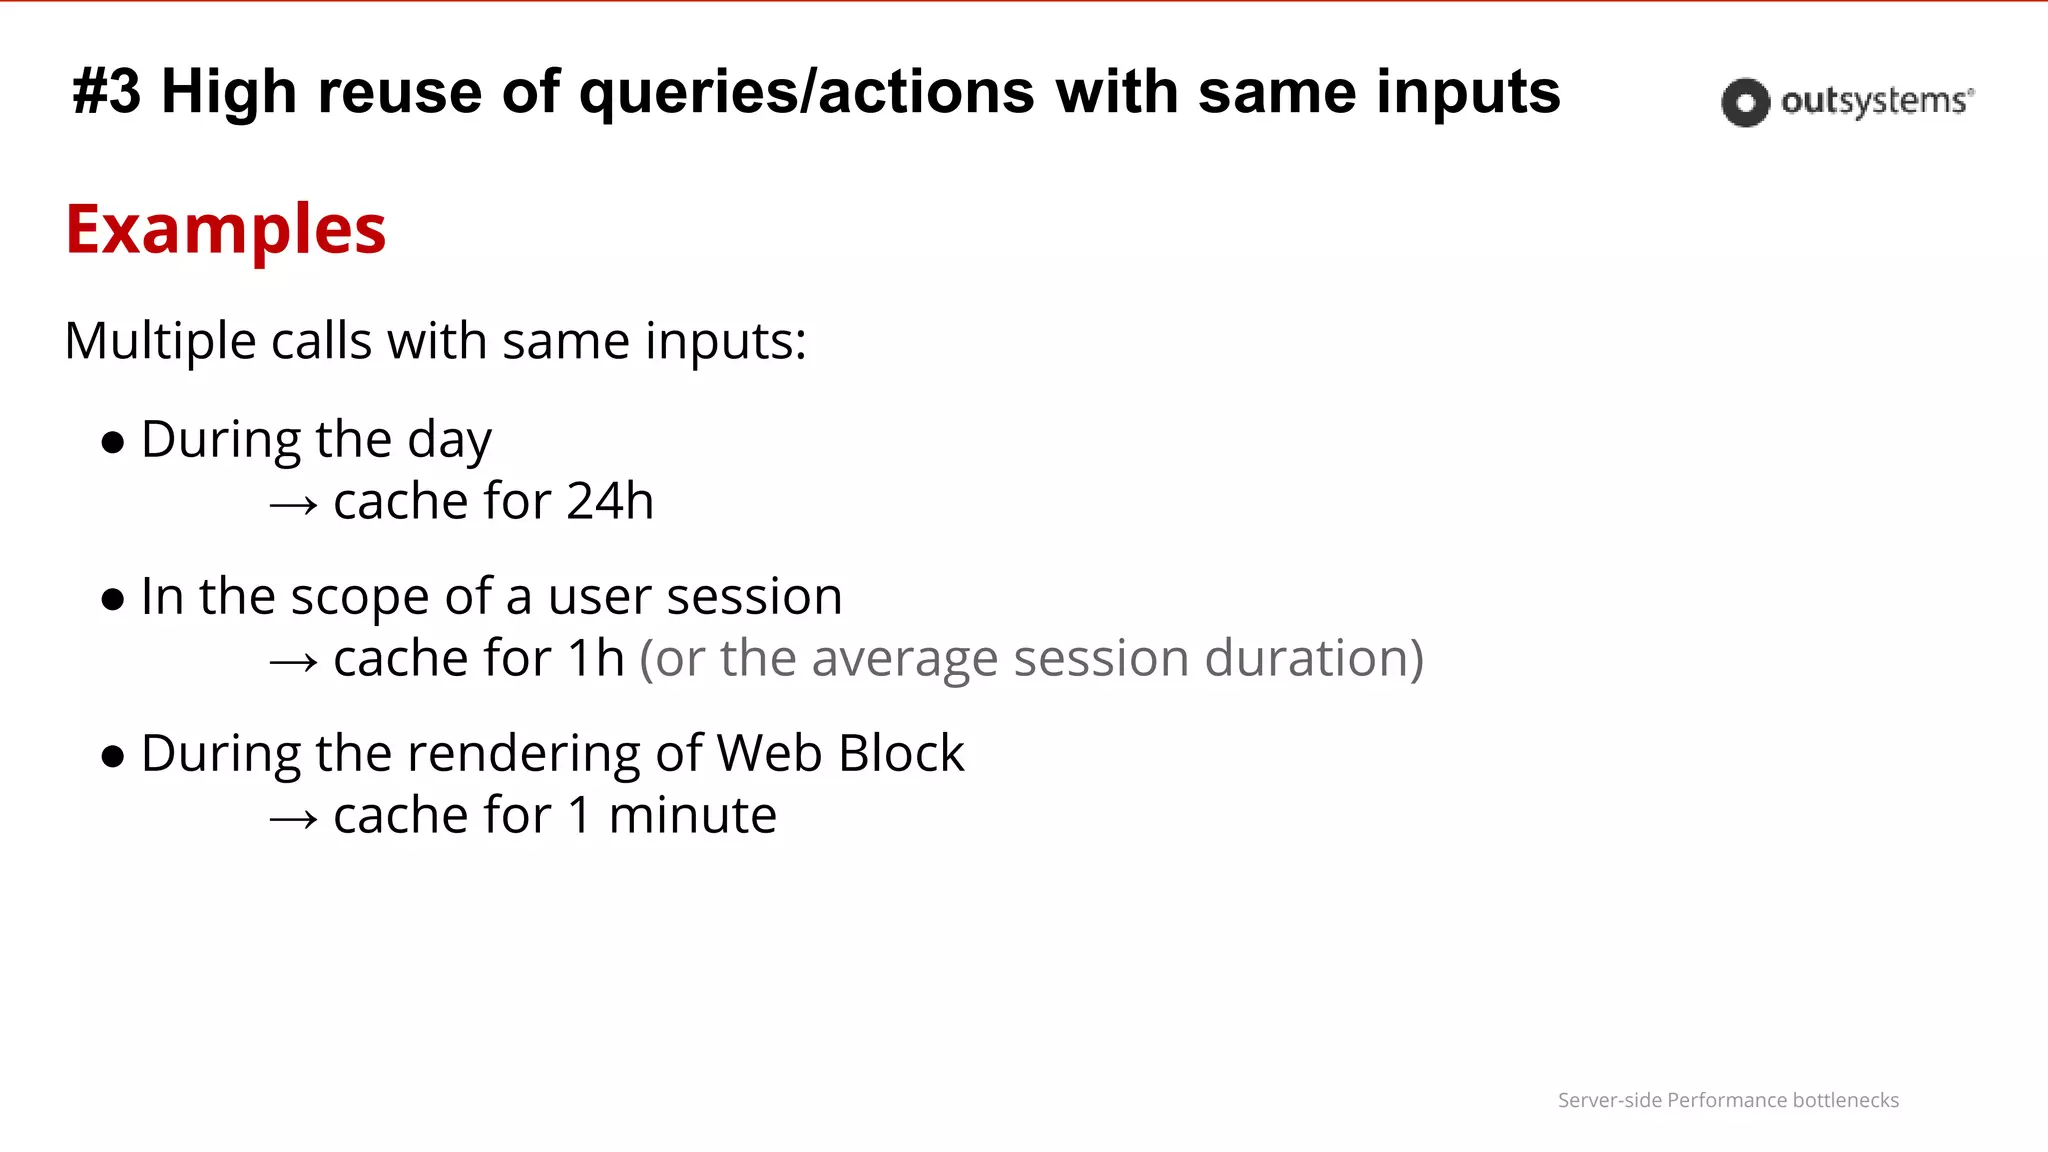
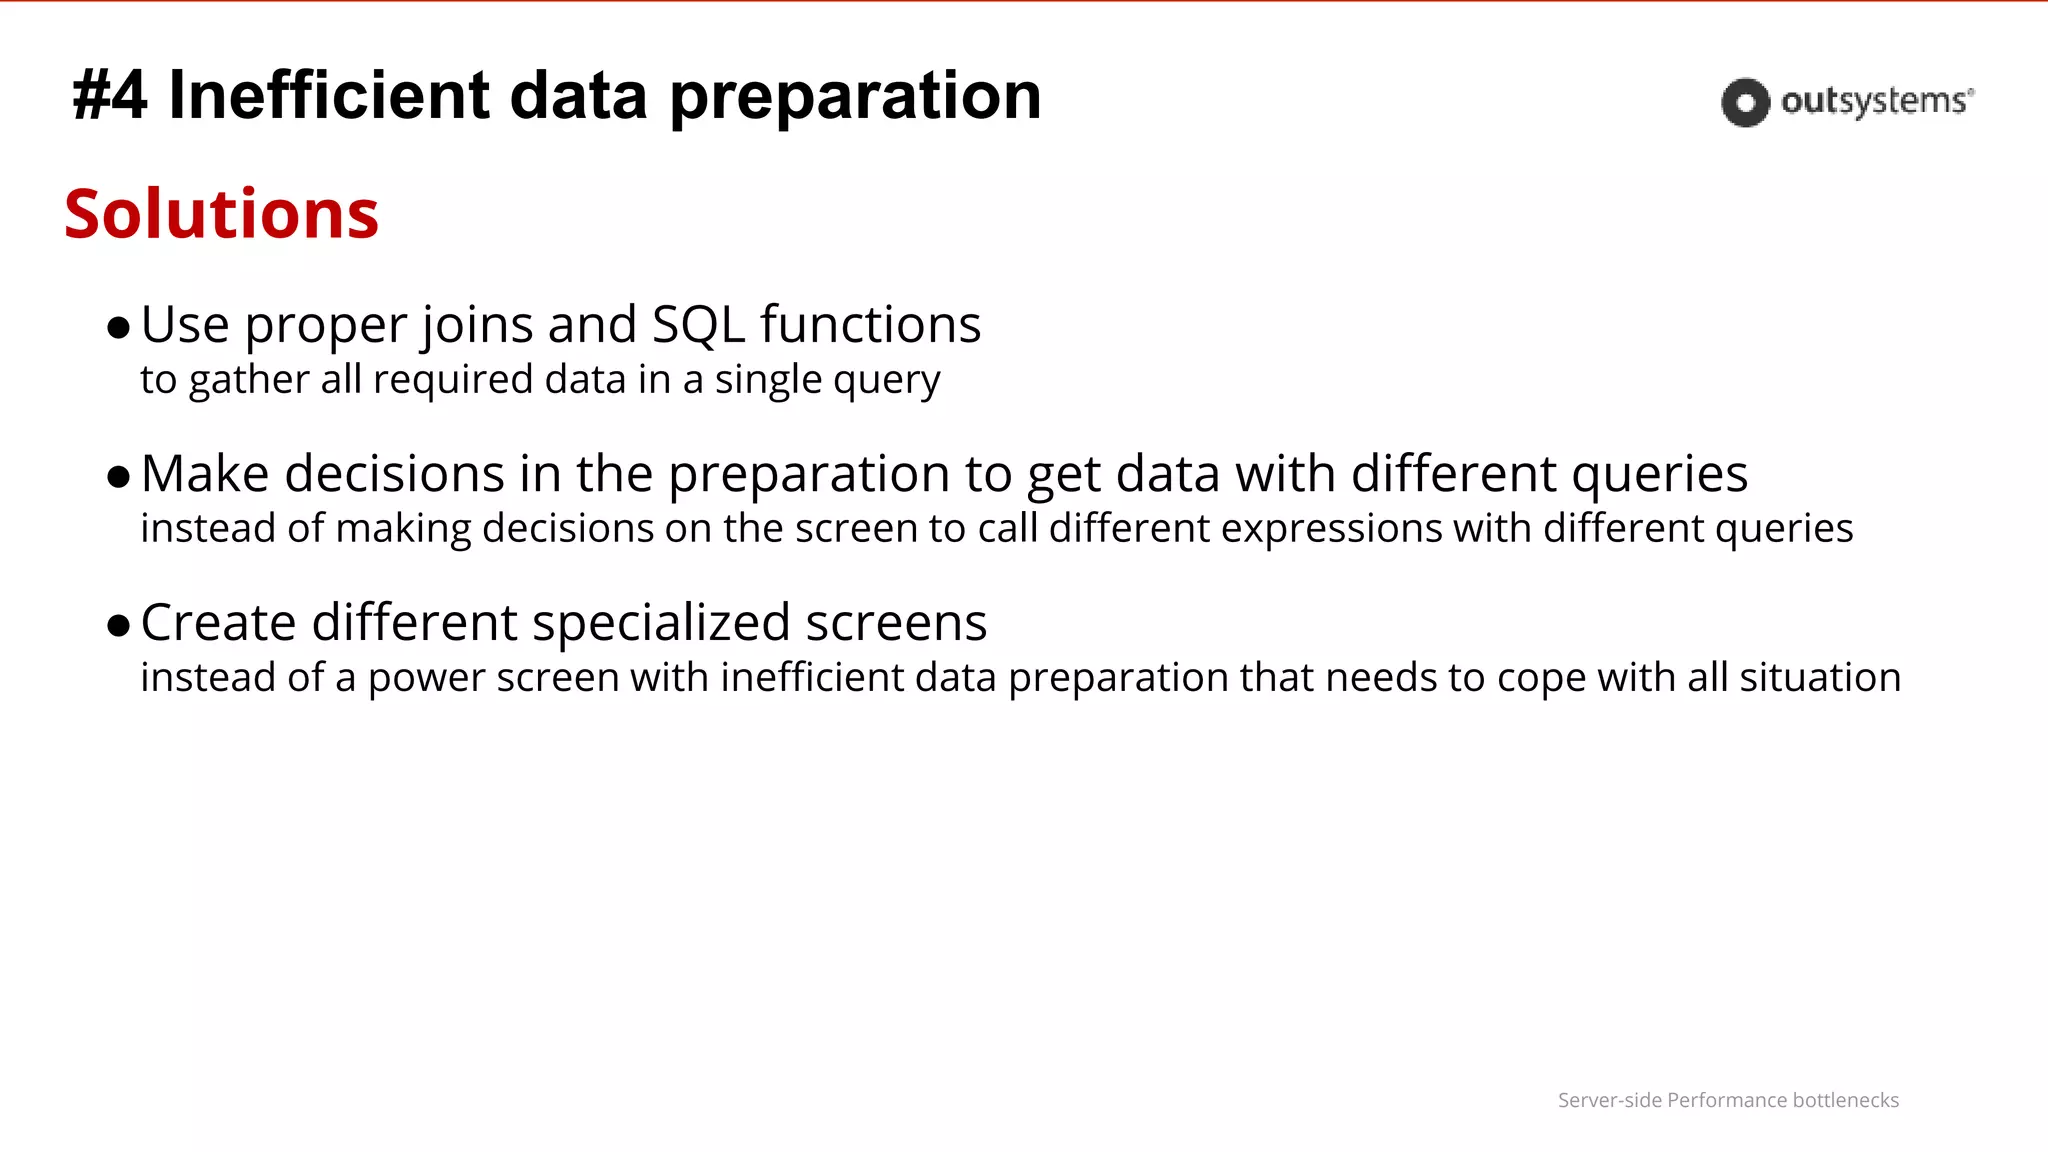
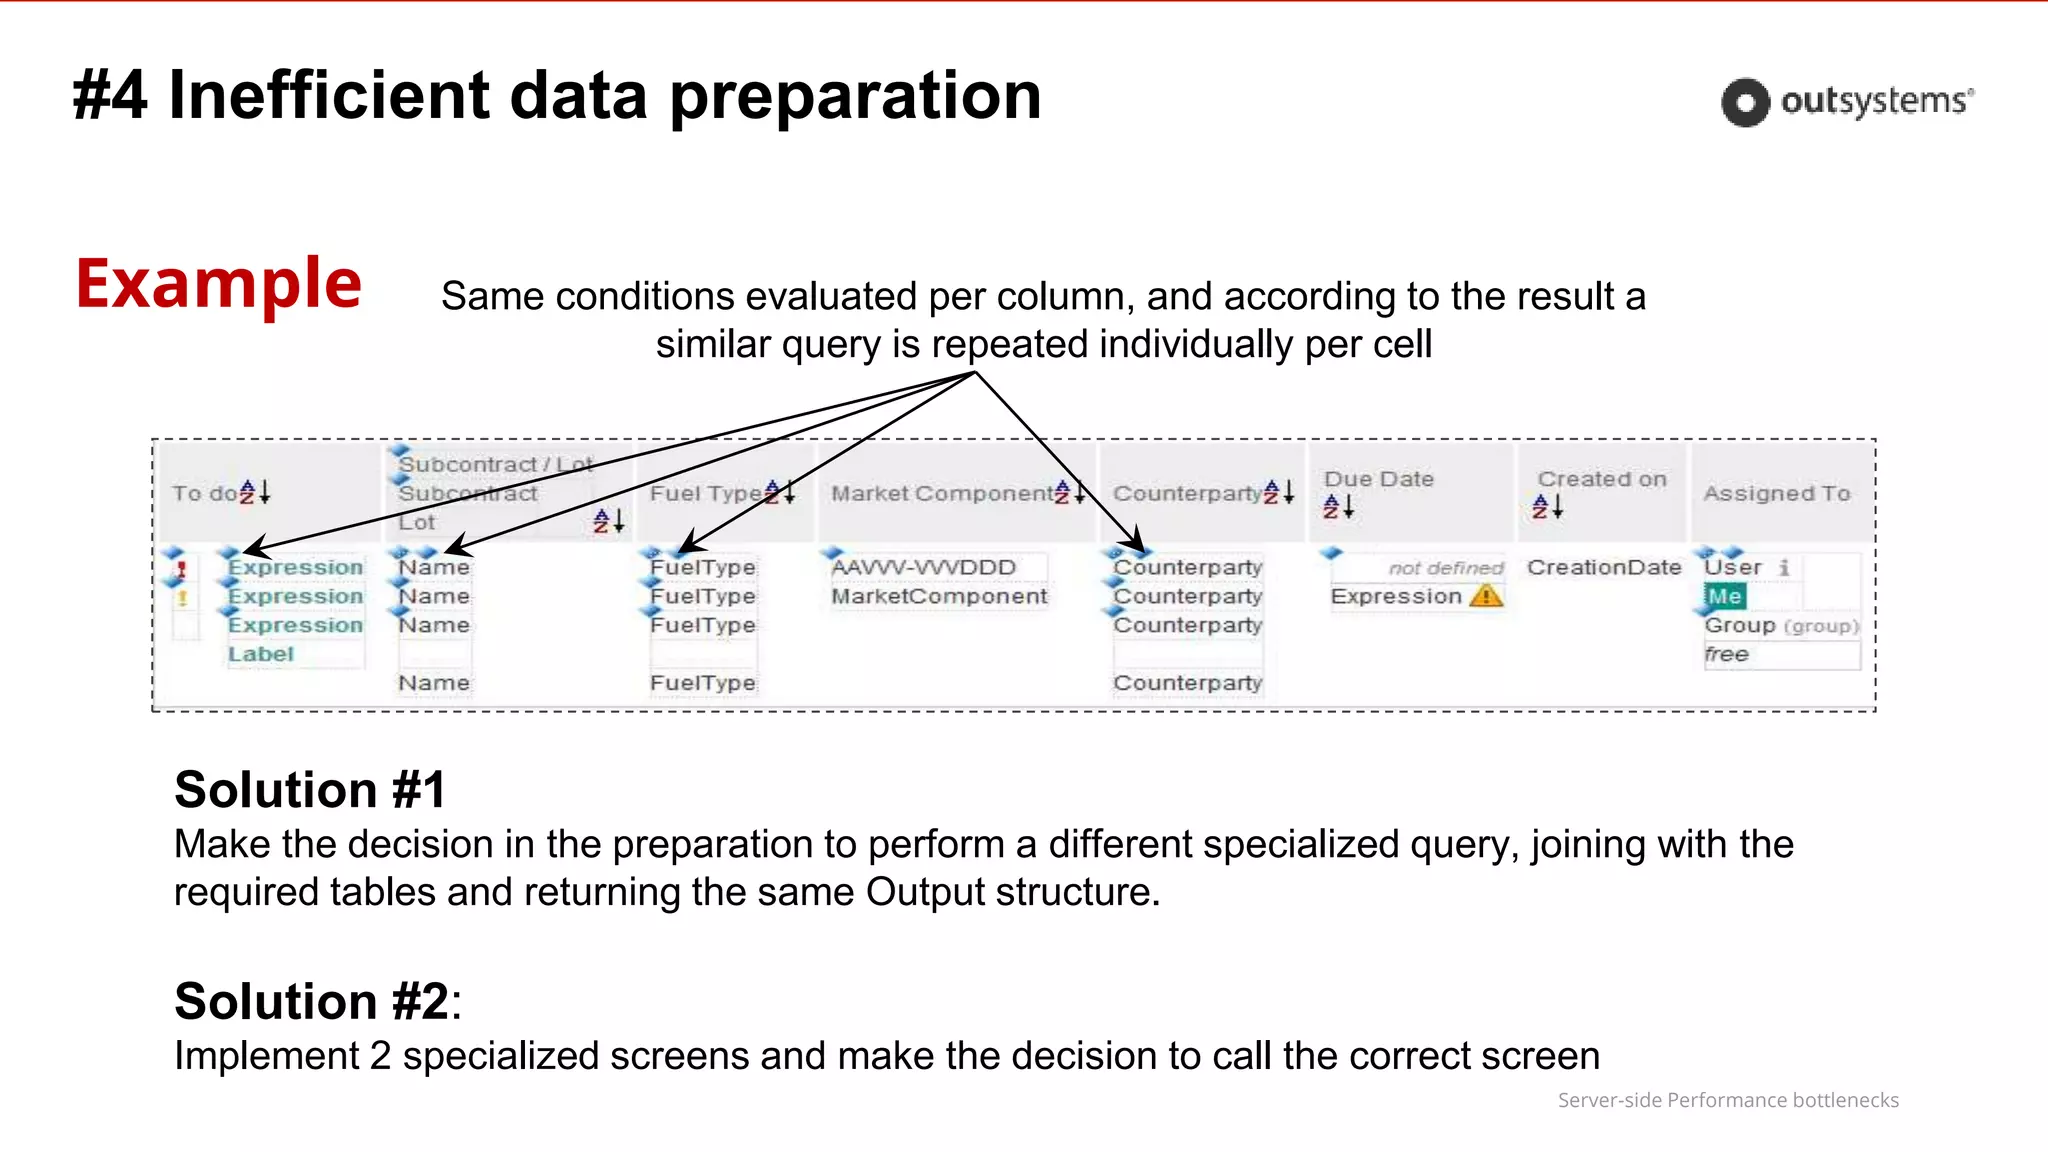
In-depth examination of common performance problems and solutions related to queries, data handling, and user experience.
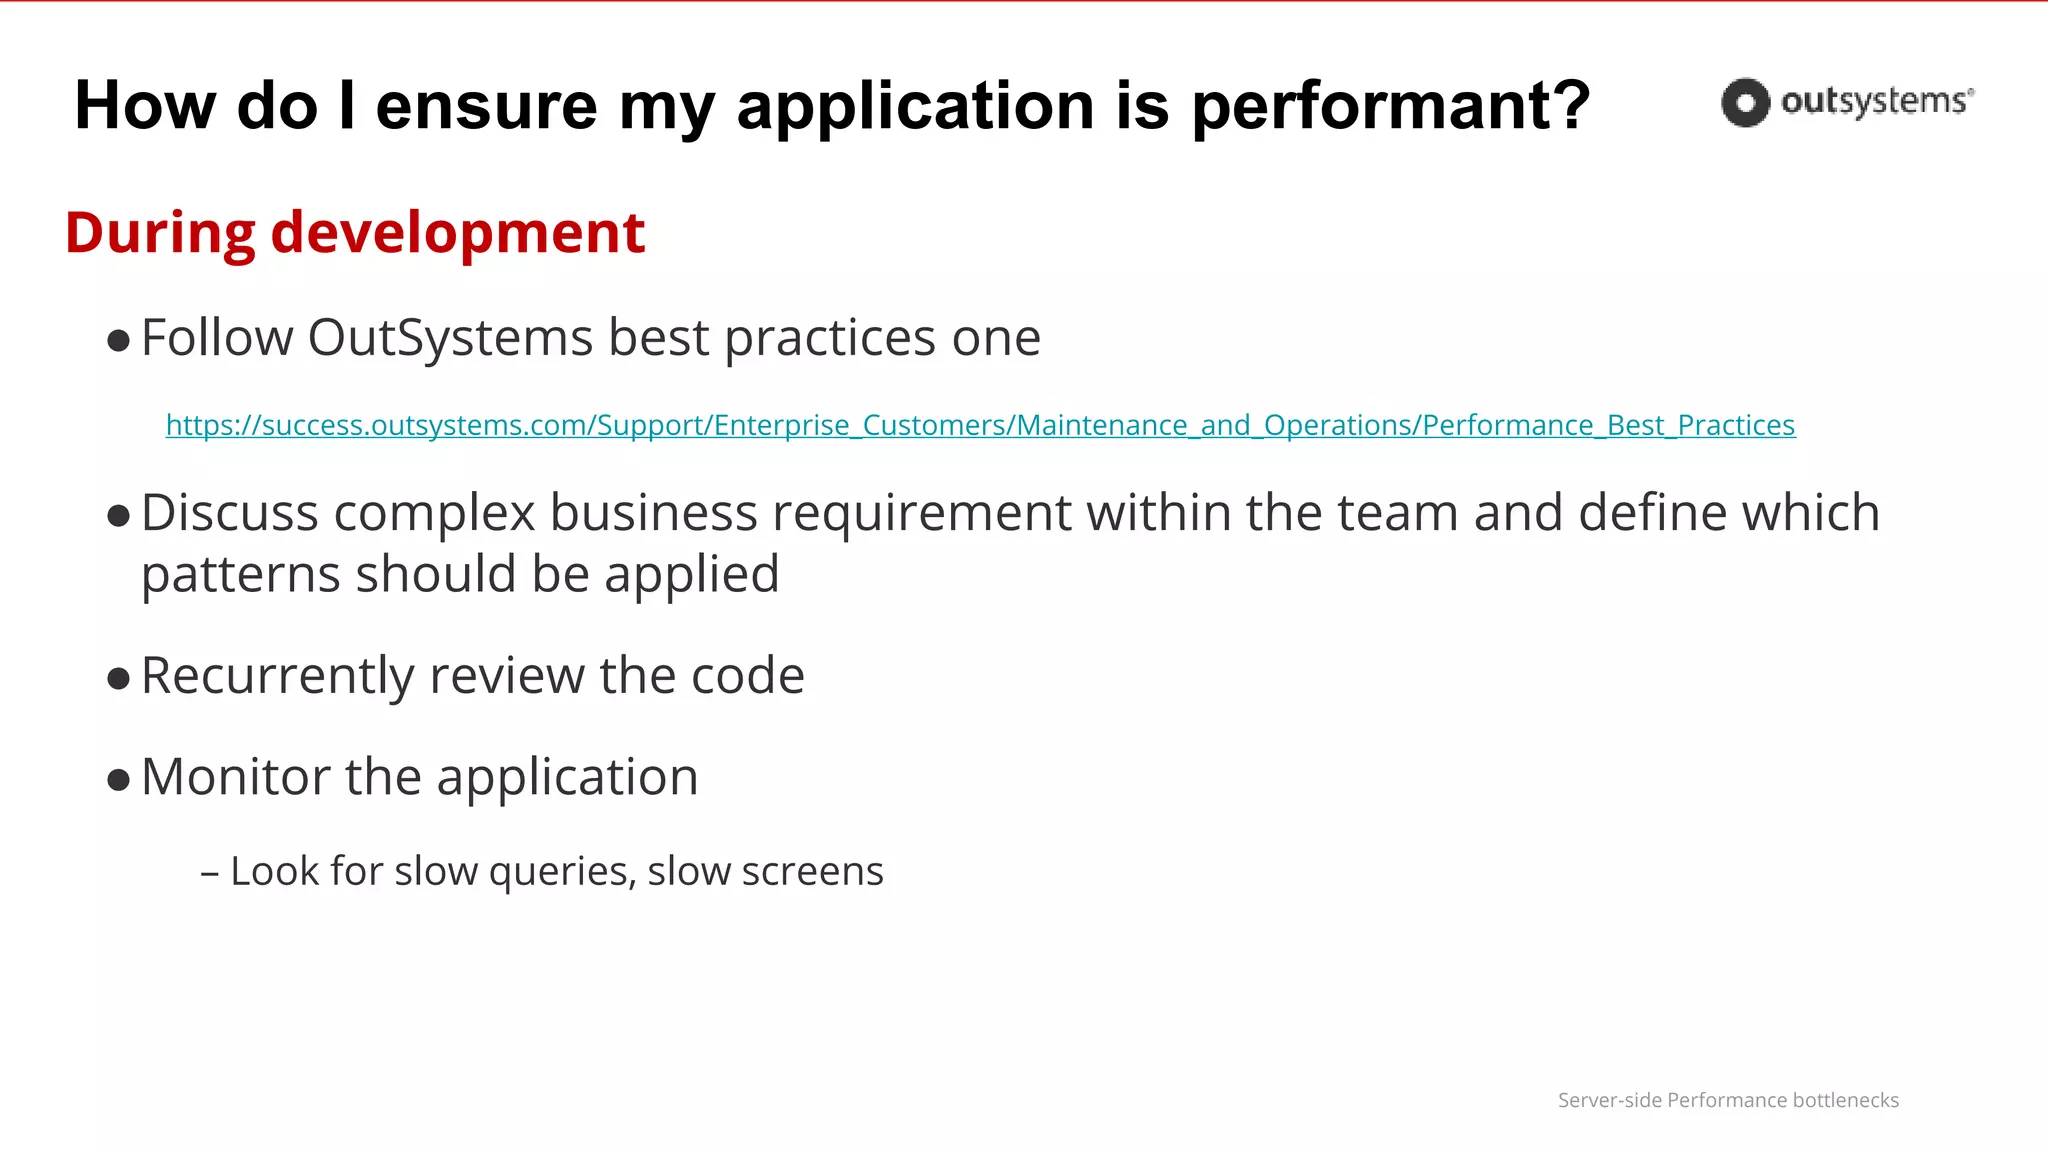
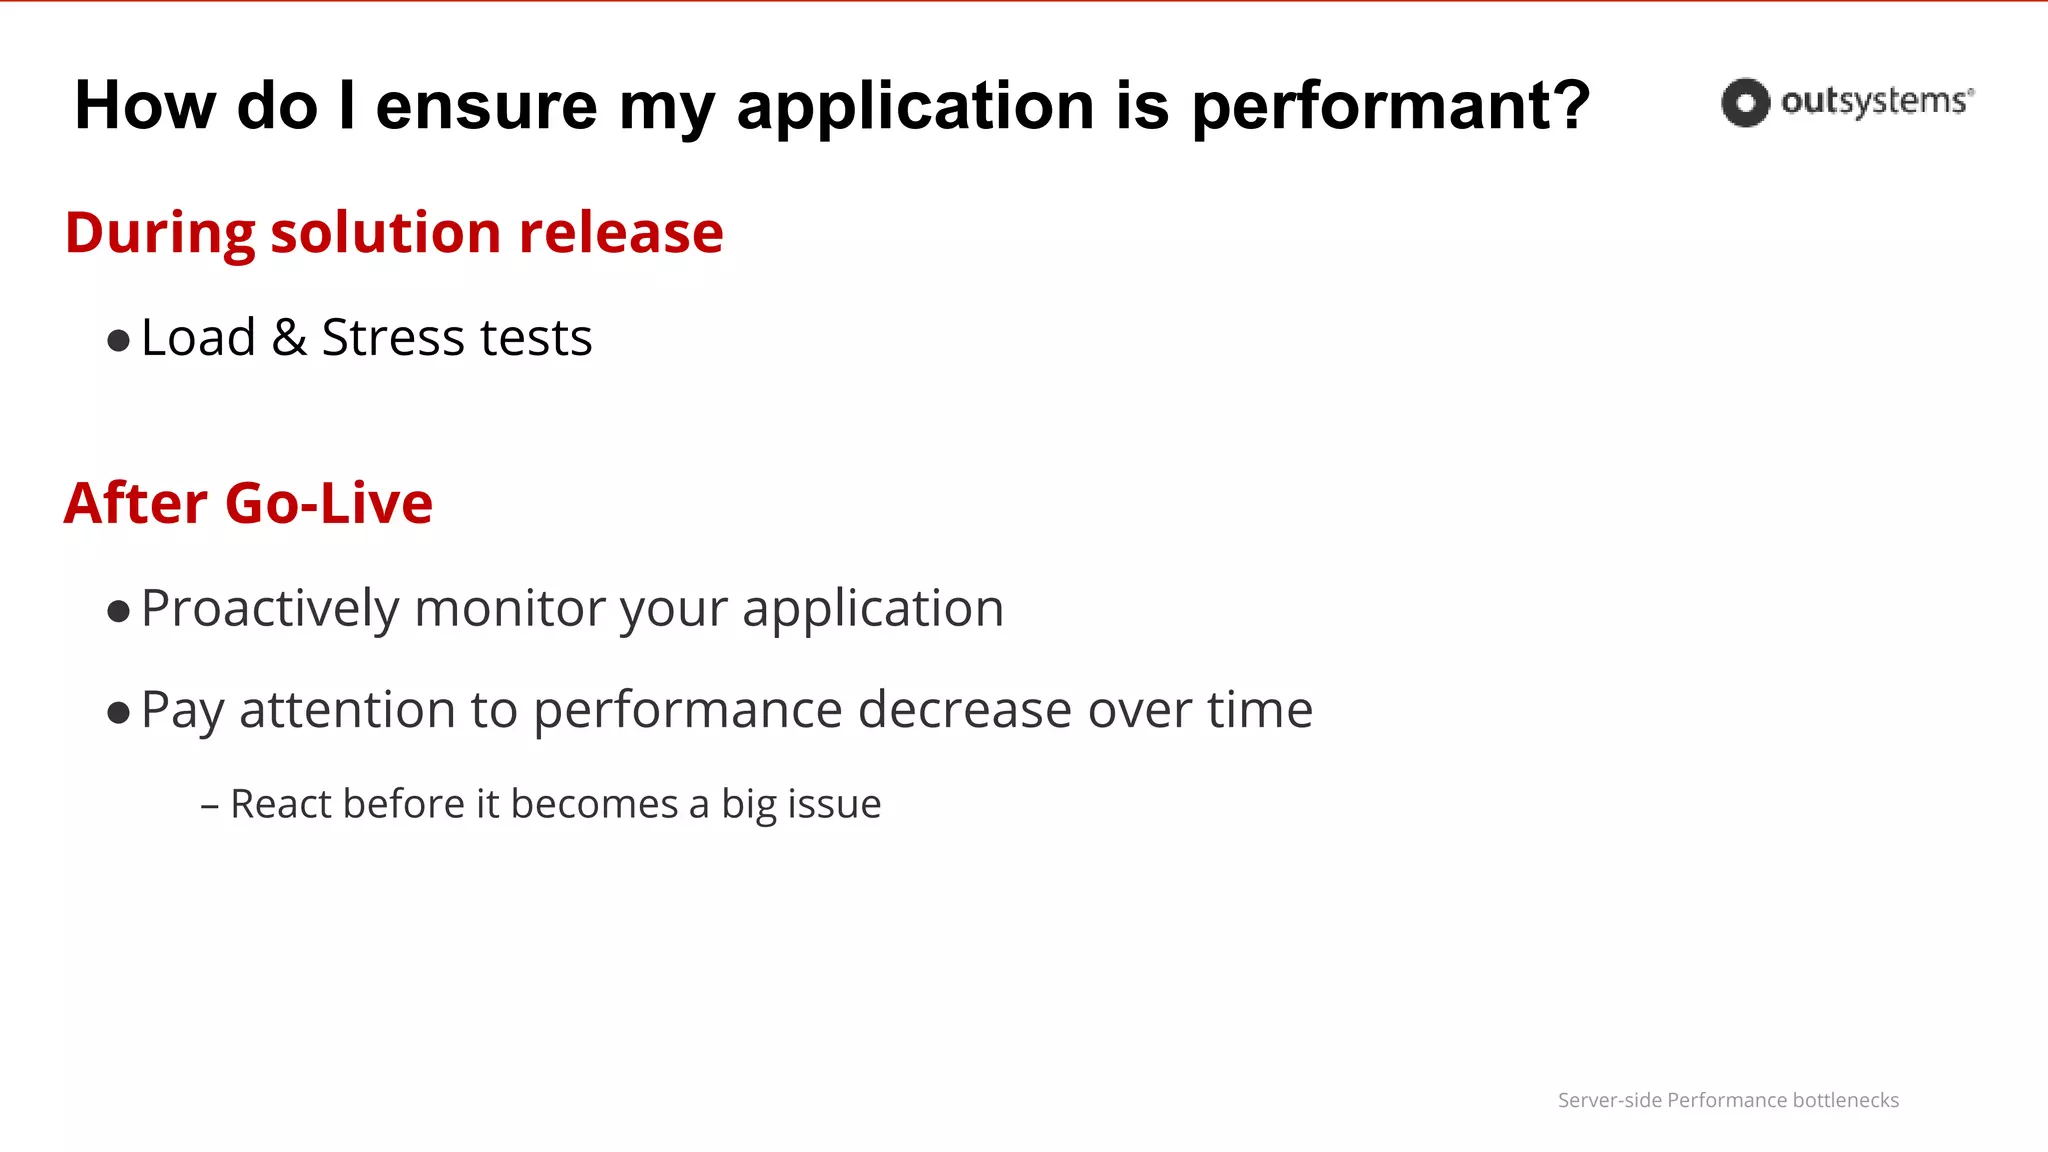
Best practices during development and after release to ensure application performance, focusing on testing and proactive monitoring.