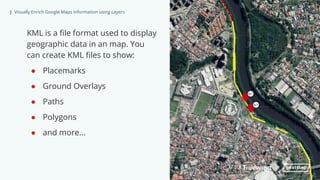
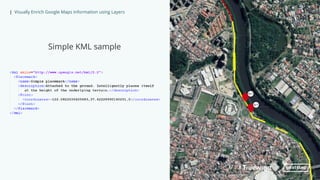
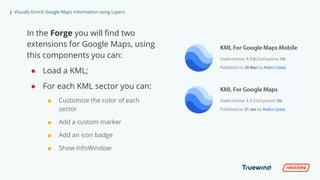
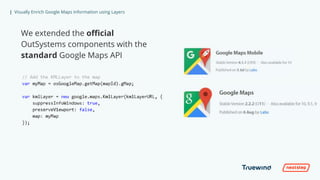
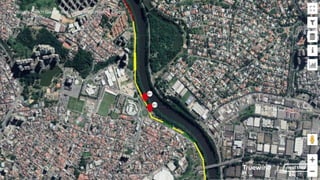
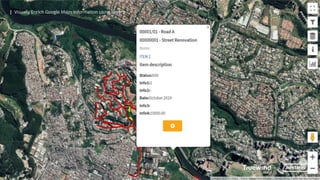
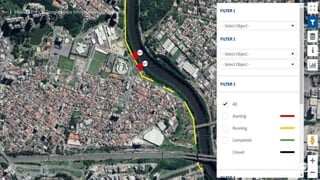
In this lightning session, we will explain that maps should not be boring! With our KML for Google Maps component, we have enriched them visually and with real-time business information to provide maps for users to love.
QGIS server: the good, the not-so-good and the uglyRoss McDonald
Fiona Hemsley-Flint's presentation on QGIS Server given at the 6th Scottish QGIS UK user group meeting. Compares QGIS server with Mapserver and Geognosis.
ThinkDo Project is he first cutting-edge app that automated schedules for better project management. Its revolutionary math model and chart are a step beyond Gantt, PERT and Kanban pipeline.
The concept behind ThinkDo you can find at this presentation as a report at the Innovation Section of the Project Management Institute's World Conference (PMICOS-2011).
Google Maps API use case for travel industry --- shubham jha Shubham Jha
How important Maps are for your business, for what business process it will be used and by whom ?
My aim to answer the above query taking travel industry into consideration
Interactive Maps A Step-by-Step Guide.pdfsumit Kumar
Select a Mapping Platform Choose a mapping platform or tool that suits your needs. Popular options include Google Maps API, Leaflet, Mapbox, or even open-source libraries like D3.js.
https://mapme.com/
How to leverage Location Intelligence in SAP Analytics CloudGaligeo
Everything happens somewhere.
That is the reason why most of business questions require a geospatial approach to be fully answered - known as Location Intelligence.
Join us for this presentation to discover how to leverage Location Intelligence within SAP Analytics Cloud and more specifically Analytics Designer using Galigeo, and learn how to create meaningful geo-driven applications and reports to improve your business performance.
Within the slides, you will learn how to:
- Blend your BI data with geographical data from various sources (shapefile, geojson, HANA Spatial, Esri, ...)
- Create layers of information on a map using drag-n-drop
- Define interactions between the map and other components (charts, tables) to create custom business behaviors
- Leverage business modules such as Territory Manager, to create and modify business territories based on your KPI
- And more...
So do not hesitate and book a seat right now. It's free!
Developing Spatial Applications with Google Maps and CARTOCARTO
Learn how CARTO integrates with Google Maps to unlock the advanced visualization capabilities of deck.gl and enables developers to build geospatial apps. You can watch the recorded webinar here: https://go.carto.com/webinars/google-maps-and-carto
Must Know Google Map Features for your Web applicationAppsbee
To get the best out of any web application every entrepreneur seeks all the know-how about Google Map API features. This presentation focuses over all those parts and makes one enable to develop a robust application using Google map features and add-on.
The main focus of this study is to find appropriate and stable solutions for representing the statistical data into map with some special features. This research also includes the comparison between different solutions for specific features. In this research I have found three solutions using three different technologies namely Oracle MapViewer, QGIS and AnyMap which are different solutions with different specialties. Each solution has its own specialty so we can choose any solution for representing the statistical data into maps depending on our criteria’s.
By Claudia Nuñez, Migrahack
Special for the 2013 Specialized Reporting Institute on immigration reform.
http://immigrationreportingworkshop2013.borderzine.com/
Innovating at the Speed of Business in the High-Bandwidth World of Digital MediaOutSystems
At NOS, the term “IT Driven” refers to IT activities as adding value to the business. That drove the use of low-code to speed up the delivery of critical projects their business needed. Hear how this leading telecommunications company grew through its relationship with OutSystems and evolved its processes into a bimodal IT approach to implement continuous delivery and provide app delivery roadmaps that benefits its customers and users.
Beyond “Location”: Informing Real-Estate Decisions Through Innovative TechnologyOutSystems
Beyond “Location”: Informing Real-Estate Decisions Through Innovative Technology
Colliers International is on a mission to empower its customers with innovative technology to help them make informed decisions. In this session, see how the company addressed modernization challenges, rewrote a mission-critical application, replaced much of its legacy technology, and produced more applications in the last two years than it had in the last decade.
More Related Content
Similar to Enrich Visually Google Map Information With Layers
Google Maps API use case for travel industry --- shubham jha Shubham Jha
How important Maps are for your business, for what business process it will be used and by whom ?
My aim to answer the above query taking travel industry into consideration
Interactive Maps A Step-by-Step Guide.pdfsumit Kumar
Select a Mapping Platform Choose a mapping platform or tool that suits your needs. Popular options include Google Maps API, Leaflet, Mapbox, or even open-source libraries like D3.js.
https://mapme.com/
How to leverage Location Intelligence in SAP Analytics CloudGaligeo
Everything happens somewhere.
That is the reason why most of business questions require a geospatial approach to be fully answered - known as Location Intelligence.
Join us for this presentation to discover how to leverage Location Intelligence within SAP Analytics Cloud and more specifically Analytics Designer using Galigeo, and learn how to create meaningful geo-driven applications and reports to improve your business performance.
Within the slides, you will learn how to:
- Blend your BI data with geographical data from various sources (shapefile, geojson, HANA Spatial, Esri, ...)
- Create layers of information on a map using drag-n-drop
- Define interactions between the map and other components (charts, tables) to create custom business behaviors
- Leverage business modules such as Territory Manager, to create and modify business territories based on your KPI
- And more...
So do not hesitate and book a seat right now. It's free!
Developing Spatial Applications with Google Maps and CARTOCARTO
Learn how CARTO integrates with Google Maps to unlock the advanced visualization capabilities of deck.gl and enables developers to build geospatial apps. You can watch the recorded webinar here: https://go.carto.com/webinars/google-maps-and-carto
Must Know Google Map Features for your Web applicationAppsbee
To get the best out of any web application every entrepreneur seeks all the know-how about Google Map API features. This presentation focuses over all those parts and makes one enable to develop a robust application using Google map features and add-on.
The main focus of this study is to find appropriate and stable solutions for representing the statistical data into map with some special features. This research also includes the comparison between different solutions for specific features. In this research I have found three solutions using three different technologies namely Oracle MapViewer, QGIS and AnyMap which are different solutions with different specialties. Each solution has its own specialty so we can choose any solution for representing the statistical data into maps depending on our criteria’s.
By Claudia Nuñez, Migrahack
Special for the 2013 Specialized Reporting Institute on immigration reform.
http://immigrationreportingworkshop2013.borderzine.com/
Innovating at the Speed of Business in the High-Bandwidth World of Digital MediaOutSystems
At NOS, the term “IT Driven” refers to IT activities as adding value to the business. That drove the use of low-code to speed up the delivery of critical projects their business needed. Hear how this leading telecommunications company grew through its relationship with OutSystems and evolved its processes into a bimodal IT approach to implement continuous delivery and provide app delivery roadmaps that benefits its customers and users.
Beyond “Location”: Informing Real-Estate Decisions Through Innovative TechnologyOutSystems
Beyond “Location”: Informing Real-Estate Decisions Through Innovative Technology
Colliers International is on a mission to empower its customers with innovative technology to help them make informed decisions. In this session, see how the company addressed modernization challenges, rewrote a mission-critical application, replaced much of its legacy technology, and produced more applications in the last two years than it had in the last decade.
Beyond Digital Transformation: A Mandate for Disruptive Innovation in the Age...OutSystems
Before a customer ever sees your product, there are hundreds of processes, tools, decisions, and people that impact its delivery. Learn more about how the CVS Health business, swift, implemented the transformative power of low-code to create a wave of disruptive innovation that has impacted every aspect of its business and has the potential to redefine its industry.
From Core Systems to Mobile Apps: Digital Transformation from the Inside-OutOutSystems
When Chilean telecom leader, Entel, launched its digital transformation project, it followed the guidance of experts: Start with your core and work outwards. With its core modernized, the company released a new mobile app in less than a year. Hear how the company’s focus on core systems first, allowed it to layer on innovative new services helping it become not just a leader in Chile, but a challenger in the Peruvian market as well.
Orchestrating the Art of the Impossible Using Low-Code to Automate Manual Wor...OutSystems
Task and process automation is often praised as the holy grail of cutting costs and maximizing profitability. But what about less tangible activities such as compliance and auditing? Join Standard Insurance Company and hear how OutSystems helped them automate and minimize manual work steps resulting in across-the-board efficiencies that saved time and money.
Fast and Furious: Modernizing Clinical ApplicationOutSystems
Twice, Mednax has attempted to modernize its legacy clinical app. After the most recent 6-year project was canceled prior to deployment, Mednax turned to OutSystems. In just five months, the company rolled out an MVP and in eight months the new Clinical Application went live. Hear this amazing success story that is helping to reduce the burden on providers and deliver better patient care where it matters most.
Using Processes and Timers for Long-Running Asynchronous TasksOutSystems
What do you do when a task can take more than five minutes and then times out? How do you run it asynchronously and present the status to the user? Come and see how processes and timers can be used together.
"With OutSystems, we can publish our application with the click of a single button. How awesome would it be if we could create an entire OutSystems infrastructure with just one click?
This is possible! In this session, we will tell you all the secrets about unattended installation and/or upgrading the OutSystems platform."
Many OutSystems projects begin simply. The requirements are not complex and therefore, neither is the architecture. But, as implementations grow, so grows the complexity and functionality needs of the enterprise. In this session, we will explore the 4-Layer Architecture and show you what we encountered, and learned, moving from a simple architecture to a 4-Layer one.
Speed up Development by Turning Web Blocks Into First-Class CitizensOutSystems
"What if:
- You could have a 2-way sync between a (structure) variable and a we block (e.g. input widgets)
- There was a valid runtime property for web blocks (e.g. built-in widgets)
- Web block behaved LIKE built-in widgets?
In this talk, we will present an approach, and a couple of tools, that help promote web blocks to first class citizens. It has helped us speed up development and improve maintainability. Maybe it will also be helpful to you."
Sometimes we want our UI to respond to external events. With the power of Google's Firebase, we can interact with those events in OutSystems to build extremely powerful and interactive applications
Excited about the new reactive web features? Come to this session to learn some of the best practices to make sure that you get started on the right foot.
After five years, "Company X's" HR application was not performing very well due to legacy issues. Simply loading the Dashboard could take up to 10 minutes. We will share some tricks we used to make sure the Dashboard could be properly used again.
When setting up a new project we have some tips and tricks to help you do this in the best way possible, incl. infrastructure, database, standard attributes, logging, code alignment, and service center.
No API? No Problem! Let the Robot Do Your Work! Web Scraping and Automation W...OutSystems
Considering how popular APIs are these days, it’s frustrating to run into a service or site without one. But, it’s actually quite common. If you need to collect data or perform an action on the web without access to an API, there are a couple ways you can hack it using OutSystems.
Gamify Your Mind; The Secret Sauce to Delivering Success, Continuously Improv...Shahin Sheidaei
Games are powerful teaching tools, fostering hands-on engagement and fun. But they require careful consideration to succeed. Join me to explore factors in running and selecting games, ensuring they serve as effective teaching tools. Learn to maintain focus on learning objectives while playing, and how to measure the ROI of gaming in education. Discover strategies for pitching gaming to leadership. This session offers insights, tips, and examples for coaches, team leads, and enterprise leaders seeking to teach from simple to complex concepts.
First Steps with Globus Compute Multi-User EndpointsGlobus
In this presentation we will share our experiences around getting started with the Globus Compute multi-user endpoint. Working with the Pharmacology group at the University of Auckland, we have previously written an application using Globus Compute that can offload computationally expensive steps in the researcher's workflows, which they wish to manage from their familiar Windows environments, onto the NeSI (New Zealand eScience Infrastructure) cluster. Some of the challenges we have encountered were that each researcher had to set up and manage their own single-user globus compute endpoint and that the workloads had varying resource requirements (CPUs, memory and wall time) between different runs. We hope that the multi-user endpoint will help to address these challenges and share an update on our progress here.
Understanding Globus Data Transfers with NetSageGlobus
NetSage is an open privacy-aware network measurement, analysis, and visualization service designed to help end-users visualize and reason about large data transfers. NetSage traditionally has used a combination of passive measurements, including SNMP and flow data, as well as active measurements, mainly perfSONAR, to provide longitudinal network performance data visualization. It has been deployed by dozens of networks world wide, and is supported domestically by the Engagement and Performance Operations Center (EPOC), NSF #2328479. We have recently expanded the NetSage data sources to include logs for Globus data transfers, following the same privacy-preserving approach as for Flow data. Using the logs for the Texas Advanced Computing Center (TACC) as an example, this talk will walk through several different example use cases that NetSage can answer, including: Who is using Globus to share data with my institution, and what kind of performance are they able to achieve? How many transfers has Globus supported for us? Which sites are we sharing the most data with, and how is that changing over time? How is my site using Globus to move data internally, and what kind of performance do we see for those transfers? What percentage of data transfers at my institution used Globus, and how did the overall data transfer performance compare to the Globus users?
Climate Science Flows: Enabling Petabyte-Scale Climate Analysis with the Eart...Globus
The Earth System Grid Federation (ESGF) is a global network of data servers that archives and distributes the planet’s largest collection of Earth system model output for thousands of climate and environmental scientists worldwide. Many of these petabyte-scale data archives are located in proximity to large high-performance computing (HPC) or cloud computing resources, but the primary workflow for data users consists of transferring data, and applying computations on a different system. As a part of the ESGF 2.0 US project (funded by the United States Department of Energy Office of Science), we developed pre-defined data workflows, which can be run on-demand, capable of applying many data reduction and data analysis to the large ESGF data archives, transferring only the resultant analysis (ex. visualizations, smaller data files). In this talk, we will showcase a few of these workflows, highlighting how Globus Flows can be used for petabyte-scale climate analysis.
Multiple Your Crypto Portfolio with the Innovative Features of Advanced Crypt...Hivelance Technology
Cryptocurrency trading bots are computer programs designed to automate buying, selling, and managing cryptocurrency transactions. These bots utilize advanced algorithms and machine learning techniques to analyze market data, identify trading opportunities, and execute trades on behalf of their users. By automating the decision-making process, crypto trading bots can react to market changes faster than human traders
Hivelance, a leading provider of cryptocurrency trading bot development services, stands out as the premier choice for crypto traders and developers. Hivelance boasts a team of seasoned cryptocurrency experts and software engineers who deeply understand the crypto market and the latest trends in automated trading, Hivelance leverages the latest technologies and tools in the industry, including advanced AI and machine learning algorithms, to create highly efficient and adaptable crypto trading bots
Designing for Privacy in Amazon Web ServicesKrzysztofKkol1
Data privacy is one of the most critical issues that businesses face. This presentation shares insights on the principles and best practices for ensuring the resilience and security of your workload.
Drawing on a real-life project from the HR industry, the various challenges will be demonstrated: data protection, self-healing, business continuity, security, and transparency of data processing. This systematized approach allowed to create a secure AWS cloud infrastructure that not only met strict compliance rules but also exceeded the client's expectations.
Modern design is crucial in today's digital environment, and this is especially true for SharePoint intranets. The design of these digital hubs is critical to user engagement and productivity enhancement. They are the cornerstone of internal collaboration and interaction within enterprises.
Unleash Unlimited Potential with One-Time Purchase
BoxLang is more than just a language; it's a community. By choosing a Visionary License, you're not just investing in your success, you're actively contributing to the ongoing development and support of BoxLang.
How Does XfilesPro Ensure Security While Sharing Documents in Salesforce?XfilesPro
Worried about document security while sharing them in Salesforce? Fret no more! Here are the top-notch security standards XfilesPro upholds to ensure strong security for your Salesforce documents while sharing with internal or external people.
To learn more, read the blog: https://www.xfilespro.com/how-does-xfilespro-make-document-sharing-secure-and-seamless-in-salesforce/
Exploring Innovations in Data Repository Solutions - Insights from the U.S. G...Globus
The U.S. Geological Survey (USGS) has made substantial investments in meeting evolving scientific, technical, and policy driven demands on storing, managing, and delivering data. As these demands continue to grow in complexity and scale, the USGS must continue to explore innovative solutions to improve its management, curation, sharing, delivering, and preservation approaches for large-scale research data. Supporting these needs, the USGS has partnered with the University of Chicago-Globus to research and develop advanced repository components and workflows leveraging its current investment in Globus. The primary outcome of this partnership includes the development of a prototype enterprise repository, driven by USGS Data Release requirements, through exploration and implementation of the entire suite of the Globus platform offerings, including Globus Flow, Globus Auth, Globus Transfer, and Globus Search. This presentation will provide insights into this research partnership, introduce the unique requirements and challenges being addressed and provide relevant project progress.
Enhancing Research Orchestration Capabilities at ORNL.pdfGlobus
Cross-facility research orchestration comes with ever-changing constraints regarding the availability and suitability of various compute and data resources. In short, a flexible data and processing fabric is needed to enable the dynamic redirection of data and compute tasks throughout the lifecycle of an experiment. In this talk, we illustrate how we easily leveraged Globus services to instrument the ACE research testbed at the Oak Ridge Leadership Computing Facility with flexible data and task orchestration capabilities.
Strategies for Successful Data Migration Tools.pptxvarshanayak241
Data migration is a complex but essential task for organizations aiming to modernize their IT infrastructure and leverage new technologies. By understanding common challenges and implementing these strategies, businesses can achieve a successful migration with minimal disruption. Data Migration Tool like Ask On Data play a pivotal role in this journey, offering features that streamline the process, ensure data integrity, and maintain security. With the right approach and tools, organizations can turn the challenge of data migration into an opportunity for growth and innovation.
In software engineering, the right architecture is essential for robust, scalable platforms. Wix has undergone a pivotal shift from event sourcing to a CRUD-based model for its microservices. This talk will chart the course of this pivotal journey.
Event sourcing, which records state changes as immutable events, provided robust auditing and "time travel" debugging for Wix Stores' microservices. Despite its benefits, the complexity it introduced in state management slowed development. Wix responded by adopting a simpler, unified CRUD model. This talk will explore the challenges of event sourcing and the advantages of Wix's new "CRUD on steroids" approach, which streamlines API integration and domain event management while preserving data integrity and system resilience.
Participants will gain valuable insights into Wix's strategies for ensuring atomicity in database updates and event production, as well as caching, materialization, and performance optimization techniques within a distributed system.
Join us to discover how Wix has mastered the art of balancing simplicity and extensibility, and learn how the re-adoption of the modest CRUD has turbocharged their development velocity, resilience, and scalability in a high-growth environment.
How Recreation Management Software Can Streamline Your Operations.pptxwottaspaceseo
Recreation management software streamlines operations by automating key tasks such as scheduling, registration, and payment processing, reducing manual workload and errors. It provides centralized management of facilities, classes, and events, ensuring efficient resource allocation and facility usage. The software offers user-friendly online portals for easy access to bookings and program information, enhancing customer experience. Real-time reporting and data analytics deliver insights into attendance and preferences, aiding in strategic decision-making. Additionally, effective communication tools keep participants and staff informed with timely updates. Overall, recreation management software enhances efficiency, improves service delivery, and boosts customer satisfaction.
TROUBLESHOOTING 9 TYPES OF OUTOFMEMORYERRORTier1 app
Even though at surface level ‘java.lang.OutOfMemoryError’ appears as one single error; underlyingly there are 9 types of OutOfMemoryError. Each type of OutOfMemoryError has different causes, diagnosis approaches and solutions. This session equips you with the knowledge, tools, and techniques needed to troubleshoot and conquer OutOfMemoryError in all its forms, ensuring smoother, more efficient Java applications.
We describe the deployment and use of Globus Compute for remote computation. This content is aimed at researchers who wish to compute on remote resources using a unified programming interface, as well as system administrators who will deploy and operate Globus Compute services on their research computing infrastructure.
Your Digital Assistant.
Making complex approach simple. Straightforward process saves time. No more waiting to connect with people that matter to you. Safety first is not a cliché - Securely protect information in cloud storage to prevent any third party from accessing data.
Would you rather make your visitors feel burdened by making them wait? Or choose VizMan for a stress-free experience? VizMan is an automated visitor management system that works for any industries not limited to factories, societies, government institutes, and warehouses. A new age contactless way of logging information of visitors, employees, packages, and vehicles. VizMan is a digital logbook so it deters unnecessary use of paper or space since there is no requirement of bundles of registers that is left to collect dust in a corner of a room. Visitor’s essential details, helps in scheduling meetings for visitors and employees, and assists in supervising the attendance of the employees. With VizMan, visitors don’t need to wait for hours in long queues. VizMan handles visitors with the value they deserve because we know time is important to you.
Feasible Features
One Subscription, Four Modules – Admin, Employee, Receptionist, and Gatekeeper ensures confidentiality and prevents data from being manipulated
User Friendly – can be easily used on Android, iOS, and Web Interface
Multiple Accessibility – Log in through any device from any place at any time
One app for all industries – a Visitor Management System that works for any organisation.
Stress-free Sign-up
Visitor is registered and checked-in by the Receptionist
Host gets a notification, where they opt to Approve the meeting
Host notifies the Receptionist of the end of the meeting
Visitor is checked-out by the Receptionist
Host enters notes and remarks of the meeting
Customizable Components
Scheduling Meetings – Host can invite visitors for meetings and also approve, reject and reschedule meetings
Single/Bulk invites – Invitations can be sent individually to a visitor or collectively to many visitors
VIP Visitors – Additional security of data for VIP visitors to avoid misuse of information
Courier Management – Keeps a check on deliveries like commodities being delivered in and out of establishments
Alerts & Notifications – Get notified on SMS, email, and application
Parking Management – Manage availability of parking space
Individual log-in – Every user has their own log-in id
Visitor/Meeting Analytics – Evaluate notes and remarks of the meeting stored in the system
Visitor Management System is a secure and user friendly database manager that records, filters, tracks the visitors to your organization.
"Secure Your Premises with VizMan (VMS) – Get It Now"
Enrich Visually Google Map Information With Layers
1. | Visually Enrich Google Maps Information using Layers
Visually Enrich Google
Maps Information using
Layers
2. | Visually Enrich Google Maps Information using Layers| Visually Enrich Google Maps Information using Layers
Pedro
Coelho
Team Leader | OutSystems MVP | Truewind
@
in
pedro.coelho@truewindglobal.com
/pmscoelho
3. | Visually Enrich Google Maps Information using Layers| Visually Enrich Google Maps Information using Layers
The challenge
4. | Visually Enrich Google Maps Information using Layers
Geographic
Information
Business
Information
Interactive
Experience
5. | Visually Enrich Google Maps Information using Layers| Visually Enrich Google Maps Information using Layers
Introducing KML
6. | Visually Enrich Google Maps Information using Layers
KML is a file format used to display
geographic data in an map. You
can create KML files to show:
● Placemarks
● Ground Overlays
● Paths
● Polygons
● and more...
7. | Visually Enrich Google Maps Information using Layers
Simple KML sample
8. | Visually Enrich Google Maps Information using Layers| Visually Enrich Google Maps Information using Layers
KML + OutSystems
9. | Visually Enrich Google Maps Information using Layers
In the Forge you will find two
extensions for Google Maps, using
this components you can:
● Load a KML;
● For each KML sector you can:
■ Customize the color of each
sector
■ Add a custom marker
■ Add an icon badge
■ Show InfoWindow
10. | Visually Enrich Google Maps Information using Layers
We extended the official
OutSystems components with the
standard Google Maps API
11. | Visually Enrich Google Maps Information using Layers| Visually Enrich Google Maps Information using Layers
Show me the code!
12. | Visually Enrich Google Maps Information using Layers| Visually Enrich Google Maps Information using Layers
In the real world
13. | Visually Enrich Google Maps Information using Layers
Monitor in real time the execution of
different jobs performed by our client.
Show relevant information on infowindow,
such as links, values, descriptions or even a
redirect to another screen.
Show lines and markers with different
images and colors determined by the state
of execution of the work.
14. | Visually Enrich Google Maps Information using Layers| Visually Enrich Google Maps Information using Layers
15. | Visually Enrich Google Maps Information using Layers| Visually Enrich Google Maps Information using Layers
16. | Visually Enrich Google Maps Information using Layers| Visually Enrich Google Maps Information using Layers
17. | Visually Enrich Google Maps Information using Layers| Visually Enrich Google Maps Information using Layers
18. | Visually Enrich Google Maps Information using Layers
Thank You!
@ inpedro.coelho@truewindglobal.co
m
/pmscoelho
Editor's Notes
Hello everyone,
In this session I will be talking about how you can use google maps layers to create rich interactive experiences based on geographic information
So, let me start with the challenge that started it all
We started working with some clients that had rich geographic information, but that informations was mostly static.
The main challenge was to be able to mash up this geographic information with up to date business data residing in OutSystems applications.
Also it was important to create interactive experiences that would allow the users to interact with the mashed up information and be able to get even more insights and also act upon it.
The solution was to take advantage one of the most common formats to share geographic information in the Web, KML.
So, what is KML?
For those who might not know,
KML is a XML based file format used to display geographic data.
You can create KML files to pinpoint locations, add image overlays, and expose rich data in new ways.
It’s important to refer that KML is an international standard widely used in geographic information systems.
Most tools like ArcGis allow to export the data to KML.
Just for you to have an idea, this is how placemark is represented in a KML file, just the typical XML elements and attributes, pretty straightforward
Now you might be asking:
How can I take advantage of KML in OutSystems?
We have built 2 components, one for Web and other for Mobile, and they are both available in the OutSystems Forge.
These components will give you a set of actions to enable you to load KML layers into a Google Map and also interact with the layers’ sections, such as:
Customize the colors of the sectors
Add custom markers
Add icon badges
Show a InfoWindow
We’re still working on a sample application, but it will be available soon.
All of this was done on top of the official OutSystems Google Maps components as an add-on, and using the standard Google Maps API code.
This means several things:
you can easily start using KML Layers in an already built application that uses the OutSystems Google Maps components
the components are reliable and suitable for enterprise applications
the components are future proof
Enough with the talk!
This is a technical session so let's see how you can use this
To setup the component all you need to do is add the kmlforgooglemaps weblock to your screen that already has a google maps
show that you just need to add the weblock to your screen
But let me show you the most important thing, how can we mashup the KML layer geographic data with our own application data
In the projects we have been doing, the client already had the base geographic information needed created in ArcGis.
So, all we needed to do was to have some IDs in the elements of the KML that we could also use in our own application data to connect both
show the data model of the placemark with the placemark_id
show the excel file that contains the bootstraped data, this will be your application data
show the KML source and how the ids or names match, this will be given to you by your client
How do we load this on a map
show the load kml screen action
I bet all of this sounds great to you…
but what you would really like would be to see this cool features in a real application, right?
Ok, here it goes:
We have helped a client in the area of civil engineering by designing and delivering an application to manage the entire project lifecycle.
These were large scale engineering projects such as water and sanitation that, as you can imagine, occur in a wide geographical area.
Several features of the application rely on geographical information, such as displaying the entire project in a map, and showing the several project sections execution status.
For instance, you can see all the construction sections of an entire sewer system, and for each section, see contextual business information.
In the next slides we will show you some examples of an application, even though we had to remove some of the context and the real data, it will enable you to get an idea of what can be achieved.
Keep in mind that the original KML only has the sections mapped all in one color, everything else you see is done in our app by querying our database and manipulating the layer.
In this image you can see the several section of a construction project.
The different colors represent the current state of each section.
You can also see 2 markers that indicate actions are needed for those specific sections.
In this example you can see the use of an InfoWindow that shows an iframe to an OutSystems page.
When a user clicks a sections he will be able to see some information like the street name, the type of construction, used items, state of the construction and other important information.
Here you can see the filters the user can apply to the KML layer.
The buttons and the filters are actualy OutSystems widgets put on top the map using CSS to give an integrated user experience.
Technicly the filters will do a query to the application database, and with the returned result the layer API will be called to show or hide the relevant section.
In this last image image we also used the same technic of the previous example to show some information about the layer that is being shown.
In this case we present some chats with evolution of the entire construction project.
You have a lot of options you can explore.
I hope that you learned something useful with this session.
If you have any questions reach out to me during the conference or drop me an email and I will gladly answer you.