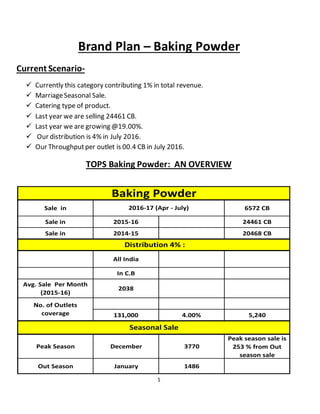
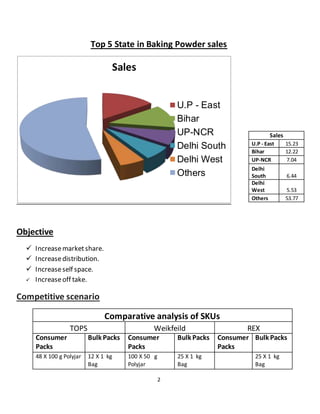
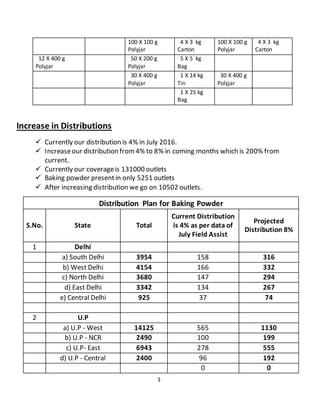
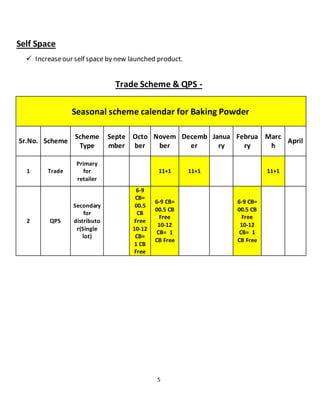
This document provides an overview and strategic plan for increasing market share of TOPS brand baking powder in India. Currently baking powder contributes 1% to total revenue and distribution is at 4% of outlets. The plan aims to double distribution to 8% of outlets, increase sales 100% through higher distribution to 48832 cases annually, and expand self-space with new products. Key strategies include seasonal trade schemes and quarterly performance schemes to boost retailer and distributor performance.
Daily Retailer Outlet Performance Management System (DROPMS)Md. Mainul Islam
Here is a Daily Retailer Outlet Performance Management System “DROPMS” report which is provided live data about Market, Product and Sales etc. So you can see your left side where a table has the many category wise market with many different periods and the middle graph is showing about contribution of brand compare with previous to current year and the last one is product Growth which is measuring by the retailer outlet.
Now we provide in this chart (Outlet Name, Address, Contact No, Category Channel, Market, Category Product, Product, Brand Description, Item Description, Comparison sales and percentage with previous to current year share and Growth).
This report based on retailer outlet. Actually we wanted to show you what we do sell that was really actual sales or it was just for distributor achieved their target and got their target rewards? No! We don’t need fake sales but need actual sales that we can measure and forecast our marketing plan, budget, production, expenditure etc.
So you can work in live and comparison with any market, any category product, any product, any period of time. In this report have many opportunities to convert any business plan, offer, program etc.
Hopefully you will enjoy it to apply in your work and if you want to know details about in this report please let me. I am waiting to assist you.
Note : “Collect more outlet and gain more strategy”.
Livestock Research SMF Unit - Final Presentation April 10, 2018Lakeland College
Final presentation of the livestock research unit of Lakeland College's Student-managed Farm (SMF) powered by New Holland.
The student-managed course in animal science technology sees 2nd year students work in one of the livestock unit.
Each team reports on marketing, production and other parts of their unit's business.
Mid-term and final presentations are done in Alumni Hall on the Vermilion campus.
Know about various natural products available that helps in skin whitening. All the natural methods are listed in the presentation which can be followed daily without much effort.
K-12 Module in TLE - ICT Grade 10 [All Gradings]Daniel Manaog
==========================================
K-12 Module in TLE-9 ICT [All Gradings]
Want to Download?
Click the Download at the bottom of the Slideshare :)
==========================================
Presented at the Pulses for Sustainable Agriculture and Human Health” on 31 May-1 June 2016 at NASC, New Delhi, India. The conference was jointly organised by the International Food Policy Research Institute (IFPRI), National Academy of Agricultural Sciences (NAAS), TCi of Cornell University (TCi-CU) and Agriculture Today.
Epic research weekly agri report 28th march 2016Epic Research
Epic Research Private Limited is the Service Excellence Award Winner Financial Advisory Firm, known for the best consultation services regarding Capital Stock Market of India and other global markets.
The slides explain why pulses production in India stagnant over the years and how we can overcome the supply side bottlenecks to meet the growing demand by 2020 and 2015.
Cox Automotive Market Insight Overview February 2019Philip Nothard
“Welcome to the latest Market Insight Overview from Cox Automotive.
Every month, we provide automotive industry professionals with unique intelligence, supported by invaluable insight and market sentiment from our customers, that goes beyond the headlines to uncover what’s driving the new and used car sectors from wholesale, retail and funding perspectives. We hope our holistic analysis arms you with the essential knowledge needed to navigate the fast-paced, ever-changing automotive market.”
PHILIP NOTHARD Customer Insight & Strategy Director - UK
1. 1
Brand Plan – Baking Powder
Current Scenario-
Currently this category contributing 1% in total revenue.
MarriageSeasonal Sale.
Catering type of product.
Last year we are selling 24461 CB.
Last year we are growing @19.00%.
Our distribution is 4% in July 2016.
Our Throughputper outlet is 00.4 CB in July 2016.
TOPS Baking Powder: AN OVERVIEW
Sale in 6572 CB
Sale in 2015-16 24461 CB
Sale in 2014-15 20468 CB
All India
In C.B
Avg. Sale Per Month
(2015-16)
2038
131,000 4.00% 5,240
Peak Season December 3770
Peak season sale is
253 % from Out
season sale
Out Season January 1486
Baking Powder
Seasonal Sale
Distribution 4% :
2016-17 (Apr - July)
No. of Outlets
coverage
2. 2
Top 5 State in Baking Powder sales
Objective
Increasemarketshare.
Increasedistribution.
Increaseself space.
Increaseoff take.
Competitive scenario
Comparative analysis of SKUs
TOPS Weikfeild REX
Consumer
Packs
Bulk Packs Consumer
Packs
Bulk Packs Consumer
Packs
Bulk Packs
48 X 100 g Polyjar 12 X 1 kg
Bag
100 X 50 g
Polyjar
25 X 1 kg
Bag
25 X 1 kg
Bag
Sales
U.P - East
Bihar
UP-NCR
Delhi South
Delhi West
Others
Sales
U.P - East 15.23
Bihar 12.22
UP-NCR 7.04
Delhi
South 6.44
Delhi
West 5.53
Others 53.77
3. 3
100 X 100 g
Polyjar
4 X 3 kg
Carton
100 X 100 g
Polyjar
4 X 3 kg
Carton
12 X 400 g
Polyjar
50 X 200 g
Polyjar
5 X 5 kg
Bag
30 X 400 g
Polyjar
1 X 14 kg
Tin
30 X 400 g
Polyjar
1 X 25 kg
Bag
Increase in Distributions
Currently our distribution is 4% in July 2016.
Increaseour distribution from4% to 8% in coming months which is 200% from
current.
Currently our coverageis 131000 outlets
Baking powder presentin only 5251 outlets
After increasing distribution we go on 10502 outlets.
Distribution Plan for Baking Powder
S.No. State Total
Current Distribution
is 4% as per data of
July Field Assist
Projected
Distribution 8%
1 Delhi
a) South Delhi 3954 158 316
b) West Delhi 4154 166 332
c) North Delhi 3680 147 294
d) East Delhi 3342 134 267
e) Central Delhi 925 37 74
2 U.P
a) U.P - West 14125 565 1130
b) U.P - NCR 2490 100 199
c) U.P- East 6943 278 555
d) U.P - Central 2400 96 192
0 0
5. 5
Self Space
Increaseour self space by new launched product.
Trade Scheme & QPS -
Seasonal scheme calendar for Baking Powder
Sr.No. Scheme
Scheme
Type
Septe
mber
Octo
ber
Novem
ber
Decemb
er
Janua
ry
Februa
ry
Marc
h
April
1 Trade
Primary
for
retailer
11+1 11+1 11+1
2 QPS
Secondary
for
distributo
r(Single
lot)
6-9
CB=
00.5
CB
Free
10-12
CB=
1 CB
Free
6-9 CB=
00.5 CB
Free
10-12
CB= 1
CB Free
6-9 CB=
00.5 CB
Free
10-12
CB= 1
CB Free