
Recommended
More Related Content
Similar to Daily Retailer Outlet Performance Management System (DROPMS)
Similar to Daily Retailer Outlet Performance Management System (DROPMS) (20)
Recently uploaded
Recently uploaded (20)
Daily Retailer Outlet Performance Management System (DROPMS)
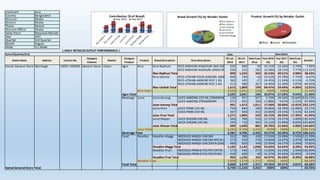
- 1. Continent Asia Country Bangladesh Division Dhaka District Dhaka Thana Ramna Division Office Dhaka Sales Point Mouchak Market Year (All) Quarter 3rd Quarter Month August Week 1st Week | DAILY RETAILER OUTLET PERFORMANCE | Sum ofQuantity (Pcs) Date Outlet Name Address Contact No. Category Channel Market Caregory Product Product Brand Description Item Description 05-Jul- 2016 05-Jul- 2017 Gain/Loss (Pcs) Year 2016 (%) Year 2017 (%) Gain/Loss (%) Growth Kamal General Store Malibagh 10001-200002 General Store Urban Agro Rice Rice-Radhuni RICE-RADHUNI-KHACHURI MIX 500 GM630 680 50 25.15% 22.36% -2.79% 7.94% RICE-RADHUNI-RADHUNI JORDA MIX 260 552 292 10.38% 18.15% 7.77% 112.31% Rice-Radhuni Total 890 1,232 342 35.53% 40.51% 4.98% 38.43% Rice-Utshab RICE-UTSHAB-FOUR SEASONS BASMOTI 1KG840 784 -56 33.53% 25.78% -7.75% -6.67% RICE-UTSHAB-JASMINE RICE 1 KG 362 345 -17 14.45% 11.34% -3.11% -4.70% RICE-UTSHAB-JASMINE RICE 5 KG 413 680 267 16.49% 22.36% 5.87% 64.65% Rice-Utshab Total 1,615 1,809 194 64.47% 59.49% -4.98% 12.01% Rice Total 2,505 3,041 536 100% 100% 21.40% Agro Total 2,505 3,041 536 36.87% 27.33% -9.54% 21.40% Beverage Juice Juice-Aarong JUICE-AARONG-250 ML (TAMARIND) 130 957 827 5.70% 20.34% 14.64% 636.15% JUICE-AARONG-STRAWBERRY 271 455 184 11.88% 9.67% -2.21% 67.90% Juice-Aarong Total 401 1,412 1,011 17.58% 30.00% 12.42% 252.12% Juice-Pran JUICE-PRAN-125 ML 704 884 180 30.86% 18.78% -12.08% 25.57% JUICE-PRAN-250 ML 567 920 353 24.86% 19.55% -5.31% 62.26% Juice-Pran Total 1,271 1,804 533 55.72% 38.33% -17.39% 41.94% Juice-Shezan JUICE-SHEZAN-200 ML 264 780 516 11.57% 16.57% 5.00% 195.45% JUICE-SHEZAN-250 ML 345 710 365 15.12% 15.09% -0.04% 105.80% Juice-Shezan Total 609 1,490 881 26.70% 31.66% 4.96% 144.66% Juice Total 2,281 4,706 2,425 100% 100% 106.31% Beverage Total 2,281 4,706 2,425 33.57% 42.30% 8.72% 106.31% Food Noodles Noodles-Maggi NOODLES-MAGGI-248 GM 352 780 428 17.53% 23.08% 5.55% 121.59% NOODLES-MAGGI-248 GM SPCIAL OFFER273 543 270 13.60% 16.07% 2.47% 98.90% NOODLES-MAGGI-CHICKEN N 260G 480 820 340 23.90% 24.27% 0.36% 70.83% Noodles-Maggi Total 1,105 2,143 1,038 55.03% 63.42% 8.39% 93.94% Noodles-Pran NOODLES-PRAN-8 PCS PKT OFFER 273 546 273 13.60% 16.16% 2.56% 100.00% NOODLES-PRAN-8 PCS POLYPACK 630 690 60 31.37% 20.42% -10.95% 9.52% Noodles-Pran Total 903 1,236 333 44.97% 36.58% -8.39% 36.88% Noodles Total 2,008 3,379 1,371 100% 100% 68.28% Food Total 2,008 3,379 1,371 29.56% 30.37% 0.81% 68.28% Kamal General Store Total 6,794 11,126 4,332 100% 100% 63.76% SalesShare 35.53% 64.47% 17.58% 55.72% 26.70% 55.03% 44.97% 40.51% 59.49% 30.00% 38.33% 31.66% 63.42% 36.58% Contribution (% of Brand) Year 2016 Year 2017 11% 54% 35% Product Growth (%) by Retailer Outlet Rice Juice Noodles 6%2% 41% 7% 23% 15%6% Brand Growth (%) by Retailer Outlet Rice-Radhuni Rice-Utshab Juice-Aarong Juice-Pran Juice-Shezan Noodles-Maggi