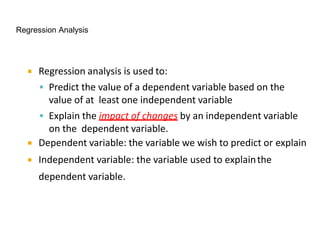
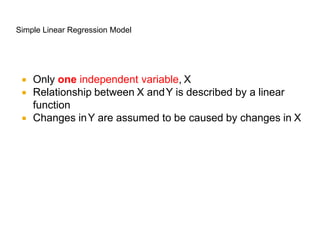
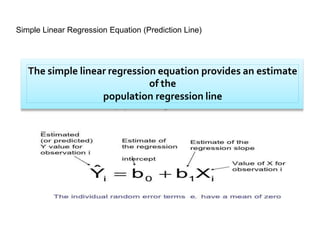
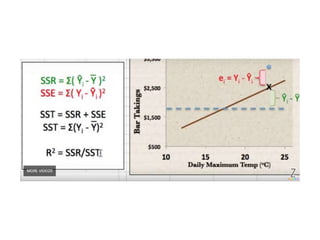
What is Regression? | SSE, SSR, SST | R-
squared | Errors (ε vs. e)
Regression Analysis
 Regression analysis is used to:
 Predict the value of a dependent variable based on the
value of at least one independent variable
 Explain the impact of changes by an independent variable
on the dependent variable.
 Dependent variable: the variable we wish to predict or explain
 Independent variable: the variable used to explainthe
dependent variable.
Simple Linear Regression Model
 Only one independent variable, X
 Relationship between X andY is described by a linear
function
 Changes inY are assumed to be caused by changes in X
Simple Linear Regression Model
Simple Linear Regression Equation (Prediction Line)
The simple linear regression equation provides an estimate
of the
population regression line
Rsquare = Explained variation / Total Variation
Value is between 0 and 1
Rsquare – Coefficient of Determination
Multiple Regression
 Multiple regression analysis
 with more than one independent variable. It is used to
quantify the influence of two or more variable. For
instance, simple (univariate) linear regression explains
the variation in Sales of the product in terms of the
variation in advertising as measured by beta.
 With multiple regression, Sales can be regressed
against beta and against additional variables, such as
Sales Promotion, brand Image, and market growth ,
that might influence Sales.
Multiple Regression
Method of least Squares
Coefficients by Method of Least Squares
Topic 6 Linear Regression.pptx

Topic 6 Linear Regression.pptx

  • 1.
    What is Regression?| SSE, SSR, SST | R- squared | Errors (ε vs. e)
  • 2.
    Regression Analysis  Regressionanalysis is used to:  Predict the value of a dependent variable based on the value of at least one independent variable  Explain the impact of changes by an independent variable on the dependent variable.  Dependent variable: the variable we wish to predict or explain  Independent variable: the variable used to explainthe dependent variable.
  • 3.
    Simple Linear RegressionModel  Only one independent variable, X  Relationship between X andY is described by a linear function  Changes inY are assumed to be caused by changes in X
  • 4.
  • 5.
  • 6.
    Simple Linear RegressionEquation (Prediction Line) The simple linear regression equation provides an estimate of the population regression line
  • 10.
    Rsquare = Explainedvariation / Total Variation Value is between 0 and 1 Rsquare – Coefficient of Determination
  • 14.
    Multiple Regression  Multipleregression analysis  with more than one independent variable. It is used to quantify the influence of two or more variable. For instance, simple (univariate) linear regression explains the variation in Sales of the product in terms of the variation in advertising as measured by beta.  With multiple regression, Sales can be regressed against beta and against additional variables, such as Sales Promotion, brand Image, and market growth , that might influence Sales.
  • 15.
  • 16.
  • 17.
    Coefficients by Methodof Least Squares