Date: August 21st 2013
By: Jean-Frédéric Nault
Olivier Fortier
Chrome Dev Tools
Fast Web Development Tools
Performance Analysis Tools
&
Fast Web Develoment Tools
● Elements Inspector
● CSS Inspector
● Javascript Console
● Managing Storage (webSql, IndexedDb, Local/Session Storage, Cookies)
Performance Analysis Tools
● Auditing Tools
● Network activities
● Cpu Usage
● Rendering
● Memory Profiling
Chrome's Development Tool
• CTRL-SHIFT-I to unleash the awesomeness
Elements
Inspect the source of the page
●
Add/edit/delete HTML tags or text
●
Computed style menu → Where do the styles come from for the selected
element?
Styles
●
Enable/disable/add/edit/delete CSS rules
Metric
●
Box model of the element
Elements
Properties
●
Edit/delete HTML tags properties
Event Listeners
●
Visualize event listeners of the page
Resource
Network
●
Loads all the resources used in the page
Status
●
Shows status code (200, 304, 404)
●
Not Modified = Resource is cached
Size
●
Size = Size of the response
●
Content = Size of the resource itself
Time
●
Time = Time for resource to load
●
Latency = Time between initial request and server's first response
Timeline
●
DNS Lookup : Time spent looking up for the website's IP
●
Connecting : Time spent connecting to that server's IP
●
Sending : Time taken to send the request to server
●
Waiting : Time spent waiting for response from server
●
Receiving : Time taken to receive the resource from server
Network
●
Loads all the resources used in the page
●
First element loaded is the document. It shows the initial request and the parsing time
Status
●
Shows status code (200, 304, 404)
●
Not Modified = Resource is cached
Size
●
Size = Size of the response
●
Content = Size of the resource itself
Time
●
Time = Time for resource to load
●
Latency = Time between initial request and server's first response
Network
Timeline
3 colors for timeline elements :
●
Blue : Document
●
Green : CSS
●
Violet : Images
●
Orange : Scripts
Timeline statuses and information
DNS Lookup : Time spent looking up for the website's IP
Connecting : Time spent connecting to that server's IP
Sending : Time taken to send the request to server
Waiting : Time spent waiting for response from server
Receiving : Time taken to receive the resource from server
Notice the blue and red lines
- Blue line shows when Document Ready event is triggered
- Red line shows when Windows.Load event is triggered
Network
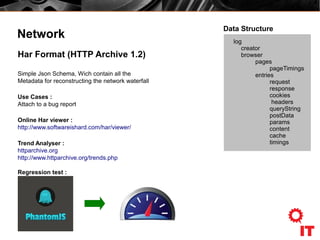
Har Format (HTTP Archive 1.2)
Simple Json Schema, Wich contain all the
Metadata for reconstructing the network waterfall
Use Cases :
Attach to a bug report
Online Har viewer :
http://www.softwareishard.com/har/viewer/
Trend Analyser :
httparchive.org
http://www.httparchive.org/trends.php
Regression test :
log
creator
browser
pages
pageTimings
entries
request
response
cookies
headers
queryString
postData
params
content
cache
timings
Data Structure
Sources
●
Basically shows the source code of the page
●
For people who start crying when seeing a minified javascript source, know
that the Pretty Print button might make you smile. Just click here : { }
Performance Analysis Tools
The Timeline
Performance Analysis Tools
The Timeline
Gives you a performance overview
● Memory usage
● Occuring Events
● Rendering
Highlights performance bottlenecks
● Javascript
● Paint time / Reflow
● Etc...
Performance Analysis Tools
The Timeline
● Events (shows all recorded events by event category)
● Frames (shows your page's rendering performance)
● Memory (shows your page's memory usage over time)
Performance Analysis Tools
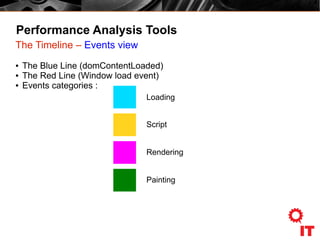
The Timeline – Events view
● The Blue Line (domContentLoaded)
● The Red Line (Window load event)
● Events categories :
Loading
Script
Rendering
Painting
Performance Analysis Tools
The Timeline – Frame view
It's all about Rendering Performance
60hz = 60 frame per seconde = 1/60 sec = 16.66666 ms
16 ms per frame!!!
Performance Analysis Tools
The Timeline – Frame view
By the way...
RequestAnimationFrame = good
SetTimeOut / interval = bad
http://athousandnodes.com/article/using-requestanimationframe-web-browser-animations-instead-settimeout
Profiles
You can gather different kind of information by selecting different profiles and recording
what's happening on page load.
Collect JavaScript CPU profile
●
Shows where the execution time is spent in your JS functions
Collect CSS Selector profile
●
Shows how long the selector matching has taken in total and how many times a
certain selection has matched Dom element.
Heap Snapshot
●
Inspecting memory usage of a given page at a given time
Performance Analysis Tools
Profile – Heap Snapshot
Object Graph
● Root
● Primary type (boolean,nb,string)
● Object (Key Value)
● Retaining tree
● Distance
● Shallow Size
● Retained Size
Few Terms
Memory leak can
occur, When you keep
a retaining path to a
node by accident
Performance Analysis Tools
Profile – Heap Snapshot
4 Differents Views
Summary
Tracking down specific objects based on their “type” (constructor name), because it
shows objects in memory grouped by their constructor name.
Comparison
This view is the best way to verify that deletion is working properly.
Containment
This view is good for analyzing objects that are referenced in the global namespace…
basically anything you put on the global window variable.
Dominator
This view is a good way to verify that your references are all properly contained (no
unexpected references hanging around), and that deleting things is really working
!!! USE THIS IN INCOGNITO!!!
Audits
The Audits panel analyses page as it loads and provides suggestions and optimizations
to decrease page load time and increase responsiveness.
Provides audits for
●
Network utilization
●
Web page performance
●
Other audits you might want to add
More complete audits using PageSpeed
PageSpeed
●
Free-to-download plugin
●
Much more complete version of the Web Page Performance Analyzer from the
« Audits » tab.
●
Gives you very precise hints on what to do to improve site's performance.
●
Shows actual results of analysis, and sometimes it even does the work of improving
things for you.
●
Minify HTML/CSS/JS → Tells you by how much % you could reduce page size by
compressing/minifying these files.
●
Optimize images → Actually compresses it for you and provides a link to the
optimized image! (Warning : Some compressed image that are provided might have a
huge quality drop, even if it says « lossless compression », so it's still a case by case
process.
To download Page Speed :
https://developers.google.com/speed/pagespeed/insights_extensions
Console
https://developers.google.com/chrome-developer-tools/docs/console
Chrome Devtool in remote !?
/opt/google/chrome/google-chrome --remoteebugging-port=9222 –incognito
TIPS!
For remote access :
ssh -L 0.0.0.0:9223:localhost:9222 localhost -N
Remote Debugging on Android
https://developers.google.com/chrome-developer-tools/docs/remote-debugging
Under the hood
Tracing!
Chrome://memory
Chrome://tracing
Console.time(key)
Console.timeEnd(key)
Devtool Extension

Tool it Up! - Session #2 - NetPanel

  • 1.
    Date: August 21st2013 By: Jean-Frédéric Nault Olivier Fortier
  • 2.
    Chrome Dev Tools FastWeb Development Tools Performance Analysis Tools &
  • 3.
    Fast Web DevelomentTools ● Elements Inspector ● CSS Inspector ● Javascript Console ● Managing Storage (webSql, IndexedDb, Local/Session Storage, Cookies)
  • 4.
    Performance Analysis Tools ●Auditing Tools ● Network activities ● Cpu Usage ● Rendering ● Memory Profiling
  • 5.
    Chrome's Development Tool •CTRL-SHIFT-I to unleash the awesomeness
  • 6.
    Elements Inspect the sourceof the page ● Add/edit/delete HTML tags or text ● Computed style menu → Where do the styles come from for the selected element? Styles ● Enable/disable/add/edit/delete CSS rules Metric ● Box model of the element
  • 7.
    Elements Properties ● Edit/delete HTML tagsproperties Event Listeners ● Visualize event listeners of the page
  • 8.
  • 9.
    Network ● Loads all theresources used in the page Status ● Shows status code (200, 304, 404) ● Not Modified = Resource is cached Size ● Size = Size of the response ● Content = Size of the resource itself Time ● Time = Time for resource to load ● Latency = Time between initial request and server's first response Timeline ● DNS Lookup : Time spent looking up for the website's IP ● Connecting : Time spent connecting to that server's IP ● Sending : Time taken to send the request to server ● Waiting : Time spent waiting for response from server ● Receiving : Time taken to receive the resource from server
  • 10.
    Network ● Loads all theresources used in the page ● First element loaded is the document. It shows the initial request and the parsing time Status ● Shows status code (200, 304, 404) ● Not Modified = Resource is cached Size ● Size = Size of the response ● Content = Size of the resource itself Time ● Time = Time for resource to load ● Latency = Time between initial request and server's first response
  • 11.
    Network Timeline 3 colors fortimeline elements : ● Blue : Document ● Green : CSS ● Violet : Images ● Orange : Scripts Timeline statuses and information DNS Lookup : Time spent looking up for the website's IP Connecting : Time spent connecting to that server's IP Sending : Time taken to send the request to server Waiting : Time spent waiting for response from server Receiving : Time taken to receive the resource from server Notice the blue and red lines - Blue line shows when Document Ready event is triggered - Red line shows when Windows.Load event is triggered
  • 12.
    Network Har Format (HTTPArchive 1.2) Simple Json Schema, Wich contain all the Metadata for reconstructing the network waterfall Use Cases : Attach to a bug report Online Har viewer : http://www.softwareishard.com/har/viewer/ Trend Analyser : httparchive.org http://www.httparchive.org/trends.php Regression test : log creator browser pages pageTimings entries request response cookies headers queryString postData params content cache timings Data Structure
  • 13.
    Sources ● Basically shows thesource code of the page ● For people who start crying when seeing a minified javascript source, know that the Pretty Print button might make you smile. Just click here : { }
  • 14.
  • 15.
    Performance Analysis Tools TheTimeline Gives you a performance overview ● Memory usage ● Occuring Events ● Rendering Highlights performance bottlenecks ● Javascript ● Paint time / Reflow ● Etc...
  • 16.
    Performance Analysis Tools TheTimeline ● Events (shows all recorded events by event category) ● Frames (shows your page's rendering performance) ● Memory (shows your page's memory usage over time)
  • 17.
    Performance Analysis Tools TheTimeline – Events view ● The Blue Line (domContentLoaded) ● The Red Line (Window load event) ● Events categories : Loading Script Rendering Painting
  • 18.
    Performance Analysis Tools TheTimeline – Frame view It's all about Rendering Performance 60hz = 60 frame per seconde = 1/60 sec = 16.66666 ms 16 ms per frame!!!
  • 19.
    Performance Analysis Tools TheTimeline – Frame view By the way... RequestAnimationFrame = good SetTimeOut / interval = bad http://athousandnodes.com/article/using-requestanimationframe-web-browser-animations-instead-settimeout
  • 20.
    Profiles You can gatherdifferent kind of information by selecting different profiles and recording what's happening on page load. Collect JavaScript CPU profile ● Shows where the execution time is spent in your JS functions Collect CSS Selector profile ● Shows how long the selector matching has taken in total and how many times a certain selection has matched Dom element. Heap Snapshot ● Inspecting memory usage of a given page at a given time
  • 21.
    Performance Analysis Tools Profile– Heap Snapshot Object Graph ● Root ● Primary type (boolean,nb,string) ● Object (Key Value) ● Retaining tree ● Distance ● Shallow Size ● Retained Size Few Terms Memory leak can occur, When you keep a retaining path to a node by accident
  • 22.
    Performance Analysis Tools Profile– Heap Snapshot 4 Differents Views Summary Tracking down specific objects based on their “type” (constructor name), because it shows objects in memory grouped by their constructor name. Comparison This view is the best way to verify that deletion is working properly. Containment This view is good for analyzing objects that are referenced in the global namespace… basically anything you put on the global window variable. Dominator This view is a good way to verify that your references are all properly contained (no unexpected references hanging around), and that deleting things is really working !!! USE THIS IN INCOGNITO!!!
  • 23.
    Audits The Audits panelanalyses page as it loads and provides suggestions and optimizations to decrease page load time and increase responsiveness. Provides audits for ● Network utilization ● Web page performance ● Other audits you might want to add More complete audits using PageSpeed
  • 24.
    PageSpeed ● Free-to-download plugin ● Much morecomplete version of the Web Page Performance Analyzer from the « Audits » tab. ● Gives you very precise hints on what to do to improve site's performance. ● Shows actual results of analysis, and sometimes it even does the work of improving things for you. ● Minify HTML/CSS/JS → Tells you by how much % you could reduce page size by compressing/minifying these files. ● Optimize images → Actually compresses it for you and provides a link to the optimized image! (Warning : Some compressed image that are provided might have a huge quality drop, even if it says « lossless compression », so it's still a case by case process. To download Page Speed : https://developers.google.com/speed/pagespeed/insights_extensions
  • 25.
  • 26.
    Chrome Devtool inremote !? /opt/google/chrome/google-chrome --remoteebugging-port=9222 –incognito TIPS! For remote access : ssh -L 0.0.0.0:9223:localhost:9222 localhost -N Remote Debugging on Android https://developers.google.com/chrome-developer-tools/docs/remote-debugging
  • 27.