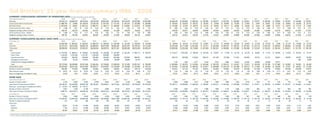
SlideShare a Scribd company logo
Toll Brothers’ 23-year financial summary 1986 - 2008
Summary ConSolidated Statement of operationS data (Amounts in thousands, except per share data)
Year Ended October 31,                                                                                                   2008                                                                   2005                   2004                    2003          2002         2001         2000         1999         1998         1997         1996          1995          1994          1993          1992          1991          1990          1989         1988         1987          1986
                                                                                                                                                 2007                   2006
                                                                                                                     $3,158 ,213            $4,646 ,979             $6,123,453              $5,793,425              $3,861,942             $ 2,758,443     $2,315,444   $2,207,999   $1,801,660   $1,455,516   $1,206,290   $ 968,253    $ 759,303   $ 643,017     $ 501,822     $ 392,560     $ 279,841     $ 175,971     $ 198,336     $ 176,864    $ 197,027    $ 134,856     $ 124,641
Revenues
                                                                                                                     $ (466,787)            $ 70,680                $1,126,616              $1,323,128              $ 647,432              $ 411,153       $ 347,318    $ 337,889    $ 230,966    $ 160,432    $ 132,523    $ 103,215    $ 85,793    $ 79,439      $ 56,840      $ 42,820      $ 27,493      $   8,444     $ 16,801      $ 21,520     $ 40,803     $ 33,346      $ 23,718
(Loss) income before income taxes
                                                                                                                     $ (297,810)            $ 35,651                $ 687,213               $ 806,110               $ 409,111              $ 259,820       $ 219,887    $ 213,673    $ 145,943    $ 101,566    $ 84,704     $ 65,075     $ 53,744    $ 49,932      $ 36,177      $ 28,058      $ 16,538      $   5,013     $ 9,988       $ 13,127     $ 24,074     $ 17,173      $ 11,861
Net (loss) income
                                                                                                                     $    (1.88)            $     0.23              $     4.45              $     5.23              $     2.75             $      1.84     $     1.56   $     1.49   $     1.01   $     0.69   $     0.58   $    0.48    $    0.40   $    0.37     $    0.27     $     0.21    $    0.13     $    0.04     $    0.08     $    0.11    $    0.20    $    0.14     $    0.11
(Loss) income per share – Basic
                                                                                                                        158,730                155,318                 154,300                 154,272                 148,646                 141,339        140,945      143,340      145,075      146,756      153,441     136,508      135,460     134,040       133,592       132,924       132,088       124,992       118,856       119,776      120,612      121,540       111,812
Weighted-average number of shares
                                                                                                                     $    (1.88)            $      0.22             $     4.17              $     4.78              $     2.52             $      1.72     $     1.46   $     1.38   $     0.98   $     0.68   $     0.55   $    0.44    $    0.36   $    0.34     $    0.25     $     0.21    $    0.12     $    0.04     $    0.08     $    0.11    $    0.20    $    0.14     $    0.11
(Loss) income per share – Diluted
                                                                                                                        158,730                164,166                 164,852                 168,552                 162,330                 151,083        150,959      154,734      149,651      149,744      153,441     149,049      147,516     145,440       142,620       133,868       132,936       125,648       118,856       119,880      120,612      121,540       111,812
Weighted-average number of shares

Summary ConSolidated BalanCe Sheet data (Amounts in thousands, except per share data)
At October 31,                                                                                                           2008                                                                   2005                   2004                    2003          2002         2001         2000         1999         1998         1997         1996          1995          1994          1993          1992          1991          1990          1989         1988         1987          1986
                                                                                                                                                 2007                   2006
                                                                                                                     $1,633,495              $ 900,337              $ 632,524               $ 689,219              $ 465,834               $ 234,489       $ 102,337    $ 182,840    $ 161,860    $ 96,484     $ 80,143     $ 147,575    $ 22,891    $ 27,772      $ 38,026      $ 32,329      $ 33,407      $ 31,475      $ 10,379      $   9,160    $ 27,110     $ 18,009      $ 14,720
Cash
                                                                                                                     $4,127,475              $5,572,655             $6,095,702              $5,068,624             $3,878,260              $3,080,349      $2,551,061   $2,183,541   $1,712,383   $1,443,282   $1,111,863   $ 921,595    $ 772,471   $ 623,830     $ 506,347     $ 402,515     $ 287,844     $ 222,775     $ 240,155     $ 256,934    $ 206,593    $ 143,894     $ 66,543
Inventory
                                                                                                                     $6,586,836              $7,220,316             $7,583,541              $6,343,840             $4,905,578              $3,787,391      $2,895,365   $2,532,200   $2,030,254   $1,668,062   $1,254,468   $1,118,626   $ 837,926   $ 692,457     $ 586,893     $ 475,998     $ 384,836     $ 312,424     $ 316,534     $ 348,163    $ 256,611    $ 181,765     $ 108,185
Total assets
Debt
                                                                                                                     $ 613,594               $ 696,814              $ 736,934               $ 250,552              $ 340,380               $ 281,697       $ 253,194    $ 362,712    $ 326,537    $ 213,317     $ 182,292   $ 189,579    $ 132,109   $    59,057   $    17,506   $    24,779   $    25,756   $    49,943   $    71,707   $   95,508   $   74,048   $    55,545   $    12,474
  Loans payable
                                                                                                                      1,143,445               1,142,306              1,141,167               1,140,028               845,665                 546,669
  Senior notes
                                                                                                                        343,000                 350,000                350,000                 350,000               450,000                 620,000          819,663     669,581       469,499     469,418      269,296      319,924      208,415       221,226       227,969       174,442       128,854        55,513        61,474       69,681       69,635        29,967        29,963
  Subordinated notes
                                                                                                                         37,867                  76,730                119,705                  89,674                92,053                  49,939           48,996      24,754                                                                                                                                                                                          382         5,969
  Mortgage warehouse line
  Collateralized mortgage obligations                                                                                                                                                                                                                                                                 1,145        1,384        2,577        2,816       3,912         4,686        10,810        24,403        39,864        45,988        52,617
                                                                                                                     $2,137,906              $2,265,850             $2,347,806              $1,830,254             $1,728,098              $ 1,498,305     $1,121,853   $1,057,047   $ 796,036    $ 683,880    $ 452,972    $ 512,080    $ 343,340   $ 284,195     $ 250,161     $ 210,031     $ 179,013     $ 145,320     $ 179,169     $ 217,806    $ 143,683    $  85,894     $  48,406
  Total
                                                                                                                     $3,237,653              $3,527,234             $3,415,926              $2,763,571             $1,919,987              $ 1,476,628     $1,129,509   $ 912,583    $ 745,145    $ 616,334    $ 525,756    $ 385,252    $ 314,677   $ 256,659     $ 204,176     $ 167,006     $ 136,412     $ 117,925     $ 94,599      $ 85,400     $ 72,787     $  48,842     $  31,405
Stockholders’ equity
                                                                                                                        160,369                 157,008                153,899                 154,943                149,642                  146,644        140,432      139,112     143,580      145,814      147,742      137,102      135,674     134,552       133,692       133,276       132,348       131,248       118,736       119,652      120,168      120,268       119,972
Number of shares outstanding
                                                                                                                     $    20.19              $    22.47             $    22.20              $    17.84             $    12.83              $     10.07     $     8.04   $     6.56   $    5.19    $    4.23    $    3.56    $    2.81    $    2.32   $    1.91     $    1.53     $    1.25     $    1.03     $    0.90     $    0.80     $    0.71    $    0.61    $    0.41     $    0.26
Book value per share
                                                                                                                          (8.4%)                   1.0%                 24.9%                   42.0%                   27.7%                   23.0%          24.1%        28.7%       23.7%        19.3%        22.0%         20.7%       20.9%       24.5%         21.7%          20.6%        14.0%          5.3%         11.7%         18.0%        49.3%        54.7%        122.5%
Return on beginning stockholders’ equity

home data
Year Ended October 31,                                                                                                   2008                    2007                   2006                    2005                   2004                    2003          2002         2001         2000         1999         1998         1997         1996          1995          1994          1993          1992          1991          1990          1989         1988         1987          1986
                                                                                                                          4,743                   6,687                  8,601                   8,769                  6,627                   4,911           4,430        4,358        3,945        3,555        3,099       2,517        2,109       1,825         1,583         1,324         1,019           676           727           676          778          674           802
Number of homes closed (1)
                                                                                                                     $3,106,291             $ 4,495,600             $5,945,169              $5,759,301             $3,839,451              $2,731,044      $2,279,261   $2,180,469   $1,762,930   $1,438,171   $1,206,290   $ 968,253    $ 759,303   $ 643,017     $ 501,822     $ 392,560     $ 279,841     $ 175,971     $ 198,336     $ 176,864    $ 197,027    $ 134,856     $ 124,641
Sales value of homes closed (in 000s) (1)
                                                                                                                     $ 41,873               $ 139,493               $ 170,111
Revenues – percentage of completion (in 000s)
                                                                                                                          2,927                   4,440                  6,164                  10,372                  8,684                   6,132           5,070        4,314        4,364        3,799        3,387        2,701       2,398       1,846         1,716         1,595         1,202           863           612           704          656          756           832
Number of homes contracted
                                                                                                                      1,608,191             $3,010,013              $4,460,734              $7,152,463             $5,641,454              $3,475,992      $2,734,457   $2,158,536   $2,134,522   $1,627,849   $1,383,093   $1,069,279   $ 884,677   $ 660,467     $ 586,941     $ 490,883     $ 342,811     $ 230,324     $ 163,975     $ 185,255    $ 162,504    $ 190,680     $ 133,369
Sales value of homes contracted (in 000s)
At October 31,                                                                                                           2008                   2007                    2006                    2005                   2004                    2003          2002         2001         2000         1999         1998         1997         1996          1995          1994          1993          1992          1991          1990          1989         1988         1987          1986
                                                                                                                          2,046                   3,950                  6,533                   8,805                  6,709                   4,652           3,342        2,702        2,746        2,327       1,892        1,551        1,367       1,078         1,025           892           621           438             251         366           338         460             378
Number of homes in backlog
                                                                                                                     $1,325,491             $ 2,854,435             $4,488,400              $6,014,648             $4,433,895              $2,631,900      $1,858,784   $1,403,588   $1,425,521   $1,053,929   $ 814,714    $ 627,220    $ 526,194   $ 400,820     $ 370,560     $ 285,441     $ 187,118     $ 124,148     $    69,795   $ 104,156    $   95,765   $ 130,288     $    74,194
Sales value of homes in backlog (in 000s) (2)
                                                                                                                            273                     315                    300                     230                    220                     200             170          155          146          140         122          116          100          97            80            67            62            42              41          40            26          21              15
Number of selling communities
Home sites
                                                                                                                            32,081                 37,139                  41,808                  35,838                 29,804                  29,081      25,822        25,981      22,275       23,163       15,578       12,820       12,065         9,542         6,779         5,744        5,633         3,974          4,548        5,075        4,724         2,147         1,461
  Owned
                                                                                                                             7,703                 22,112                  31,960                  47,288                 30,385                  18,977      15,022        13,165      10,843       11,268       14,803        9,145        5,237         5,042         4,445         4,271        3,592         3,281          2,117        2,832        4,041         7,141         4,853
  Optioned
                                                                                                                            39,784                 59,251                  73,768                  83,126                 60,189                  48,058      40,844        39,146      33,118       34,431       30,381       21,965       17,302        14,584        11,224        10,015        9,225         7,255          6,665        7,907        8,765         9,288         6,314
  Total

      Excludes 88 units with an aggregate delivered value of $86.1 million in fiscal 2008 and 336 units with an aggregate delivered value of $263.3 million in fiscal 2007 that were accounted for using the percentage of completion accounting method.
(1)

      Net of $55.2 million of revenues recognized in fiscal 2007, respectively, under the percentage of completion accounting method.
(2)

More Related Content

What's hot

freddie mac Dividend Summary
freddie mac Dividend Summary freddie mac Dividend Summary
freddie mac Dividend Summary finance6
 
ecolab BusinessFinancial
ecolab  BusinessFinancialecolab  BusinessFinancial
ecolab BusinessFinancialfinance37
 
Coldwell Banker C&C Properties Sales Dec 2010
Coldwell Banker C&C Properties Sales Dec 2010Coldwell Banker C&C Properties Sales Dec 2010
Coldwell Banker C&C Properties Sales Dec 2010
Jessica Murr, Real Estate Professional
 
H W 2010 01 De
H W 2010 01 DeH W 2010 01 De
H W 2010 01 De
chipwags
 
Denver, Colorado Monthly Mls Stats 2010
Denver, Colorado Monthly Mls Stats 2010Denver, Colorado Monthly Mls Stats 2010
Denver, Colorado Monthly Mls Stats 2010
Tom Cryer
 
Results tracker 18th August 2011
Results tracker 18th August 2011Results tracker 18th August 2011
Results tracker 18th August 2011
Mansukh Investment & Trading Solutions
 
Ecolab2005AR
Ecolab2005AREcolab2005AR
Ecolab2005ARfinance37
 
Damir's sales numbers
Damir's sales numbers Damir's sales numbers
Damir's sales numbers
Damir Beogradlija
 

What's hot (12)

Overview report to City of Temecula/Affiliate event 2/22/12
Overview report to City of Temecula/Affiliate event 2/22/12Overview report to City of Temecula/Affiliate event 2/22/12
Overview report to City of Temecula/Affiliate event 2/22/12
 
freddie mac Dividend Summary
freddie mac Dividend Summary freddie mac Dividend Summary
freddie mac Dividend Summary
 
ecolab BusinessFinancial
ecolab  BusinessFinancialecolab  BusinessFinancial
ecolab BusinessFinancial
 
Results tracker 15.10.11
Results tracker 15.10.11Results tracker 15.10.11
Results tracker 15.10.11
 
Coldwell Banker C&C Properties Sales Dec 2010
Coldwell Banker C&C Properties Sales Dec 2010Coldwell Banker C&C Properties Sales Dec 2010
Coldwell Banker C&C Properties Sales Dec 2010
 
H W 2010 01 De
H W 2010 01 DeH W 2010 01 De
H W 2010 01 De
 
Denver, Colorado Monthly Mls Stats 2010
Denver, Colorado Monthly Mls Stats 2010Denver, Colorado Monthly Mls Stats 2010
Denver, Colorado Monthly Mls Stats 2010
 
Results tracker 18th August 2011
Results tracker 18th August 2011Results tracker 18th August 2011
Results tracker 18th August 2011
 
Ecolab2005AR
Ecolab2005AREcolab2005AR
Ecolab2005AR
 
Results tracker 14.10.11
Results tracker 14.10.11Results tracker 14.10.11
Results tracker 14.10.11
 
Damir's sales numbers
Damir's sales numbers Damir's sales numbers
Damir's sales numbers
 
Excel charts
Excel chartsExcel charts
Excel charts
 

Viewers also liked

8_6_2Q07adjustedopincomeeps2Q2007
8_6_2Q07adjustedopincomeeps2Q20078_6_2Q07adjustedopincomeeps2Q2007
8_6_2Q07adjustedopincomeeps2Q2007finance50
 
Q12008AR_Non_GAAP
Q12008AR_Non_GAAPQ12008AR_Non_GAAP
Q12008AR_Non_GAAPfinance50
 
6 Things the Founding Fathers Knew About PR and Marketing (and you should kno...
6 Things the Founding Fathers Knew About PR and Marketing (and you should kno...6 Things the Founding Fathers Knew About PR and Marketing (and you should kno...
6 Things the Founding Fathers Knew About PR and Marketing (and you should kno...
Dan Griggs
 
TOL_2004_3rd_qtr_report
TOL_2004_3rd_qtr_reportTOL_2004_3rd_qtr_report
TOL_2004_3rd_qtr_reportfinance50
 
TOL_2003_1st_qtr_report
TOL_2003_1st_qtr_reportTOL_2003_1st_qtr_report
TOL_2003_1st_qtr_reportfinance50
 
Q404netincome
Q404netincomeQ404netincome
Q404netincomefinance50
 
3rd_qtr_2001
3rd_qtr_20013rd_qtr_2001
3rd_qtr_2001finance50
 
5_5_2debttototal1Q2007
5_5_2debttototal1Q20075_5_2debttototal1Q2007
5_5_2debttototal1Q2007finance50
 
4Q2007debt-to-total
4Q2007debt-to-total4Q2007debt-to-total
4Q2007debt-to-totalfinance50
 
bli_code_of_ethics_for_financial_professionals
bli_code_of_ethics_for_financial_professionalsbli_code_of_ethics_for_financial_professionals
bli_code_of_ethics_for_financial_professionalsfinance50
 
q306arnongaap
q306arnongaapq306arnongaap
q306arnongaapfinance50
 
spectra energy DCPMarginbyContract_Q308
spectra energy DCPMarginbyContract_Q308spectra energy DCPMarginbyContract_Q308
spectra energy DCPMarginbyContract_Q308finance49
 
2Q_Adjusted_EPS
2Q_Adjusted_EPS2Q_Adjusted_EPS
2Q_Adjusted_EPSfinance50
 
Q104adjcashflows
Q104adjcashflowsQ104adjcashflows
Q104adjcashflowsfinance50
 

Viewers also liked (20)

8_6_2Q07adjustedopincomeeps2Q2007
8_6_2Q07adjustedopincomeeps2Q20078_6_2Q07adjustedopincomeeps2Q2007
8_6_2Q07adjustedopincomeeps2Q2007
 
Q12008AR_Non_GAAP
Q12008AR_Non_GAAPQ12008AR_Non_GAAP
Q12008AR_Non_GAAP
 
6 Things the Founding Fathers Knew About PR and Marketing (and you should kno...
6 Things the Founding Fathers Knew About PR and Marketing (and you should kno...6 Things the Founding Fathers Knew About PR and Marketing (and you should kno...
6 Things the Founding Fathers Knew About PR and Marketing (and you should kno...
 
inv4q
inv4qinv4q
inv4q
 
TOL_2004_3rd_qtr_report
TOL_2004_3rd_qtr_reportTOL_2004_3rd_qtr_report
TOL_2004_3rd_qtr_report
 
Q404adjcash
Q404adjcashQ404adjcash
Q404adjcash
 
TOL_2003_1st_qtr_report
TOL_2003_1st_qtr_reportTOL_2003_1st_qtr_report
TOL_2003_1st_qtr_report
 
Q404netincome
Q404netincomeQ404netincome
Q404netincome
 
Q308AR
Q308ARQ308AR
Q308AR
 
3rd_qtr_2001
3rd_qtr_20013rd_qtr_2001
3rd_qtr_2001
 
5215ijcis01
5215ijcis015215ijcis01
5215ijcis01
 
5_5_2debttototal1Q2007
5_5_2debttototal1Q20075_5_2debttototal1Q2007
5_5_2debttototal1Q2007
 
2Q_Debt
2Q_Debt2Q_Debt
2Q_Debt
 
4Q2007debt-to-total
4Q2007debt-to-total4Q2007debt-to-total
4Q2007debt-to-total
 
bli_code_of_ethics_for_financial_professionals
bli_code_of_ethics_for_financial_professionalsbli_code_of_ethics_for_financial_professionals
bli_code_of_ethics_for_financial_professionals
 
q306arnongaap
q306arnongaapq306arnongaap
q306arnongaap
 
spectra energy DCPMarginbyContract_Q308
spectra energy DCPMarginbyContract_Q308spectra energy DCPMarginbyContract_Q308
spectra energy DCPMarginbyContract_Q308
 
Toll_23Year
Toll_23YearToll_23Year
Toll_23Year
 
2Q_Adjusted_EPS
2Q_Adjusted_EPS2Q_Adjusted_EPS
2Q_Adjusted_EPS
 
Q104adjcashflows
Q104adjcashflowsQ104adjcashflows
Q104adjcashflows
 

Similar to toll brothers Toll_23Year

Galaxy Gaming (GLXZ) Q2 2012 Investor Presentation
Galaxy Gaming (GLXZ) Q2 2012 Investor Presentation Galaxy Gaming (GLXZ) Q2 2012 Investor Presentation
Galaxy Gaming (GLXZ) Q2 2012 Investor Presentation Galaxy Gaming, Inc.
 
Student Loan Calculator
Student Loan CalculatorStudent Loan Calculator
Student Loan Calculator
fpcksc
 
Swifton CFOs - McCarter English - Fin Proj 100511
Swifton CFOs - McCarter English - Fin Proj 100511Swifton CFOs - McCarter English - Fin Proj 100511
Swifton CFOs - McCarter English - Fin Proj 100511David Fogel
 
Swifton - The Capital Network - Financial Projections
Swifton - The Capital Network - Financial ProjectionsSwifton - The Capital Network - Financial Projections
Swifton - The Capital Network - Financial Projections
David Fogel
 
Swifton CFOs LLC - Boston BizSpark presentation - Financial Projections for I...
Swifton CFOs LLC - Boston BizSpark presentation - Financial Projections for I...Swifton CFOs LLC - Boston BizSpark presentation - Financial Projections for I...
Swifton CFOs LLC - Boston BizSpark presentation - Financial Projections for I...David Fogel
 
BBBY_AR2007_proxy_v3
BBBY_AR2007_proxy_v3BBBY_AR2007_proxy_v3
BBBY_AR2007_proxy_v3finance44
 
bed bath&beyond BBBY_AR2007_proxy_v3
bed bath&beyond BBBY_AR2007_proxy_v3bed bath&beyond BBBY_AR2007_proxy_v3
bed bath&beyond BBBY_AR2007_proxy_v3finance44
 
toll brothers summary
toll brothers summarytoll brothers summary
toll brothers summaryfinance50
 
tollbrothers summary
 tollbrothers   summary tollbrothers   summary
tollbrothers summaryfinance50
 
BBB2005Annual
BBB2005AnnualBBB2005Annual
BBB2005Annualfinance44
 
BBB2005Annual
BBB2005AnnualBBB2005Annual
BBB2005Annualfinance44
 
anheuser-busch SupplementalFinancialInfo
anheuser-busch SupplementalFinancialInfoanheuser-busch SupplementalFinancialInfo
anheuser-busch SupplementalFinancialInfofinance15
 
Asta data spots_howmanytravelagents&agenciesarethere_slideshow
Asta data spots_howmanytravelagents&agenciesarethere_slideshowAsta data spots_howmanytravelagents&agenciesarethere_slideshow
Asta data spots_howmanytravelagents&agenciesarethere_slideshow
American Society of Travel Agents
 
Data Warehouse Project-Report Analysis
Data Warehouse Project-Report AnalysisData Warehouse Project-Report Analysis
Data Warehouse Project-Report AnalysisSunny U Okoro
 

Similar to toll brothers Toll_23Year (20)

Galaxy Gaming (GLXZ) Q2 2012 Investor Presentation
Galaxy Gaming (GLXZ) Q2 2012 Investor Presentation Galaxy Gaming (GLXZ) Q2 2012 Investor Presentation
Galaxy Gaming (GLXZ) Q2 2012 Investor Presentation
 
Student Loan Calculator
Student Loan CalculatorStudent Loan Calculator
Student Loan Calculator
 
Dcf
DcfDcf
Dcf
 
Swifton CFOs - McCarter English - Fin Proj 100511
Swifton CFOs - McCarter English - Fin Proj 100511Swifton CFOs - McCarter English - Fin Proj 100511
Swifton CFOs - McCarter English - Fin Proj 100511
 
Swifton - The Capital Network - Financial Projections
Swifton - The Capital Network - Financial ProjectionsSwifton - The Capital Network - Financial Projections
Swifton - The Capital Network - Financial Projections
 
Swifton CFOs LLC - Boston BizSpark presentation - Financial Projections for I...
Swifton CFOs LLC - Boston BizSpark presentation - Financial Projections for I...Swifton CFOs LLC - Boston BizSpark presentation - Financial Projections for I...
Swifton CFOs LLC - Boston BizSpark presentation - Financial Projections for I...
 
BBBY_AR2007_proxy_v3
BBBY_AR2007_proxy_v3BBBY_AR2007_proxy_v3
BBBY_AR2007_proxy_v3
 
bed bath&beyond BBBY_AR2007_proxy_v3
bed bath&beyond BBBY_AR2007_proxy_v3bed bath&beyond BBBY_AR2007_proxy_v3
bed bath&beyond BBBY_AR2007_proxy_v3
 
toll brothers summary
toll brothers summarytoll brothers summary
toll brothers summary
 
tollbrothers summary
 tollbrothers   summary tollbrothers   summary
tollbrothers summary
 
summary
summarysummary
summary
 
summary
summarysummary
summary
 
BBB2005Annual
BBB2005AnnualBBB2005Annual
BBB2005Annual
 
BBB2005Annual
BBB2005AnnualBBB2005Annual
BBB2005Annual
 
anheuser-busch SupplementalFinancialInfo
anheuser-busch SupplementalFinancialInfoanheuser-busch SupplementalFinancialInfo
anheuser-busch SupplementalFinancialInfo
 
Asta data spots_howmanytravelagents&agenciesarethere_slideshow
Asta data spots_howmanytravelagents&agenciesarethere_slideshowAsta data spots_howmanytravelagents&agenciesarethere_slideshow
Asta data spots_howmanytravelagents&agenciesarethere_slideshow
 
fr06_is
fr06_isfr06_is
fr06_is
 
fr07_is
fr07_isfr07_is
fr07_is
 
Data Warehouse Project-Report Analysis
Data Warehouse Project-Report AnalysisData Warehouse Project-Report Analysis
Data Warehouse Project-Report Analysis
 
2011noviembre diciembre
2011noviembre diciembre2011noviembre diciembre
2011noviembre diciembre
 

More from finance50

Scania Presentation_Q2_2008_tcm10-211097
Scania Presentation_Q2_2008_tcm10-211097Scania Presentation_Q2_2008_tcm10-211097
Scania Presentation_Q2_2008_tcm10-211097finance50
 
Scania%20Jan%20Ytterberg%2C%20CFO_tcm10-214730
Scania%20Jan%20Ytterberg%2C%20CFO_tcm10-214730Scania%20Jan%20Ytterberg%2C%20CFO_tcm10-214730
Scania%20Jan%20Ytterberg%2C%20CFO_tcm10-214730finance50
 
Scania Presentation%20Q3%202008_tcm10-219195
Scania Presentation%20Q3%202008_tcm10-219195Scania Presentation%20Q3%202008_tcm10-219195
Scania Presentation%20Q3%202008_tcm10-219195finance50
 
Scania HQ%20Bank%20Investor%20meeting_tcm10-219785
Scania HQ%20Bank%20Investor%20meeting_tcm10-219785Scania HQ%20Bank%20Investor%20meeting_tcm10-219785
Scania HQ%20Bank%20Investor%20meeting_tcm10-219785finance50
 
Scania Presentation-Q4-2008_tcm10-227202
Scania Presentation-Q4-2008_tcm10-227202Scania Presentation-Q4-2008_tcm10-227202
Scania Presentation-Q4-2008_tcm10-227202finance50
 
scana Presentation%20Q3%202008_tcm10-219195
scana  Presentation%20Q3%202008_tcm10-219195scana  Presentation%20Q3%202008_tcm10-219195
scana Presentation%20Q3%202008_tcm10-219195finance50
 
Scania%202008%20Q3%20report%20FINAL_tcm10-219196
Scania%202008%20Q3%20report%20FINAL_tcm10-219196Scania%202008%20Q3%20report%20FINAL_tcm10-219196
Scania%202008%20Q3%20report%20FINAL_tcm10-219196finance50
 
Scania%202008%20Q3%20svensk%20rapport%20FINAL_tcm10-219191
Scania%202008%20Q3%20svensk%20rapport%20FINAL_tcm10-219191Scania%202008%20Q3%20svensk%20rapport%20FINAL_tcm10-219191
Scania%202008%20Q3%20svensk%20rapport%20FINAL_tcm10-219191finance50
 
scana Presentation-Q4-2008_tcm10-227202
scana  Presentation-Q4-2008_tcm10-227202scana  Presentation-Q4-2008_tcm10-227202
scana Presentation-Q4-2008_tcm10-227202finance50
 
Scania%20bokslutskommunik%C3%A9%202008_tcm10-227198
Scania%20bokslutskommunik%C3%A9%202008_tcm10-227198Scania%20bokslutskommunik%C3%A9%202008_tcm10-227198
Scania%20bokslutskommunik%C3%A9%202008_tcm10-227198finance50
 
scana 2008_SV_lowres_tcm10-229942
scana  2008_SV_lowres_tcm10-229942scana  2008_SV_lowres_tcm10-229942
scana 2008_SV_lowres_tcm10-229942finance50
 
scana 66684-EN_2008_lowres_tcm10-229950
scana  66684-EN_2008_lowres_tcm10-229950scana  66684-EN_2008_lowres_tcm10-229950
scana 66684-EN_2008_lowres_tcm10-229950finance50
 
perini nyse_compliance
perini   nyse_complianceperini   nyse_compliance
perini nyse_compliancefinance50
 
perini nyse_compliance
perini   nyse_complianceperini   nyse_compliance
perini nyse_compliancefinance50
 
perini corporategovernanceguidelines
perini   corporategovernanceguidelinesperini   corporategovernanceguidelines
perini corporategovernanceguidelinesfinance50
 
perini corporategovernanceguidelines
perini   corporategovernanceguidelinesperini   corporategovernanceguidelines
perini corporategovernanceguidelinesfinance50
 
perini CodeBusinessConductEthics
perini   CodeBusinessConductEthicsperini   CodeBusinessConductEthics
perini CodeBusinessConductEthicsfinance50
 
perini CodeBusinessConductEthics
perini   CodeBusinessConductEthicsperini   CodeBusinessConductEthics
perini CodeBusinessConductEthicsfinance50
 
perini corporate_governance_nominating
perini   corporate_governance_nominatingperini   corporate_governance_nominating
perini corporate_governance_nominatingfinance50
 
perini compensationcommitteecharter
perini   compensationcommitteecharterperini   compensationcommitteecharter
perini compensationcommitteecharterfinance50
 

More from finance50 (20)

Scania Presentation_Q2_2008_tcm10-211097
Scania Presentation_Q2_2008_tcm10-211097Scania Presentation_Q2_2008_tcm10-211097
Scania Presentation_Q2_2008_tcm10-211097
 
Scania%20Jan%20Ytterberg%2C%20CFO_tcm10-214730
Scania%20Jan%20Ytterberg%2C%20CFO_tcm10-214730Scania%20Jan%20Ytterberg%2C%20CFO_tcm10-214730
Scania%20Jan%20Ytterberg%2C%20CFO_tcm10-214730
 
Scania Presentation%20Q3%202008_tcm10-219195
Scania Presentation%20Q3%202008_tcm10-219195Scania Presentation%20Q3%202008_tcm10-219195
Scania Presentation%20Q3%202008_tcm10-219195
 
Scania HQ%20Bank%20Investor%20meeting_tcm10-219785
Scania HQ%20Bank%20Investor%20meeting_tcm10-219785Scania HQ%20Bank%20Investor%20meeting_tcm10-219785
Scania HQ%20Bank%20Investor%20meeting_tcm10-219785
 
Scania Presentation-Q4-2008_tcm10-227202
Scania Presentation-Q4-2008_tcm10-227202Scania Presentation-Q4-2008_tcm10-227202
Scania Presentation-Q4-2008_tcm10-227202
 
scana Presentation%20Q3%202008_tcm10-219195
scana  Presentation%20Q3%202008_tcm10-219195scana  Presentation%20Q3%202008_tcm10-219195
scana Presentation%20Q3%202008_tcm10-219195
 
Scania%202008%20Q3%20report%20FINAL_tcm10-219196
Scania%202008%20Q3%20report%20FINAL_tcm10-219196Scania%202008%20Q3%20report%20FINAL_tcm10-219196
Scania%202008%20Q3%20report%20FINAL_tcm10-219196
 
Scania%202008%20Q3%20svensk%20rapport%20FINAL_tcm10-219191
Scania%202008%20Q3%20svensk%20rapport%20FINAL_tcm10-219191Scania%202008%20Q3%20svensk%20rapport%20FINAL_tcm10-219191
Scania%202008%20Q3%20svensk%20rapport%20FINAL_tcm10-219191
 
scana Presentation-Q4-2008_tcm10-227202
scana  Presentation-Q4-2008_tcm10-227202scana  Presentation-Q4-2008_tcm10-227202
scana Presentation-Q4-2008_tcm10-227202
 
Scania%20bokslutskommunik%C3%A9%202008_tcm10-227198
Scania%20bokslutskommunik%C3%A9%202008_tcm10-227198Scania%20bokslutskommunik%C3%A9%202008_tcm10-227198
Scania%20bokslutskommunik%C3%A9%202008_tcm10-227198
 
scana 2008_SV_lowres_tcm10-229942
scana  2008_SV_lowres_tcm10-229942scana  2008_SV_lowres_tcm10-229942
scana 2008_SV_lowres_tcm10-229942
 
scana 66684-EN_2008_lowres_tcm10-229950
scana  66684-EN_2008_lowres_tcm10-229950scana  66684-EN_2008_lowres_tcm10-229950
scana 66684-EN_2008_lowres_tcm10-229950
 
perini nyse_compliance
perini   nyse_complianceperini   nyse_compliance
perini nyse_compliance
 
perini nyse_compliance
perini   nyse_complianceperini   nyse_compliance
perini nyse_compliance
 
perini corporategovernanceguidelines
perini   corporategovernanceguidelinesperini   corporategovernanceguidelines
perini corporategovernanceguidelines
 
perini corporategovernanceguidelines
perini   corporategovernanceguidelinesperini   corporategovernanceguidelines
perini corporategovernanceguidelines
 
perini CodeBusinessConductEthics
perini   CodeBusinessConductEthicsperini   CodeBusinessConductEthics
perini CodeBusinessConductEthics
 
perini CodeBusinessConductEthics
perini   CodeBusinessConductEthicsperini   CodeBusinessConductEthics
perini CodeBusinessConductEthics
 
perini corporate_governance_nominating
perini   corporate_governance_nominatingperini   corporate_governance_nominating
perini corporate_governance_nominating
 
perini compensationcommitteecharter
perini   compensationcommitteecharterperini   compensationcommitteecharter
perini compensationcommitteecharter
 

Recently uploaded

The secret way to sell pi coins effortlessly.
The secret way to sell pi coins effortlessly.The secret way to sell pi coins effortlessly.
The secret way to sell pi coins effortlessly.
DOT TECH
 
Isios-2024-Professional-Independent-Trustee-Survey.pdf
Isios-2024-Professional-Independent-Trustee-Survey.pdfIsios-2024-Professional-Independent-Trustee-Survey.pdf
Isios-2024-Professional-Independent-Trustee-Survey.pdf
Henry Tapper
 
how to sell pi coins at high rate quickly.
how to sell pi coins at high rate quickly.how to sell pi coins at high rate quickly.
how to sell pi coins at high rate quickly.
DOT TECH
 
US Economic Outlook - Being Decided - M Capital Group August 2021.pdf
US Economic Outlook - Being Decided - M Capital Group August 2021.pdfUS Economic Outlook - Being Decided - M Capital Group August 2021.pdf
US Economic Outlook - Being Decided - M Capital Group August 2021.pdf
pchutichetpong
 
Intro_Economics_ GPresentation Week 4.pptx
Intro_Economics_ GPresentation Week 4.pptxIntro_Economics_ GPresentation Week 4.pptx
Intro_Economics_ GPresentation Week 4.pptx
shetivia
 
Commercial Bank Economic Capsule - May 2024
Commercial Bank Economic Capsule - May 2024Commercial Bank Economic Capsule - May 2024
Commercial Bank Economic Capsule - May 2024
Commercial Bank of Ceylon PLC
 
Introduction to Indian Financial System ()
Introduction to Indian Financial System ()Introduction to Indian Financial System ()
Introduction to Indian Financial System ()
Avanish Goel
 
Summary of financial results for 1Q2024
Summary of financial  results for 1Q2024Summary of financial  results for 1Q2024
Summary of financial results for 1Q2024
InterCars
 
what is a pi whale and how to access one.
what is a pi whale and how to access one.what is a pi whale and how to access one.
what is a pi whale and how to access one.
DOT TECH
 
how can I sell pi coins after successfully completing KYC
how can I sell pi coins after successfully completing KYChow can I sell pi coins after successfully completing KYC
how can I sell pi coins after successfully completing KYC
DOT TECH
 
what is the best method to sell pi coins in 2024
what is the best method to sell pi coins in 2024what is the best method to sell pi coins in 2024
what is the best method to sell pi coins in 2024
DOT TECH
 
Introduction to Value Added Tax System.ppt
Introduction to Value Added Tax System.pptIntroduction to Value Added Tax System.ppt
Introduction to Value Added Tax System.ppt
VishnuVenugopal84
 
BYD SWOT Analysis and In-Depth Insights 2024.pptx
BYD SWOT Analysis and In-Depth Insights 2024.pptxBYD SWOT Analysis and In-Depth Insights 2024.pptx
BYD SWOT Analysis and In-Depth Insights 2024.pptx
mikemetalprod
 
The Evolution of Non-Banking Financial Companies (NBFCs) in India: Challenges...
The Evolution of Non-Banking Financial Companies (NBFCs) in India: Challenges...The Evolution of Non-Banking Financial Companies (NBFCs) in India: Challenges...
The Evolution of Non-Banking Financial Companies (NBFCs) in India: Challenges...
beulahfernandes8
 
Exploring Abhay Bhutada’s Views After Poonawalla Fincorp’s Collaboration With...
Exploring Abhay Bhutada’s Views After Poonawalla Fincorp’s Collaboration With...Exploring Abhay Bhutada’s Views After Poonawalla Fincorp’s Collaboration With...
Exploring Abhay Bhutada’s Views After Poonawalla Fincorp’s Collaboration With...
beulahfernandes8
 
Turin Startup Ecosystem 2024 - Ricerca sulle Startup e il Sistema dell'Innov...
Turin Startup Ecosystem 2024  - Ricerca sulle Startup e il Sistema dell'Innov...Turin Startup Ecosystem 2024  - Ricerca sulle Startup e il Sistema dell'Innov...
Turin Startup Ecosystem 2024 - Ricerca sulle Startup e il Sistema dell'Innov...
Quotidiano Piemontese
 
GeM ppt in railway for presentation on gem
GeM ppt in railway  for presentation on gemGeM ppt in railway  for presentation on gem
GeM ppt in railway for presentation on gem
CwierAsn
 
655264371-checkpoint-science-past-papers-april-2023.pdf
655264371-checkpoint-science-past-papers-april-2023.pdf655264371-checkpoint-science-past-papers-april-2023.pdf
655264371-checkpoint-science-past-papers-april-2023.pdf
morearsh02
 
innovative-invoice-discounting-platforms-in-india-empowering-retail-investors...
innovative-invoice-discounting-platforms-in-india-empowering-retail-investors...innovative-invoice-discounting-platforms-in-india-empowering-retail-investors...
innovative-invoice-discounting-platforms-in-india-empowering-retail-investors...
Falcon Invoice Discounting
 
USDA Loans in California: A Comprehensive Overview.pptx
USDA Loans in California: A Comprehensive Overview.pptxUSDA Loans in California: A Comprehensive Overview.pptx
USDA Loans in California: A Comprehensive Overview.pptx
marketing367770
 

Recently uploaded (20)

The secret way to sell pi coins effortlessly.
The secret way to sell pi coins effortlessly.The secret way to sell pi coins effortlessly.
The secret way to sell pi coins effortlessly.
 
Isios-2024-Professional-Independent-Trustee-Survey.pdf
Isios-2024-Professional-Independent-Trustee-Survey.pdfIsios-2024-Professional-Independent-Trustee-Survey.pdf
Isios-2024-Professional-Independent-Trustee-Survey.pdf
 
how to sell pi coins at high rate quickly.
how to sell pi coins at high rate quickly.how to sell pi coins at high rate quickly.
how to sell pi coins at high rate quickly.
 
US Economic Outlook - Being Decided - M Capital Group August 2021.pdf
US Economic Outlook - Being Decided - M Capital Group August 2021.pdfUS Economic Outlook - Being Decided - M Capital Group August 2021.pdf
US Economic Outlook - Being Decided - M Capital Group August 2021.pdf
 
Intro_Economics_ GPresentation Week 4.pptx
Intro_Economics_ GPresentation Week 4.pptxIntro_Economics_ GPresentation Week 4.pptx
Intro_Economics_ GPresentation Week 4.pptx
 
Commercial Bank Economic Capsule - May 2024
Commercial Bank Economic Capsule - May 2024Commercial Bank Economic Capsule - May 2024
Commercial Bank Economic Capsule - May 2024
 
Introduction to Indian Financial System ()
Introduction to Indian Financial System ()Introduction to Indian Financial System ()
Introduction to Indian Financial System ()
 
Summary of financial results for 1Q2024
Summary of financial  results for 1Q2024Summary of financial  results for 1Q2024
Summary of financial results for 1Q2024
 
what is a pi whale and how to access one.
what is a pi whale and how to access one.what is a pi whale and how to access one.
what is a pi whale and how to access one.
 
how can I sell pi coins after successfully completing KYC
how can I sell pi coins after successfully completing KYChow can I sell pi coins after successfully completing KYC
how can I sell pi coins after successfully completing KYC
 
what is the best method to sell pi coins in 2024
what is the best method to sell pi coins in 2024what is the best method to sell pi coins in 2024
what is the best method to sell pi coins in 2024
 
Introduction to Value Added Tax System.ppt
Introduction to Value Added Tax System.pptIntroduction to Value Added Tax System.ppt
Introduction to Value Added Tax System.ppt
 
BYD SWOT Analysis and In-Depth Insights 2024.pptx
BYD SWOT Analysis and In-Depth Insights 2024.pptxBYD SWOT Analysis and In-Depth Insights 2024.pptx
BYD SWOT Analysis and In-Depth Insights 2024.pptx
 
The Evolution of Non-Banking Financial Companies (NBFCs) in India: Challenges...
The Evolution of Non-Banking Financial Companies (NBFCs) in India: Challenges...The Evolution of Non-Banking Financial Companies (NBFCs) in India: Challenges...
The Evolution of Non-Banking Financial Companies (NBFCs) in India: Challenges...
 
Exploring Abhay Bhutada’s Views After Poonawalla Fincorp’s Collaboration With...
Exploring Abhay Bhutada’s Views After Poonawalla Fincorp’s Collaboration With...Exploring Abhay Bhutada’s Views After Poonawalla Fincorp’s Collaboration With...
Exploring Abhay Bhutada’s Views After Poonawalla Fincorp’s Collaboration With...
 
Turin Startup Ecosystem 2024 - Ricerca sulle Startup e il Sistema dell'Innov...
Turin Startup Ecosystem 2024  - Ricerca sulle Startup e il Sistema dell'Innov...Turin Startup Ecosystem 2024  - Ricerca sulle Startup e il Sistema dell'Innov...
Turin Startup Ecosystem 2024 - Ricerca sulle Startup e il Sistema dell'Innov...
 
GeM ppt in railway for presentation on gem
GeM ppt in railway  for presentation on gemGeM ppt in railway  for presentation on gem
GeM ppt in railway for presentation on gem
 
655264371-checkpoint-science-past-papers-april-2023.pdf
655264371-checkpoint-science-past-papers-april-2023.pdf655264371-checkpoint-science-past-papers-april-2023.pdf
655264371-checkpoint-science-past-papers-april-2023.pdf
 
innovative-invoice-discounting-platforms-in-india-empowering-retail-investors...
innovative-invoice-discounting-platforms-in-india-empowering-retail-investors...innovative-invoice-discounting-platforms-in-india-empowering-retail-investors...
innovative-invoice-discounting-platforms-in-india-empowering-retail-investors...
 
USDA Loans in California: A Comprehensive Overview.pptx
USDA Loans in California: A Comprehensive Overview.pptxUSDA Loans in California: A Comprehensive Overview.pptx
USDA Loans in California: A Comprehensive Overview.pptx
 

toll brothers Toll_23Year

  • 1. Toll Brothers’ 23-year financial summary 1986 - 2008 Summary ConSolidated Statement of operationS data (Amounts in thousands, except per share data) Year Ended October 31, 2008 2005 2004 2003 2002 2001 2000 1999 1998 1997 1996 1995 1994 1993 1992 1991 1990 1989 1988 1987 1986 2007 2006 $3,158 ,213 $4,646 ,979 $6,123,453 $5,793,425 $3,861,942 $ 2,758,443 $2,315,444 $2,207,999 $1,801,660 $1,455,516 $1,206,290 $ 968,253 $ 759,303 $ 643,017 $ 501,822 $ 392,560 $ 279,841 $ 175,971 $ 198,336 $ 176,864 $ 197,027 $ 134,856 $ 124,641 Revenues $ (466,787) $ 70,680 $1,126,616 $1,323,128 $ 647,432 $ 411,153 $ 347,318 $ 337,889 $ 230,966 $ 160,432 $ 132,523 $ 103,215 $ 85,793 $ 79,439 $ 56,840 $ 42,820 $ 27,493 $ 8,444 $ 16,801 $ 21,520 $ 40,803 $ 33,346 $ 23,718 (Loss) income before income taxes $ (297,810) $ 35,651 $ 687,213 $ 806,110 $ 409,111 $ 259,820 $ 219,887 $ 213,673 $ 145,943 $ 101,566 $ 84,704 $ 65,075 $ 53,744 $ 49,932 $ 36,177 $ 28,058 $ 16,538 $ 5,013 $ 9,988 $ 13,127 $ 24,074 $ 17,173 $ 11,861 Net (loss) income $ (1.88) $ 0.23 $ 4.45 $ 5.23 $ 2.75 $ 1.84 $ 1.56 $ 1.49 $ 1.01 $ 0.69 $ 0.58 $ 0.48 $ 0.40 $ 0.37 $ 0.27 $ 0.21 $ 0.13 $ 0.04 $ 0.08 $ 0.11 $ 0.20 $ 0.14 $ 0.11 (Loss) income per share – Basic 158,730 155,318 154,300 154,272 148,646 141,339 140,945 143,340 145,075 146,756 153,441 136,508 135,460 134,040 133,592 132,924 132,088 124,992 118,856 119,776 120,612 121,540 111,812 Weighted-average number of shares $ (1.88) $ 0.22 $ 4.17 $ 4.78 $ 2.52 $ 1.72 $ 1.46 $ 1.38 $ 0.98 $ 0.68 $ 0.55 $ 0.44 $ 0.36 $ 0.34 $ 0.25 $ 0.21 $ 0.12 $ 0.04 $ 0.08 $ 0.11 $ 0.20 $ 0.14 $ 0.11 (Loss) income per share – Diluted 158,730 164,166 164,852 168,552 162,330 151,083 150,959 154,734 149,651 149,744 153,441 149,049 147,516 145,440 142,620 133,868 132,936 125,648 118,856 119,880 120,612 121,540 111,812 Weighted-average number of shares Summary ConSolidated BalanCe Sheet data (Amounts in thousands, except per share data) At October 31, 2008 2005 2004 2003 2002 2001 2000 1999 1998 1997 1996 1995 1994 1993 1992 1991 1990 1989 1988 1987 1986 2007 2006 $1,633,495 $ 900,337 $ 632,524 $ 689,219 $ 465,834 $ 234,489 $ 102,337 $ 182,840 $ 161,860 $ 96,484 $ 80,143 $ 147,575 $ 22,891 $ 27,772 $ 38,026 $ 32,329 $ 33,407 $ 31,475 $ 10,379 $ 9,160 $ 27,110 $ 18,009 $ 14,720 Cash $4,127,475 $5,572,655 $6,095,702 $5,068,624 $3,878,260 $3,080,349 $2,551,061 $2,183,541 $1,712,383 $1,443,282 $1,111,863 $ 921,595 $ 772,471 $ 623,830 $ 506,347 $ 402,515 $ 287,844 $ 222,775 $ 240,155 $ 256,934 $ 206,593 $ 143,894 $ 66,543 Inventory $6,586,836 $7,220,316 $7,583,541 $6,343,840 $4,905,578 $3,787,391 $2,895,365 $2,532,200 $2,030,254 $1,668,062 $1,254,468 $1,118,626 $ 837,926 $ 692,457 $ 586,893 $ 475,998 $ 384,836 $ 312,424 $ 316,534 $ 348,163 $ 256,611 $ 181,765 $ 108,185 Total assets Debt $ 613,594 $ 696,814 $ 736,934 $ 250,552 $ 340,380 $ 281,697 $ 253,194 $ 362,712 $ 326,537 $ 213,317 $ 182,292 $ 189,579 $ 132,109 $ 59,057 $ 17,506 $ 24,779 $ 25,756 $ 49,943 $ 71,707 $ 95,508 $ 74,048 $ 55,545 $ 12,474 Loans payable 1,143,445 1,142,306 1,141,167 1,140,028 845,665 546,669 Senior notes 343,000 350,000 350,000 350,000 450,000 620,000 819,663 669,581 469,499 469,418 269,296 319,924 208,415 221,226 227,969 174,442 128,854 55,513 61,474 69,681 69,635 29,967 29,963 Subordinated notes 37,867 76,730 119,705 89,674 92,053 49,939 48,996 24,754 382 5,969 Mortgage warehouse line Collateralized mortgage obligations 1,145 1,384 2,577 2,816 3,912 4,686 10,810 24,403 39,864 45,988 52,617 $2,137,906 $2,265,850 $2,347,806 $1,830,254 $1,728,098 $ 1,498,305 $1,121,853 $1,057,047 $ 796,036 $ 683,880 $ 452,972 $ 512,080 $ 343,340 $ 284,195 $ 250,161 $ 210,031 $ 179,013 $ 145,320 $ 179,169 $ 217,806 $ 143,683 $ 85,894 $ 48,406 Total $3,237,653 $3,527,234 $3,415,926 $2,763,571 $1,919,987 $ 1,476,628 $1,129,509 $ 912,583 $ 745,145 $ 616,334 $ 525,756 $ 385,252 $ 314,677 $ 256,659 $ 204,176 $ 167,006 $ 136,412 $ 117,925 $ 94,599 $ 85,400 $ 72,787 $ 48,842 $ 31,405 Stockholders’ equity 160,369 157,008 153,899 154,943 149,642 146,644 140,432 139,112 143,580 145,814 147,742 137,102 135,674 134,552 133,692 133,276 132,348 131,248 118,736 119,652 120,168 120,268 119,972 Number of shares outstanding $ 20.19 $ 22.47 $ 22.20 $ 17.84 $ 12.83 $ 10.07 $ 8.04 $ 6.56 $ 5.19 $ 4.23 $ 3.56 $ 2.81 $ 2.32 $ 1.91 $ 1.53 $ 1.25 $ 1.03 $ 0.90 $ 0.80 $ 0.71 $ 0.61 $ 0.41 $ 0.26 Book value per share (8.4%) 1.0% 24.9% 42.0% 27.7% 23.0% 24.1% 28.7% 23.7% 19.3% 22.0% 20.7% 20.9% 24.5% 21.7% 20.6% 14.0% 5.3% 11.7% 18.0% 49.3% 54.7% 122.5% Return on beginning stockholders’ equity home data Year Ended October 31, 2008 2007 2006 2005 2004 2003 2002 2001 2000 1999 1998 1997 1996 1995 1994 1993 1992 1991 1990 1989 1988 1987 1986 4,743 6,687 8,601 8,769 6,627 4,911 4,430 4,358 3,945 3,555 3,099 2,517 2,109 1,825 1,583 1,324 1,019 676 727 676 778 674 802 Number of homes closed (1) $3,106,291 $ 4,495,600 $5,945,169 $5,759,301 $3,839,451 $2,731,044 $2,279,261 $2,180,469 $1,762,930 $1,438,171 $1,206,290 $ 968,253 $ 759,303 $ 643,017 $ 501,822 $ 392,560 $ 279,841 $ 175,971 $ 198,336 $ 176,864 $ 197,027 $ 134,856 $ 124,641 Sales value of homes closed (in 000s) (1) $ 41,873 $ 139,493 $ 170,111 Revenues – percentage of completion (in 000s) 2,927 4,440 6,164 10,372 8,684 6,132 5,070 4,314 4,364 3,799 3,387 2,701 2,398 1,846 1,716 1,595 1,202 863 612 704 656 756 832 Number of homes contracted 1,608,191 $3,010,013 $4,460,734 $7,152,463 $5,641,454 $3,475,992 $2,734,457 $2,158,536 $2,134,522 $1,627,849 $1,383,093 $1,069,279 $ 884,677 $ 660,467 $ 586,941 $ 490,883 $ 342,811 $ 230,324 $ 163,975 $ 185,255 $ 162,504 $ 190,680 $ 133,369 Sales value of homes contracted (in 000s) At October 31, 2008 2007 2006 2005 2004 2003 2002 2001 2000 1999 1998 1997 1996 1995 1994 1993 1992 1991 1990 1989 1988 1987 1986 2,046 3,950 6,533 8,805 6,709 4,652 3,342 2,702 2,746 2,327 1,892 1,551 1,367 1,078 1,025 892 621 438 251 366 338 460 378 Number of homes in backlog $1,325,491 $ 2,854,435 $4,488,400 $6,014,648 $4,433,895 $2,631,900 $1,858,784 $1,403,588 $1,425,521 $1,053,929 $ 814,714 $ 627,220 $ 526,194 $ 400,820 $ 370,560 $ 285,441 $ 187,118 $ 124,148 $ 69,795 $ 104,156 $ 95,765 $ 130,288 $ 74,194 Sales value of homes in backlog (in 000s) (2) 273 315 300 230 220 200 170 155 146 140 122 116 100 97 80 67 62 42 41 40 26 21 15 Number of selling communities Home sites 32,081 37,139 41,808 35,838 29,804 29,081 25,822 25,981 22,275 23,163 15,578 12,820 12,065 9,542 6,779 5,744 5,633 3,974 4,548 5,075 4,724 2,147 1,461 Owned 7,703 22,112 31,960 47,288 30,385 18,977 15,022 13,165 10,843 11,268 14,803 9,145 5,237 5,042 4,445 4,271 3,592 3,281 2,117 2,832 4,041 7,141 4,853 Optioned 39,784 59,251 73,768 83,126 60,189 48,058 40,844 39,146 33,118 34,431 30,381 21,965 17,302 14,584 11,224 10,015 9,225 7,255 6,665 7,907 8,765 9,288 6,314 Total Excludes 88 units with an aggregate delivered value of $86.1 million in fiscal 2008 and 336 units with an aggregate delivered value of $263.3 million in fiscal 2007 that were accounted for using the percentage of completion accounting method. (1) Net of $55.2 million of revenues recognized in fiscal 2007, respectively, under the percentage of completion accounting method. (2)