SlideShare a Scribd company logo
1 of 6
Download to read offline
TOLL BROTHERS, INC.
                    HISTORICAL STATISTICS SUMMARY
                               1997-2008
                                  ($ IN THOUSANDS)

                                                                                        1997                      1998                   1999                     2000            2001                   2002           2003           2004           2005           2006               2007           2008
                                                                                               116
        NUMBER OF SELLING COMMUNITIES AT END OF YEAR                                                                  122                       140                       146            155                    170            200            220            230            300                315            273
        TOTAL # SALES AGREEMENTS SIGNED                                                    2,701                    3,387                   3,845                       4,364        4,314                  5,070          6,132          8,684         10,372          6,164              4,440          2,927
                                                                                      $1,069,279
        TOTAL VALUE OF SALES AGREEMENTS SIGNED (000s)                                                          $1,383,093              $1,640,990               $2,134,522      $2,158,536             $2,734,457     $3,475,992     $5,641,454     $7,152,463     $4,460,734         $3,010,013     $1,608,191
        AVG PRICE PER HOME SOLD (OOOs)                                                      $396                     $408                                                $489
                                                                                                                                             $427                                     $500                  $539           $567            $650          $690            $724               $678          $549
        NUMBER OF HOMES IN BACKLOG - OCTOBER 31                                            1,551                    1,892                   2,381                       2,746        2,702                  3,342          4,652          6,709          8,805          6,533              3,950          2,046
        VALUE OF HOMES IN BACKLOG - OCTOBER 31 (OOOs)                                   $627,220                 $814,714              $1,067,685               $1,425,521      $1,403,588                            $2,631,900
                                                                                                                                                                                                       $1,858,784                    $4,433,895     $6,014,648     $4,488,400         $2,854,435     $1,325,491
        AVG PRICE PER HOME IN BACKLOG (OOOs)                                                $404                     $431                    $448                        $519        $519                   $556           $566           $661           $683           $713 (a)           $766           $648
        # OF HOMES DELIVERED                                                               2,517                    3,093                                               3,945
                                                                                                                                            3,555                                    4,358                  4,430          4,911          6627           8,769          8,601              6,687          4,743
                                                                                        $968,253
        TOTAL VALUE OF HOMES DELIVERED (OOOs)                                                                  $1,206,290                                       $1,762,930
                                                                                                                                       $1,438,171                               $2,180,469             $2,279,261     $2,731,044     $3,839,451     $5,759,301     $5,945,169         $4,495,600     $3,106,291
        AVG DELIVERY PRICE (OOOs)                                                           $385                     $389                    $405                        $447        $500                   $515           $556           $579           $657           $691               $698           $655
        AVG # OF COMMUNITIES DELIVERING                                                        102                    114                       126                       136            144                    148            151            185         225               245              214              171
                                                                                                                                                                                                             ——
                                                                                                                                                                                                              —
                                                                                                                                                                                                                                           3S.8           39.0           35.1               31.3           27.7     1
        TAX RATE                                                                           37.0%                    36.1%                                               36.8%
                                                                                                                                           36.7%                                    36.8%                  36.7%          36.8%
                                                                                                                                                                                                                                                        39.1%                             49.6%          36.2%
                                                                                                                                                                                                                                         36.8%                         39.0%
        GROSS MARG. TRAD. HOME SALES BEF. WRITE-OFF                                        22.9%                    22.8%                  22.6%                        24.6%       27.1%                  27.6%          27.8%          28.6%          32.3%          30.8%              26.4%          20.4%
        GROSS MARG. TRAD. HOME SALES AFTER WRITE-OFF                                       22.7%                    22.6%                  22.3%                        24.2%       26.5%                  27.4%          27.6%          28.4%          32.2%          28.3%              12.6%           -0.4%
        OPERATING MARGIN                                                                   10.8%                    10.8%                  10.6%                        12.1%       14.3%                  14.4%          14.6%          16.2%          21.7%          16.7%               •0.1%        -12.7%
        PRETAX MARGIN                                                                      10.7%                    11.0%                  11.0%                        12.8%       15.3%                  15.0%          14.9%          16.8%          22.8%          18.4%               1.5%         -14.8%
        DEBT AS % OF TOTAL CAPITALIZATION                                                  56.9%                    46.2%                  52.6%                        51.7%       53.1%                  48.7%          49.5%          46.0%          38.6%          39.5%              38.3%          39.3%
        DEBT Net of EXC CASH & Mkt Sec AS % OF TOTAL CAP.                                 49.1%                     42.0%                  49.2%                    46.4%           48.5%                  46.5%          41.2%          35.7%          27.7%          32.0%              26.9%          12.8%
        TOTAL DEBT(SOOO) excluding Mtge Whse Loan                                       $509,503                 $451,588               $682,735                  $796,036      $1,032,293             $1,072,857     $1,448,366     $1,636,045     $1,740,580     $2,228,101         $2,189,120     $2,100,039
        TOTAL EQUITY($OOO)                                                              $385,252                 $525,756               $616,334                 $745,145        $912,583              $1,129,509     $1,476,628     $1,919,987     $2,763,571     $3,415,926         $3,527,234     $3,237,653
        INTEREST COVERAGE •                                                                 4.19                     4.91                                                5.16
                                                                                                                                             4.40                                     5.53                   5.00           5.05           7.12          13.21          11.14               6.44           2.01
        RATIO of Inventory to house revenues                                                0.95                     0.92                    1.00                        0.97         1.00                   1.12           1.13           1.01           0.88           1.03     -         1.24           1.33
        INVENTORY GROWTH                                                                  19.3%                    20.6%                   29.8%                    18.6%           27.5%                  16.8%          20.7%          25.9%          30.7%          20.3% -            -8.6%         -25.9%
        HOUSING REVENUE GROWTH                                                            27.5%                    24.6%                   19.2%                    22.6%           23.7%                   4.5%          19.8%          40.6%          50.0%           3.2%             -24.4%         -30.9%
        HOMESITES
          OWNED                                                                           12,820                   15,578                                           22,275
                                                                                                                                           23,163                                  25,981                 25,822         29,081         29,804         35,838         41,808              37139         32,081
          OPTIONED                                                                         9,145                   14,803                                           10,843
                                                                                                                                           11,268                                  13,165                 15,022         18,977         30,385         47,288         31,960
           TOTAL
                                                                                                                                                                                                                                        60,189            ,126
        NUMBER OF SHARES OUTSTANDING (OOOs)                                              137,102                  147,742                                          143,850
                                                                                                                                         145,814                                  139,112                140,432        146,644        149,642        154,943        153,899            157,008         160369
        BOOK VALUE PER SHARE                                                               $2.81                    $3.56                   $4.23                       $5.18       $6.56                  $8.04         $10.07         $12.83         $17.84         $22.20             $22.47         $20.19
        RETURN ON BEGINNING SHAREHOLDERS EOUITY                                           20.7%                    22.0%                   19.3%                    23.7%           28.7%                  24.1%          23.0%          27.7%          42.0%          24.9%               1.0%          -8.4%
        (a) Based upon gross backlog prior to reduction of percentage of completion revenues recognized applicable to units in backlog of $170.1 million at 10/31/06.


FIN09
                                                                                                                                                                                      quot;CONFIDENTIALquot;
TOLL BROTHERS, INC.
                HISTORICAL STATEMENT OF OPERATIONS
                              1997-2008
                                   {$ IN THOUSANDS)


                                                                 1997                      1998                      1999                                                 2001
                                                                                                                                              aaaa                                                                           2003
                                                                                                                                                                                                   200Z                                                  2SM                                               2006                       2007                         2008
                                                            $           %
                                                                                       s          %              S          %
                                                                                                                                                                    s            %             $                         $           %             $                                                   $
        REVENUES
          Completed contract                              $968,253                 $1,206,290                $1,438,171                1,762,930                                            2,279,261                 2,731,044                 3,839,451                  5,759,301
                                                                                                                                                                $2,180,469                                                                                                                          5,945,169                 4,495,600                   $3,106,293
          Percentage of completion
                                                                                                                                                                                                                                                                                                      170,111                   139,493                       41,873
          Land sales                                                                                            17,345                   38,730                                                36,183                   27,399                     22,491                     34,124
                                                                                                                                                                   27,530                                                                                                                               8,173
            Total Revenues
                                                                                                                                                                                            2,315,'       100.00quot;,      58,443      100.00quot;/    3,861,942      100.00°/    5,793,425   100.00quot;/ii   6,123,453     100.00quot;/o   4,646,979      100.00quot;/.     3,158,213      100.00%

        COST OF REVENUES
          Completed contract before impairments            746,275      77.07%       931,833      77.25quot;/.    1,112,780     77.37%     1,329,612     75.42quot;/.    1,589,242       72.89quot;/.   1,649,250      72.36quot;/.   1,971,801      72.20quot;/.   2,739,822       71.36quot;/.   3,897,617    67.68quot;/.    4,111,155      69.15quot;/.   3,307,455       73.57%      2,472,401        79.59%
          Percentage of completion
                                                                                                                                                                                                                                                                                                      132,268      77.75quot;/.     108,954       78.11quot;/.       36,221        86.50quot;/.
          Land sales                                                                                                                     29,809
                                                                                                                13,375      77.11quot;/.                 76.97quot;/.      21,464        77.97quot;/.     25,671       70.95%       17,875       65.24quot;/.     15,775        70.14quot;/.     24,416     71.55quot;/.        6,997      85.61quot;/.       8,069       67.89quot;/.        4,818        47.95quot;/.
          Writeoffs of predevel. & impairments               2,048       0.21quot;/=       2,020       0.17quot;/.                                7,448
                                                                                                                             0.35%
                                                                                                                 5,092                                0.42quot;/.      13,034         0.60quot;/.      6,081                     5,638
                                                                                                                                                                                                            0.27quot;/.                   0.21quot;/.      7,452         0.19quot;/.      5,080      0.09quot;/.      152,045                   619,516
                                                                                                                                                                                                                                                                                                                    2.56%                     13.78quot;/,      644,991        20.76quot;/.
          Recovery of prior writedowns
                                                                                                                                                                                                                                                                                                                                (21,064)       -0.47quot;/.                    -3.92quot;/.
                                                                                                                                                                                                                                                                                                                                                           (121,674)
          Interest                                          29,390       3.04quot;/.      35,941       2.98quot;/.                               46,169
                                                                                                                39,905       2.74quot;/.                  2.56quot;/.      58,247         2.64%       84,529        2.79quot;/.     73,245        2.66quot;/.     93,303         2.42quot;/.    125,283      2.16quot;/.     121,993                    102,447
                                                                                                                                                                                                                                                                                                                    1.99quot;/.                     2.20quot;/.                     2.81quot;/.
                                                                                                                                                                                                                                                                                                                                                             88,861
               Total Expenses                                                                                                                                                     6.18quot;/i   1,745,531      75.33quot;/    2,068,559      74.99quot;/(   !,856,352       73.96quot;/!   4,052,396    69.95quot;/.    4,524,458      73.89quot;/.   4,125,377       88.78quot;/.    3,125,618        98.97quot;/.
        Selling Expenses                                    34,778       3.59quot;/.      43,854       3.64quot;/.      50,895       3.50quot;/.     65,561       3.64quot;/.      79,450         3.60quot;/.     92,092        3.98%      106,265        3.85quot;/.    134,331         3.48quot;/.                                            3.20%      189,185
                                                                                                                                                                                                                                                                            167,981      2.90quot;/.     195,765                                   4.07quot;/.      154,195
        General & Administrative                                                                                                                                                                                                                                                                                                                                            4.88%
                                                            51,523       5.32quot;/.      62,875       5.21quot;/.      79,318       5.45quot;/.    104,797       5.82quot;/.     130,279         5.90quot;/.    144,031        6.22quot;/.                   6.60quot;/.
                                                                                                                                                                                                                       182,072                   246,749         6.39quot;/.                                            6.17quot;/.
                                                                                                                                                                                                                                                                            314,805      5.43quot;/,                               327,544
                                                                                                                                                                                                                                                                                                     377,639                                   7.05quot;/.      275,699
               Total SG&A                                                                                                                                                                                                                                                                                                                                                   8.73%
                                                            86,301       8.91quot;/.     106,729       8.85quot;/.     130,213       8.95quot;/.                  9.46quot;/.
                                                                                                                                        170,358                   209,729         9.50quot;/.    236,123       10.20quot;/.    288,337       10.45quot;/.    381,080         9.87quot;/.                                            9.36quot;/.
                                                                                                                                                                                                                                                                                                     573,404
                                                                                                                                                                                                                                                                            482,786      8.33quot;/.                               516,729        11.12quot;/.
        Goodwill write-off                                                                                                                                                                                                                                                                                                                                  429,894        13.61%
                                                                                                                                                                                                                                                                                                                                 8,973                        3,233
        Income (loss) from operations                 I    104,239      10.77quot;/.     129,767      10.76quot;/,     154,151      10.59quot;/,    218,264      12.11quot;/.     316,283        14.32quot;/.    333,790       14.42quot;/.    401,547       14.56quot;/.    624,510        16.17quot;/.   1,258,243   21.72quot;/.                                  (4,100)
                                                                                                                                                                                                                                                                                                    1,025,591     16.75quot;/.                    -0.09quot;/.      (400,532)     -12.68quot;/,
        Other Income (loss)                                  3,407                      4,526                     8,599                  12,702                    21,606                     13,528                    16,798                    31,151                     68,941                                             74,780
                                                                                                                                                                                                                                                                                                     101,025                                                 (66,255)
        (Gain) loss from early retirement of debt           (4,431)                    (1,770)                   (2,318)                                                                                                (7,192)                   (8,229)                    (4,056)
        PRETAX INCOME (LOSS)
                                                                                                                                                                                 15.3        347,318       15.00quot;/     411,153       14.91quot;/     647,432        16.76quot;/    1,323,128   22.84quot;/.     1,126,616     18.40quot;/.      70,680         1.52quot;/.     (466,787)      -14.78quot;/.

        TAX PROVISION (BENEFIT)                            38,139                     47,819                    58,866                   85,023                   124,216                    127,431                    151333                   238,321                    517,018                  439,403                    35,029                     (168,977)
        NET INCOME (LOSS)*
                                                                                                                                                                                  9.68quot;/     219,887        9.50quot;/(    259,820        9.42       409,1          10.59%      806,110     13.91quot;/.     687,213      11.22quot;/.      35,651         0.77quot;/.     (297,810)       -9.43quot;/.
        BASIC EARNINGS (LOSS) PER SHARE*                    $0.48                      $0.58                     $0.69                    $1.01                     $1.49                      $1.56                     $1.84                     $2.75                      $5.23                    $4.45                     $0.23                       $(1.88)
        DILUTED EARNINGS (LOSS) PER SHARE*                  $0.44                      $0.55                     $0.68                    $0.98                     $1.38                      $1.46                     $1.72                     $2.52                      $4.78                    $4.17                     $0.22                       $(1.88)
        * Before Change in Accounting


F1N09
                                                                                                                                                                        quot;CONFIDENTIALquot;
TOLL BROTHERS, INC.
                       HISTORICAL BALANCE SHEET
                               1997-2008
                                 (5 IN THOUSANDS)

                                                                1997                   1998                    1999                    2000                    2001                    2002                   2003                   2004
                                                           s           %                                                                                                                                                                                     2Q05
                                                                                   $                                                                                                                                                                                                 2006
                                                                                               %                                                                                                                                                                                                             2007
                                                                                                                      %           s           %                                                                                                                                                                                      2008
                                                                                                                                                           $          %           $
        ASSETS                                                                                                                                                                                %          $           %          $           %           $           %
                                                                                                                                                                                                                                                                                s           %
          Cash                                           5147,575       13.2%     $80,143       6.4%     $96,484        5.8%    $161,860        8.0%    $182,840        7.2%    $102,337       3.5%     234,489
          Marketable Securities                                                                                                                                                                                       6.2%     465,834        9.5%     689,219       10.9%     632,524        8.3%     900,337       12.5%   1,633,495       24.8%
                                                                                                                                                                                                        190,762
          Inventories                                                                                                                                                                                                 5.0%     115,029        2.3%
                                                          921,595       82.4%   1,111,863      88.6%   1,443,282       86.5%   1,712,383       84.3%   2,183,541       86.2%   2,551,061      88.1%   3,080,349
          Property, Etc.                                                                                                                                                                                             81.3%   3,878,260       79.1%
                                                           15,074        1.3%                                                                                                                                                                        5,068,624
                                                                                   14,425                                                                                                                                                                            79.9%
                                                                                                1.1%                                                                                                                                                                         6,095,702       80.4%
                                                                                                          19,633        1.2%                                                                                                                                                                         5,572,655
                                                                                                                                  24,075        1.2%                                                                                                                                                                 77.2%
                                                                                                                                                          33,095                                                                                                                                                             4,127,475
                                                                                                                                                                        1.3%                                                                                                                                                                 62.7%
                                                                                                                                                                                  38,496                 43,711
                                                                                                                                                                                               1.3%
          Receivables, Prepaids & Other                                                                                                                                                                               1.2%      52,429        1.1%
                                                           21,832        2.0%                                                                                                                                                                           79,524
                                                                                   25,149                                                                                                                                                                             1.3%      99,089
                                                                                                2.0%                                                                                                                                                                                          1.3%
                                                                                                          68,459        4.1%                                                                                                                                                                            84,265
                                                                                                                                  95,722                                                                                                                                                                              1.2%
                                                                                                                                                4.7%      74,481                                                                                                                                                                86,462
                                                                                                                                                                        2.9%                                                                                                                                                                  1.3%
                                                                                                                                                                                  95,503                113,633
                                                                                                                                                                                               3.3%
          Contracts Receivable                                                                                                                                                                                        3.0%     146,212        3.0%     185,620        2.9%     160,446        2.1%     135,910        1.9%     113,762        1 7%
          Mortgage Notes Receivable
                                                            2,539        0.2%       1,385      0.1%                                                                                                                                                                            170,111        2.2%      46,525        0.6%
                                                                                                                                                          26,758       1.1%       61,756
          Customer Deposits Held in Escrow                                                                                                                                                    2.1%       57,500      1.5%       99,914       2.0%       99,858       1.6%
                                                            9,961        0.9%      15,503      1.2%                                                                                                                                                                            130,326        1.7%
                                                                                                          19,010                                                                                                                                                                                        93,189
                                                                                                                        1.1%      17,303                                                                                                                                                                              1.3%
                                                                                                                                               0.9%       17,303                                                                                                                                                                49,255
                                                                                                                                                                       0.7%                                                                                                                                                                   0.7%
          Investments In unconsoildated entities                                                                                                                                  23,019      0.8%       31,547      0.8%       53,929       1.1%       68,601       1.1%
                                                                                    6,000      0.5%                                                                                                                                                                             49,676        0.7%      34,367
                                                                                                          21,194        1.3%      18,911                                                                                                                                                                              0.5%
                                                                                                                                               0.9%       14,182                                                                                                                                                                18,913
                                                                                                                                                                       0.6%                                                                                                                                                                   0.3%
          Deferred tax assets                                                                                                                                                     23,193      0.8%       35,400      0.9%       93,971       1.9%      152,394       2.4%                     3.2%
                                                                                                                                                                                                                                                                               245,667                 183,171        2.5%     151,771        2.3%
                                                      r 1,118,626      100.0%   1,254,468     100.0%                                                                                                                                                                                                   169,897
                                                                                                       1,668,062                                                                                                                                                                                                      2.4%
                                                                                                                      100.0%   2,030,254      100.0%                                                                                                                                                                           405,703
                                                                                                                                                       2,532,200                                                                                                                                                                              6.2%
                                                                                                                                                                      100.0%   2 895 365
                                                                                                                                                                                                                                            100.0%   6,343,840      100.0%   7,583,541      100.0%   7,220,316      100.0%   6,586,836      100.0%
        LIABILITiES & EQUITY
            Bank Loans                                  $168,000                $156,000               $186,000                 $300,000                $322,520
           Senior Debt                                                                                                                                                          $207,500               222,500                222,500                        0                 300,000                 331,667                 331,667
           Subordinated Debt                                                                                                                                                                           546,669                845,665
                                                          319,924                                                                                                                                                                                    1,140,028
                                                                                 269,296                                                                                                                                                                                     1,141,167
                                                                                                        469,418                                                                                                                                                                                      1,142,306
                                                                                                                                 469,499                 669,581                                                                                                                                                             1,143,445
           Mortgage Company Warehouse Line                                                                                                                                      819,663                620,000                450,000                  350,000                 350,000                 350,000
                                                                                                                                                          24,754                                                                                                                                                               343,000
           Other Loans                                                                                                                                                           48,996                 49,939                 92,053
                                                          21,579                                                                                                                                                                                        89,674
                                                                                  26,292                                                                                                                                                                                       119,705                  76,730
                                                                                                         27,317                  26,537                   40,192                                                                                                                                                                37,867
           Customer Deposits                                                                                                                                                     45,694                 59,197                117,880
                                                          52,698                                                                                                                                                                                       250,552
                                                                                  69,398                                                                                                                                                                                       436,934                 365,147
                                                                                                         82,495                 104,924                  101,778                                                                                                                                                               281,927
           Accts Payable & Accrued Expenses                                                                                                                                     134,707                176,710                291,424
                                                         123,837                                                                                                                                                                                       415,602
                                                                                 155,530                                                                                                                                                                                       360,147                 260,155
                                                                                                        226,612                 296,068                  362,641                                                                                                                                                               135,591
           Mortgage Notes Payable                                                                                                                                               407,666                498,674                756,174
                                                           2,577                                                                                                                                                                                     1,048,326
                                                                                   1,384                                                                                                                                                                                     1,117,459                 961,106                 134,843
           income Tax Payable
                                                                                  50,812                  59,886                  88,081                  98,151                                                                                                                                                               738,596
                                                                                                                                                                                101,630                137,074                209,895                 282,147                 334,500                  197,960                 202,247
                                  Totai Liabilities      733,374                 728,712               1,051,728               1,285,109               1,619,617               1 765 356
                                                                                                                                                                                                                                                     3,576,329               4,159,912               3,685,071               3,349,183

                                                                                                                                                                                                                                                                                7,703
                                                                                                                                                                                                                                                         3,940                                           8,011                       0
          Shareholders' Equity
                                                         385,252                 525,756                616,334                 745,145                 9.12,583               1,129,509              1,476,628              1,919,987               2,763,571               3,415,926               3,527,234               3,237,653
                                                        1,118,626               1,254,468              1,668,062               2,030,254               2,532,200               2,895,365              3,787,391              4,905,578               6,343,840               7,583,541               7,220,316               6,586,836


FiNoa
                                                                                                                                                           quot;CONFIDENTIALquot;
TOLL BROTHERS, INC.
                   HISTORICAL STATISTICS SUMMARY
                              1986-1997
                                 ($ IN THOUSANDS)

                                                                                       1386                     1987                     1988                     1989                 1990                 1991         1992         1993         1994         1995             1996           1997
        NUMBER OF SELLING COMMUNITIES AT END OF YEAR                                           15                       21                       26                          40               41                   42           62           67           80           97               100            116
        TOTAL # SALES AGREEMENTS SIGNED                                                       832                      756                      656                         704               612               863        1,202        1,595        1,716        1,846            2,398           2,701
        TOTAL VALUE OF SALES AGREEMENTS SIGNED (OOOs)                                 $133,369                 $190,680                  $162,504                 $185,255            $163,975             $230,324     $342,811     $490,883     $586,941     $660,467         $884,677      $1,069,279
        AVG PRICE PER HOME SOLD (OOOs)                                                    $160                     $252                      $248                       $263              $268                 $267         $285         $308         $342         $358             $369           $396
        NUMBER OF HOMES IN BACKLOG - OCTOBER 31                                               378                      460                      338                         366            251                  438          621          892        1,025        1,078            1,367           1,551
        VALUE OF HOMES IN BACKLOG - OCTOBER 31 (OOOs)                                  $74,194                 $130,288                   $95,765                 $104,156             $69,795             $124,148     $187,118     $285,441     $370,560     $400,820         $526,194       $627,220
        AVG PRICE PER HOME IN BACKLOG (OOOs)                                              $196                     $283                      $283                       $285              $278                 $283         $301         $320         $362         $372             $385           $404
        # OF HOMES DELIVERED                                                                  802                      674                      778                         676            727                  676        1,019        1,324        1,583        1,825            2,109          2,517
        TOTAL VALUE OF HOMES DELIVERED (OOOs)                                         $124,641                 $134,856                 $197,027                  $176,864            $198,336             $175,971     $279,841     $392,560     $501,822     $643,017         $759,303       $968,253
        AVG DELIVERY PRICE (OOOs)                                                         $155                     $200                      $253                       $262              $273                 $260         $275         $296         $317         $352             $360           $385
        AVG # OF COMMUNITIES DELIVERING                                                                                15                        19                         22                21                   32           37           52           59           75               90          102
      AVG DELIVERIES PER COMMUNITY
                                                                                                                                                                                                                                         25.5         26.8         243              23.4           24.7
      TAX RATE                                                                           50.0%                    48.5%                    41.0%                      39.0%             37.1%                40.6%        39.8%                     36.4%        37.1%            37.4%
                                                                                                                                                                                                                                       37.5%                                                      37.0%
        GROSS MARG. TRAD. HOME SALES BEF. WRITE-OFF                                      31.3%                    39.7%                    35.9%                      34.8%             29.7%                26.1%        28.0%        26.6%        25.6%        25.4%            24.1%           22.9%
      GROSS MARG. TRAD. HOME SALES AFTER WRITE-OFF                                       31.3%                    39.7%                    35.0%                      30.8%             25.2%                23.4%        27.2%        25.9%        24.2%        24.6%            23.5%          22.7%
      OPERATING MARGIN                                                                   17.4%                    23.0%                    19.1%                      11.1%              6.7%                 2.7%         9.7%        10.5%        10.9%        11.8%            11.1%           10.8%
      PRETAX MA.RGIN                                                                     19.0%                    24.7%                    20.7%                      12.2%              8.5%                 4.8%         9.8%        10.9%        11.3%        12.4%            11.3%           10.7%
      DEBT AS % OF TOTAL CAPITALIZATION                                                  57.5%                    63.7%                    66.4%                      65.9%             58.5%                47.2%        53.1%        54.4%        54.6%        52.2%            52.0%           56.9%
      DEBT Net of EXC CASH & Mkt Sec AS % OF TOTAL CAP.                                  54.6%                    61.5%                    63.6%                      66.0%             58.5%                41.7%        46.0%        51.2%        51.1%        50.6%            51.0%          49.1%
      TOTAL DEBT($OOO) excluding Mtge Whse Loan                                        $42,437                  $85,894                 $143,683                 $165,189             $133,181             $105,456     $154,610     $199,221     $245,475     $280,283         $340,524       $509,503
      TOTAL EQUITY($OOO)                                                               $31,405                  $48,842                  $72,787                  $85,400              $94,599             $117,925     $136,412     $167,006     $204,176     $256,659         $314,677       $385,252
      INTEREST COVERAGE                                                                   7.06                    11.15                      4.58                       2.07              2.29                 2.23         3.35         3.33         4.12         4.48             4.51           4.19
      RATIO of Inventory to house revenues                                                0.53                      1.07                     1.05                       1.45              1.21                 1.27         1.03         1.03         1.01         0.97             1.02           0.95
      INVENTORY GROWTH                                                                                          116.2%                     43.6%                      24.4%              •6.5%                ERR         29.2%        39.8%        25.8%        23.2%      -     23.8%          19.3%
      HOUSING REVENUE GROWTH                                                                                       8.2%                    46.1%                      -10.2%            12.1%                 ERR         59.0%        40.3%        27.8%        28.1%            18.1%          27.5%
      HOMESITES
        OWNED                                                                            1.461                    2,147                    4,724                       5,075            4,548                 3,974       5,633         5,744
        OPTIONED                                                                                                                                                                                                                                     6,779        9,542           12,065
                                                                                         4,853                                                                                                                                                                                                   12,820
                                                                                                                  7,141                    4,041                       2,832            2,117                 3,281       3,592         4,271
         TOTAL
                                                                                                                                                                        '         -       ' ^quot;                                        10,015        11,224       14,584           17,302         21,965
      NUMBER OF SHARES OUTSTANDING (OOOs)                                              119,972                  120,268                  120,168                  119,652                                  131,248      132,348
                                                                                                                                                                                      118,736                                                                  134,552
                                                                                                                                                                                                                                     133,276      133,692                       135,674         137,102
      BOOK VALUE PER SHARE                                                               $0.26                    $0.41                    $0.61                       $0.71            $0.80                 $0.90       $1.03         $1.25        $1.53       $1.91             $2.32          $2.81
      RETURN ON BEGINNING SHAREHOLDERS EQUITY                                          122.5%                    54.7%                     49.3%                      18.0%             11.7%                 5.3%        14.0%        19.6%        21.7%        24.5%            20.9%          20.7%
|::   (a) Based upon gross backlog prior to reduction of percentage of completion revenues recognized appilcabie to units in backlog of $170.1 million at 10/31/06.


FIN09
                                                                                                                                                                                           quot;CONFIDENTIAf
TOLL BROTHERS, INC.
               HISTORICAL STATEMENT OF OPERATIONS
                             1986-1997
                                (S IN THOUSANDS)


                                                          1986                  1987                  1988                  1989                  1990                   1991                       1992                   1993                  1994                   1995                   1996
                                                      $          %                                                                                                                                                                                                                                                       1997
                                                                            $          %          $          %                     %
                                                                                                                        $                     $          %           $                                     %
                                                                                                                                                                                    %          $                      $           %          $           %                      %
        REVENUES                                                                                                                                                                                                                                                                           $           %                         %
                                                                                                                                                                                                                                                                                                                  i
          Completed contract                        $124,641              $134,856              $197,027              $176,864              $198,336               $175,971                  $279,841               $392,560               $501,822               $643,017
          Percentage of completion                                                                                                                                                                                                                                                       $759,303               $968,253
          Land sales
            Total Revenues
                                                                                                                                                                    175,971     1             279,841                                       501,822     100.00%    643,017     100.00%    759,303     100.00%   968,253         100.00%

        COST OF REVENUES
          Completed contract before Impairments       85,595     68.67%     81,325     60.31%    126,367               115,266
                                                                                                             64.14%                65.17%    139,389     70.28%                     73.94%                 72.04%   288,124       73.40%
                                                                                                                                                                   130,113
          Percentage of completion                                                                                                                                                           201,600                                                              479,643
                                                                                                                                                                                                                                           373,283      74.39%                 74.59%     575,983     75.86%    746,275         77.07%
          Land sales
          Writeoffs of predevei. & impairments                                                     1,769      0.90%      7,196      4.07%      8,987      4.53%       4,721         2.68%       1,988      0.71%       2,754       0.70%      6,957      1.39%       5,366      0.83%
          Recovery of prior writedowns                                                                                                                                                                                                                                                      5,007      0.66%          2,048      0.21%
          Interest                                     4,235      3.40%      3,505      2.60%      5,440     2.76%       6,699      3.79%      9,356      4.72%       9,920         5.64%      16,047      5.73%      17,129       4.36%     18,196      3.63%     22,207       3.45%     24,189       3.19%     29,390          3.04%
              Total Expenses
                                                                                                                                                                                             ^'19.635                                      398,436      79.40%    507,216      78.88%    605,179      79.70%    777,713         80.32%
    Selling Expenses                                  3,382       2.71%     3,585       2.66%     5,765       2.93%     7,299       4.13%     9,274       4.68%      9,477          5.39%     10,913       3.90%     14,746       3.76%     17,856       3.56%
    General & Administrative                                                                                                                                                                                                                                       23,992       3.73%     28,847       3.80%
                                                      9,727       7.80%                                                                                                                                                                                                                                          34,778          3.59%
                                                                           15,431      11.44%    20,023      10.16%    20,703      11.71%    18,061       9.11%     16,939          9.63%     22,060       7.88%     28,580       7.28%     30,932
           Total SG&A                                                                                                                                                                                                                                    6.16%     35,692       5.55%     40,888
                                                     13,109                                                                                                                                                                                                                                            5.38%
                                                                 10.52%                                                                                                                                                                                                                                          51,523
                                                                           19,016                                                                                                                                                                                                                                                5.32%
                                                                                       14.10%    25,788      13.09%                15.83%
                                                                                                                       28,002                27 335      13 78%
    Goodwill write-off                                                                                                                                                                                                                      48,788       9.72%     59,684       9.28%     69,735       9.18%     86,301          8.91%

    Income (loss) from operations                    21,702      17.41%    31,010      22.99%    37,663      19.12%    19,701      11.14%    13,269       6.69%      4,801          2.73%     27,233       9.73%     41,227       10.50%    54,598                 76,117
                                                                                                                                                                                                                                                        10.88%                            84,389
                                                                                                                                                                                                                                                                               11.84%                 11.11%    104,239         10.77%
    Other income (loss)                               2,016                 2,336                 3,140                 1,819                 1,695                  1,447                      1,630                  2,701                 2,242                  3,322
    (Gain) loss from early retirement of debt                                                                                                                                                                                                                                              1,404                   3,407
                                                                                                                                              1,837                  2,196                     (1,371)                (1,108)
                                                                                                                                                                                                                                                                                                                  (4,431)
    PRETAX iNCOiVIE (LOSS)
                                                                                                                                                                     8^444                    27,492                                        56,840      11.33%     79,439      12.35%     85,793      11.30%    103,215         10.66%

    TAX PROVISION (BENEFIT)                          11,857                16,173                16,729                 8,393                 6,813                                                                  16,069
                                                                                                                                                                     3,431                    10,955                                        20,663                                        32,049
                                                                                                                                                                                                                                                                   29,507                                        38,139
    NET INCOME (LOSS)*
                                                                                                                                                                                                                                            36,177       7.21%     49,932       7.77%     53,744       7.08%     65,076          6.72% 1
    BASIC EARNINGS (LOSS) PER SHARE*                  $0.11                 $0.14                 $0.20                 $0.11                 $0.08                  $0.04                     $0.13                  $0.20                  $0.27
    DILUTED EARNINGS (LOSS) PER SHARE*                                                                                                                                                                                                                              $0.37                  $0.40
                                                      $0.11                                                                                                                                                                                                                                                       $0.48
                                                                            $0.14                 $0.20                 $0.11                 $0.08                  $0.04                     $0.12                  $0.20                  $0.25                  $0.34                  $0.36                  $0.44
    * Before Change in Accounting


FIN09
                                                                                                                                                  quot;CONFIDENTIALquot;
TOLL BROTHERS, INC.
                       HISTORICAL BALANCE SHEET
                               1986-1997
                                 ($ IN THOUSANDS)

                                                            1986                 1387                  1988                  1989                  1990                   1991                  1992                  1993                  1994
                                                                   %
                                                        $                                                                                                                                                                                                         1995
                                                                             $                                                                                                                                                                                                          1996
                                                                                                   $          %          $                                                                                                                                                                                      1997
                                                                                                                                               $                      $          %          $          %
        ASSETS                                                                                                                                                                                                    $                     $                     $                     $                      $           %
          Cash                                        $14,720       13.6%   $18,009       9.9%   $26,583                $9,160
                                                                                                               10.4%                  2.6%    $9,854         3.1%   $31,266       10.0%   $48,627       12.6%
          Marketable Securities                                                                                                                                                                                 $34,071        7.2%   $41,700        7.1%   $27,772        4.0%    $22,891       2.7%    $147,575       13.2%
          Inventories                                  66,543       61.5%   143,894      79.2%   206,593       80.5%   256,934       73.8%   240,155        75.9%   222,775      71.3%    287,844      74.8%
          Property, Etc.                                                                                                                                                                                        402,515       84.6%
                                                        3,306                                                                                                                                                                         506,347
                                                                     3.1%                                                                                                                                                                           86.3%   623,830       90.1%
                                                                              5,836       3.2%                                                                                                                                                                                     772,471
                                                                                                  10,990        4.3%                                                                                                                                                                            92.2%
                                                                                                                        11,699        3.4%                                                                                                                                                                921,595       82.4%
                                                                                                                                              10,504         3.3%    10,362       3.3%     10,087       2.6%
          Receivables, Prepalds & Other                                                                                                                                                                          10,296        2.2%
                                                        6,995                                                                                                                                                                          11,537
                                                                     6.5%                                                                                                                                                                            2.0%    11,898        1.7%
                                                                             14,026       7.7%                                                                                                                                                                                      12,948
                                                                                                  12,445        4.8%    17,996                                                                                                                                                                   1.5%
                                                                                                                                      5.2%                                                                                                                                                                 15,074        1.3%
                                                                                                                                              10,167         3.2%     8,495       2.7%     15,193       3.9%
          Contracts Receivable                                                                                                                                                                                   15,603        3.3%    20,578        3.5%    21,198        3.1%     22,029       2.6%                    2.0%
                                                                                                                                                                                                                                                                                                           21,832
          Mortgage Notes Receivable                    16,621       15.4%                                               52,374       15.0%    45,854        14.5%    39,526       12.7%    23,085
          Customer Deposits Held in Escrow                                                                                                                                                               6.0%     9,902       2.1%      4,614       0.8%      3,940        0.6%      2,833       0.3%       2,589
                                                                                                                                      0.0%                                                                                                                                                                              0.2%
                                                                                                                                                             0.0%
          investments in unconsoiidated entities                                                                                                                                                                  3,611       0.8%      2,117       0.4%      3,819        0.6%      4,754       0.6%       9,961       0.9%
          Deferred tax assets
                                                      108,185      100.0%   181,765     100.0%   256,611      100.0%   348,163      100.0%   316,534       100.0%   312,424      100.0%   384,836      100.0%   475,998      100.0%   586,893      100.0%   692,457      100.0%    837,926     100.0%   1,118,626      100.0%
        LiABILITIES a EQUITY
           Bank Loans
                                                                                                 $62,626               $87,527               $66,500                $47,300
           Senior Debt                                                                                                                                                                    $22,300               $21,293               $10,000               $52,000               $118,000              $168,000
           Subordinated Debt                          $29,963               $29,967               69,635                69,681                61,474                 55,513
           Mortgage Company Warehouse Line                                                                                                                                                128,854               174,442               227,969               221,226               208,415                319,924
           Other Loans                                 12,474                55,927               11,422                 7,981                 5,207                  2,643
           Customer Deposits                                                                                                                                                                3,456                 3,486
                                                        6,802                                                                                                                                                                           7,506
                                                                             12,685                                                                                                                                                                           7,057                14,109                 21,579
                                                                                                   8,480                 9,019                                       10,241
           Accts Payable & Accrued Expenses                                                                                                    6,009                                       15,130                22,449
                                                       11,405                                                                                                                                                                          30,071
                                                                             22,883                                                                                                                                                                          36,194
                                                                                                  24,177                                                                                                                                                                           43,387
                                                                                                                        24,080                                       22,163                                                                                                                               52,698
           Mortgage Notes Payable                                                                                                             20,847                                       32,793                47,192
                                                        5,969                                                                                                                                                                          69,786                78,411               100,634
                                                                                                                        52,617                                                                                                                                                                           123,837
                                                                                                                                                                     39,864
           Income Tax Payable                                                                                                                 45,988                                       24,403                10,810
                                                       10,167                                                                                                                                                                           4,686
                                                                             11,461                                                                                                                                                                           3,912
                                                                                                   7,484                                                                                                                                                                            2,816
                                                                                                                        11,858                                       16,775                                                                                                                                2,577
                                                                                                                                              15,910                                       21,488                29,320                32,699                36,998                35,888                 44,759
                                  Total Liabilities    76,780               132,923              183,824               262,763               221,935                194,499               248,424               308,992               382,717               435,798               523,249                733,374

          Shareholders' Equity                         31,405               48,842                72,787                85,400                94,599                117,925               136,412               167,006               204,176               256,659               314,677                385,252
                                                      108,185               181,765              256,611               348,163               316,534                312,424               384,836               475,998               586,893               692,457               837,926               1,118,626


FIN09
                                                                                                                                                   quot;CONFIDENTIALquot;

More Related Content

What's hot

BBBY_AR2007_proxy_v3
BBBY_AR2007_proxy_v3BBBY_AR2007_proxy_v3
BBBY_AR2007_proxy_v3finance44
 
39348363 google-earnings-slides-q3-2010
39348363 google-earnings-slides-q3-201039348363 google-earnings-slides-q3-2010
39348363 google-earnings-slides-q3-2010Pranav Bhatnagar
 
merck 2Q08 Other Financial Disclosures
merck  	2Q08 Other Financial Disclosuresmerck  	2Q08 Other Financial Disclosures
merck 2Q08 Other Financial Disclosuresfinance11
 
Deer Claim Study Counties
Deer Claim Study CountiesDeer Claim Study Counties
Deer Claim Study CountiesBlinsink
 
Executive Summary Final
Executive Summary FinalExecutive Summary Final
Executive Summary FinalAVINRAM
 
Dole 1997 annual
Dole 1997 annualDole 1997 annual
Dole 1997 annualfinance32
 
Asta data spots_howmanytravelagents&agenciesarethere_slideshow
Asta data spots_howmanytravelagents&agenciesarethere_slideshowAsta data spots_howmanytravelagents&agenciesarethere_slideshow
Asta data spots_howmanytravelagents&agenciesarethere_slideshowAmerican Society of Travel Agents
 

What's hot (10)

BBBY_AR2007_proxy_v3
BBBY_AR2007_proxy_v3BBBY_AR2007_proxy_v3
BBBY_AR2007_proxy_v3
 
39348363 google-earnings-slides-q3-2010
39348363 google-earnings-slides-q3-201039348363 google-earnings-slides-q3-2010
39348363 google-earnings-slides-q3-2010
 
Damir's sales numbers
Damir's sales numbers Damir's sales numbers
Damir's sales numbers
 
merck 2Q08 Other Financial Disclosures
merck  	2Q08 Other Financial Disclosuresmerck  	2Q08 Other Financial Disclosures
merck 2Q08 Other Financial Disclosures
 
Deer Claim Study Counties
Deer Claim Study CountiesDeer Claim Study Counties
Deer Claim Study Counties
 
Executive Summary Final
Executive Summary FinalExecutive Summary Final
Executive Summary Final
 
Dole 1997 annual
Dole 1997 annualDole 1997 annual
Dole 1997 annual
 
credit-suisse Restatement re
credit-suisse Restatement recredit-suisse Restatement re
credit-suisse Restatement re
 
Asta data spots_howmanytravelagents&agenciesarethere_slideshow
Asta data spots_howmanytravelagents&agenciesarethere_slideshowAsta data spots_howmanytravelagents&agenciesarethere_slideshow
Asta data spots_howmanytravelagents&agenciesarethere_slideshow
 
Segundo bimestre2011
Segundo bimestre2011Segundo bimestre2011
Segundo bimestre2011
 

Viewers also liked

tollbrothers 10-Q-jan_2001
 tollbrothers   10-Q-jan_2001 tollbrothers   10-Q-jan_2001
tollbrothers 10-Q-jan_2001finance50
 
bli_code_of_business_conduct_ethics
bli_code_of_business_conduct_ethicsbli_code_of_business_conduct_ethics
bli_code_of_business_conduct_ethicsfinance50
 
tollbrothers 10-Q_jan_2006
 tollbrothers   10-Q_jan_2006 tollbrothers   10-Q_jan_2006
tollbrothers 10-Q_jan_2006finance50
 
toll brothers 2003-10k
toll brothers  2003-10ktoll brothers  2003-10k
toll brothers 2003-10kfinance50
 
tollbrothers 10_Q_jul_2006
 tollbrothers   10_Q_jul_2006 tollbrothers   10_Q_jul_2006
tollbrothers 10_Q_jul_2006finance50
 

Viewers also liked (7)

tollbrothers 10-Q-jan_2001
 tollbrothers   10-Q-jan_2001 tollbrothers   10-Q-jan_2001
tollbrothers 10-Q-jan_2001
 
bli_code_of_business_conduct_ethics
bli_code_of_business_conduct_ethicsbli_code_of_business_conduct_ethics
bli_code_of_business_conduct_ethics
 
summary
summarysummary
summary
 
tollbrothers 10-Q_jan_2006
 tollbrothers   10-Q_jan_2006 tollbrothers   10-Q_jan_2006
tollbrothers 10-Q_jan_2006
 
TOL_2000_AR
TOL_2000_ARTOL_2000_AR
TOL_2000_AR
 
toll brothers 2003-10k
toll brothers  2003-10ktoll brothers  2003-10k
toll brothers 2003-10k
 
tollbrothers 10_Q_jul_2006
 tollbrothers   10_Q_jul_2006 tollbrothers   10_Q_jul_2006
tollbrothers 10_Q_jul_2006
 

Similar to Toll Brothers historical statistics summary 1997-2008

Galaxy Gaming (GLXZ) Q1 2012 Investor Presentation
Galaxy Gaming (GLXZ) Q1 2012 Investor Presentation Galaxy Gaming (GLXZ) Q1 2012 Investor Presentation
Galaxy Gaming (GLXZ) Q1 2012 Investor Presentation Galaxy Gaming, Inc.
 
toll brothers Toll_23Year
toll brothers Toll_23Yeartoll brothers Toll_23Year
toll brothers Toll_23Yearfinance50
 
tollbrothers Toll_23Year
 tollbrothers   Toll_23Year tollbrothers   Toll_23Year
tollbrothers Toll_23Yearfinance50
 
Galaxy Gaming (GLXZ) Q2 2012 Investor Presentation
Galaxy Gaming (GLXZ) Q2 2012 Investor Presentation Galaxy Gaming (GLXZ) Q2 2012 Investor Presentation
Galaxy Gaming (GLXZ) Q2 2012 Investor Presentation Galaxy Gaming, Inc.
 
Dr. David Kohl - Financial and Management Planning for Young Producers
Dr. David Kohl - Financial and Management Planning for Young ProducersDr. David Kohl - Financial and Management Planning for Young Producers
Dr. David Kohl - Financial and Management Planning for Young ProducersJohn Blue
 
年金終值計算
年金終值計算年金終值計算
年金終值計算5045033
 
Grand Lake OK 2005 2011 full year real estate market analysis
Grand Lake OK 2005   2011 full year real estate market analysisGrand Lake OK 2005   2011 full year real estate market analysis
Grand Lake OK 2005 2011 full year real estate market analysisRE/MAX Grand Lake
 
事業計画書
事業計画書事業計画書
事業計画書翔新 史
 
Data Warehouse Project-Report Analysis
Data Warehouse Project-Report AnalysisData Warehouse Project-Report Analysis
Data Warehouse Project-Report AnalysisSunny U Okoro
 
2010 q3 google_earnings_slides
2010 q3 google_earnings_slides2010 q3 google_earnings_slides
2010 q3 google_earnings_slidesrabier
 

Similar to Toll Brothers historical statistics summary 1997-2008 (20)

Galaxy Gaming (GLXZ) Q1 2012 Investor Presentation
Galaxy Gaming (GLXZ) Q1 2012 Investor Presentation Galaxy Gaming (GLXZ) Q1 2012 Investor Presentation
Galaxy Gaming (GLXZ) Q1 2012 Investor Presentation
 
toll brothers Toll_23Year
toll brothers Toll_23Yeartoll brothers Toll_23Year
toll brothers Toll_23Year
 
Toll_23Year
Toll_23YearToll_23Year
Toll_23Year
 
Toll_23Year
Toll_23YearToll_23Year
Toll_23Year
 
tollbrothers Toll_23Year
 tollbrothers   Toll_23Year tollbrothers   Toll_23Year
tollbrothers Toll_23Year
 
Galaxy Gaming (GLXZ) Q2 2012 Investor Presentation
Galaxy Gaming (GLXZ) Q2 2012 Investor Presentation Galaxy Gaming (GLXZ) Q2 2012 Investor Presentation
Galaxy Gaming (GLXZ) Q2 2012 Investor Presentation
 
Dr. David Kohl - Financial and Management Planning for Young Producers
Dr. David Kohl - Financial and Management Planning for Young ProducersDr. David Kohl - Financial and Management Planning for Young Producers
Dr. David Kohl - Financial and Management Planning for Young Producers
 
2011noviembre diciembre
2011noviembre diciembre2011noviembre diciembre
2011noviembre diciembre
 
Montos 20112 11
Montos 20112 11Montos 20112 11
Montos 20112 11
 
年金終值計算
年金終值計算年金終值計算
年金終值計算
 
Grand Lake OK 2005 2011 full year real estate market analysis
Grand Lake OK 2005   2011 full year real estate market analysisGrand Lake OK 2005   2011 full year real estate market analysis
Grand Lake OK 2005 2011 full year real estate market analysis
 
Cuarto bimestre2010
Cuarto bimestre2010Cuarto bimestre2010
Cuarto bimestre2010
 
Southwest California 2009 Housing Recap
Southwest California 2009 Housing RecapSouthwest California 2009 Housing Recap
Southwest California 2009 Housing Recap
 
2009 Southwest California Housing Summary
2009 Southwest California Housing Summary2009 Southwest California Housing Summary
2009 Southwest California Housing Summary
 
Sexto bimestre2010
Sexto bimestre2010Sexto bimestre2010
Sexto bimestre2010
 
Segundo bimestre2010
Segundo bimestre2010Segundo bimestre2010
Segundo bimestre2010
 
Primer bimestre2010
Primer bimestre2010Primer bimestre2010
Primer bimestre2010
 
事業計画書
事業計画書事業計画書
事業計画書
 
Data Warehouse Project-Report Analysis
Data Warehouse Project-Report AnalysisData Warehouse Project-Report Analysis
Data Warehouse Project-Report Analysis
 
2010 q3 google_earnings_slides
2010 q3 google_earnings_slides2010 q3 google_earnings_slides
2010 q3 google_earnings_slides
 

More from finance50

Scania Presentation_Q2_2008_tcm10-211097
Scania Presentation_Q2_2008_tcm10-211097Scania Presentation_Q2_2008_tcm10-211097
Scania Presentation_Q2_2008_tcm10-211097finance50
 
Scania%20Jan%20Ytterberg%2C%20CFO_tcm10-214730
Scania%20Jan%20Ytterberg%2C%20CFO_tcm10-214730Scania%20Jan%20Ytterberg%2C%20CFO_tcm10-214730
Scania%20Jan%20Ytterberg%2C%20CFO_tcm10-214730finance50
 
Scania Presentation%20Q3%202008_tcm10-219195
Scania Presentation%20Q3%202008_tcm10-219195Scania Presentation%20Q3%202008_tcm10-219195
Scania Presentation%20Q3%202008_tcm10-219195finance50
 
Scania HQ%20Bank%20Investor%20meeting_tcm10-219785
Scania HQ%20Bank%20Investor%20meeting_tcm10-219785Scania HQ%20Bank%20Investor%20meeting_tcm10-219785
Scania HQ%20Bank%20Investor%20meeting_tcm10-219785finance50
 
Scania Presentation-Q4-2008_tcm10-227202
Scania Presentation-Q4-2008_tcm10-227202Scania Presentation-Q4-2008_tcm10-227202
Scania Presentation-Q4-2008_tcm10-227202finance50
 
scana Presentation%20Q3%202008_tcm10-219195
scana  Presentation%20Q3%202008_tcm10-219195scana  Presentation%20Q3%202008_tcm10-219195
scana Presentation%20Q3%202008_tcm10-219195finance50
 
Scania%202008%20Q3%20report%20FINAL_tcm10-219196
Scania%202008%20Q3%20report%20FINAL_tcm10-219196Scania%202008%20Q3%20report%20FINAL_tcm10-219196
Scania%202008%20Q3%20report%20FINAL_tcm10-219196finance50
 
Scania%202008%20Q3%20svensk%20rapport%20FINAL_tcm10-219191
Scania%202008%20Q3%20svensk%20rapport%20FINAL_tcm10-219191Scania%202008%20Q3%20svensk%20rapport%20FINAL_tcm10-219191
Scania%202008%20Q3%20svensk%20rapport%20FINAL_tcm10-219191finance50
 
scana Presentation-Q4-2008_tcm10-227202
scana  Presentation-Q4-2008_tcm10-227202scana  Presentation-Q4-2008_tcm10-227202
scana Presentation-Q4-2008_tcm10-227202finance50
 
Scania%20bokslutskommunik%C3%A9%202008_tcm10-227198
Scania%20bokslutskommunik%C3%A9%202008_tcm10-227198Scania%20bokslutskommunik%C3%A9%202008_tcm10-227198
Scania%20bokslutskommunik%C3%A9%202008_tcm10-227198finance50
 
scana 2008_SV_lowres_tcm10-229942
scana  2008_SV_lowres_tcm10-229942scana  2008_SV_lowres_tcm10-229942
scana 2008_SV_lowres_tcm10-229942finance50
 
scana 66684-EN_2008_lowres_tcm10-229950
scana  66684-EN_2008_lowres_tcm10-229950scana  66684-EN_2008_lowres_tcm10-229950
scana 66684-EN_2008_lowres_tcm10-229950finance50
 
perini nyse_compliance
perini   nyse_complianceperini   nyse_compliance
perini nyse_compliancefinance50
 
perini nyse_compliance
perini   nyse_complianceperini   nyse_compliance
perini nyse_compliancefinance50
 
perini corporategovernanceguidelines
perini   corporategovernanceguidelinesperini   corporategovernanceguidelines
perini corporategovernanceguidelinesfinance50
 
perini corporategovernanceguidelines
perini   corporategovernanceguidelinesperini   corporategovernanceguidelines
perini corporategovernanceguidelinesfinance50
 
perini CodeBusinessConductEthics
perini   CodeBusinessConductEthicsperini   CodeBusinessConductEthics
perini CodeBusinessConductEthicsfinance50
 
perini CodeBusinessConductEthics
perini   CodeBusinessConductEthicsperini   CodeBusinessConductEthics
perini CodeBusinessConductEthicsfinance50
 
perini corporate_governance_nominating
perini   corporate_governance_nominatingperini   corporate_governance_nominating
perini corporate_governance_nominatingfinance50
 
perini compensationcommitteecharter
perini   compensationcommitteecharterperini   compensationcommitteecharter
perini compensationcommitteecharterfinance50
 

More from finance50 (20)

Scania Presentation_Q2_2008_tcm10-211097
Scania Presentation_Q2_2008_tcm10-211097Scania Presentation_Q2_2008_tcm10-211097
Scania Presentation_Q2_2008_tcm10-211097
 
Scania%20Jan%20Ytterberg%2C%20CFO_tcm10-214730
Scania%20Jan%20Ytterberg%2C%20CFO_tcm10-214730Scania%20Jan%20Ytterberg%2C%20CFO_tcm10-214730
Scania%20Jan%20Ytterberg%2C%20CFO_tcm10-214730
 
Scania Presentation%20Q3%202008_tcm10-219195
Scania Presentation%20Q3%202008_tcm10-219195Scania Presentation%20Q3%202008_tcm10-219195
Scania Presentation%20Q3%202008_tcm10-219195
 
Scania HQ%20Bank%20Investor%20meeting_tcm10-219785
Scania HQ%20Bank%20Investor%20meeting_tcm10-219785Scania HQ%20Bank%20Investor%20meeting_tcm10-219785
Scania HQ%20Bank%20Investor%20meeting_tcm10-219785
 
Scania Presentation-Q4-2008_tcm10-227202
Scania Presentation-Q4-2008_tcm10-227202Scania Presentation-Q4-2008_tcm10-227202
Scania Presentation-Q4-2008_tcm10-227202
 
scana Presentation%20Q3%202008_tcm10-219195
scana  Presentation%20Q3%202008_tcm10-219195scana  Presentation%20Q3%202008_tcm10-219195
scana Presentation%20Q3%202008_tcm10-219195
 
Scania%202008%20Q3%20report%20FINAL_tcm10-219196
Scania%202008%20Q3%20report%20FINAL_tcm10-219196Scania%202008%20Q3%20report%20FINAL_tcm10-219196
Scania%202008%20Q3%20report%20FINAL_tcm10-219196
 
Scania%202008%20Q3%20svensk%20rapport%20FINAL_tcm10-219191
Scania%202008%20Q3%20svensk%20rapport%20FINAL_tcm10-219191Scania%202008%20Q3%20svensk%20rapport%20FINAL_tcm10-219191
Scania%202008%20Q3%20svensk%20rapport%20FINAL_tcm10-219191
 
scana Presentation-Q4-2008_tcm10-227202
scana  Presentation-Q4-2008_tcm10-227202scana  Presentation-Q4-2008_tcm10-227202
scana Presentation-Q4-2008_tcm10-227202
 
Scania%20bokslutskommunik%C3%A9%202008_tcm10-227198
Scania%20bokslutskommunik%C3%A9%202008_tcm10-227198Scania%20bokslutskommunik%C3%A9%202008_tcm10-227198
Scania%20bokslutskommunik%C3%A9%202008_tcm10-227198
 
scana 2008_SV_lowres_tcm10-229942
scana  2008_SV_lowres_tcm10-229942scana  2008_SV_lowres_tcm10-229942
scana 2008_SV_lowres_tcm10-229942
 
scana 66684-EN_2008_lowres_tcm10-229950
scana  66684-EN_2008_lowres_tcm10-229950scana  66684-EN_2008_lowres_tcm10-229950
scana 66684-EN_2008_lowres_tcm10-229950
 
perini nyse_compliance
perini   nyse_complianceperini   nyse_compliance
perini nyse_compliance
 
perini nyse_compliance
perini   nyse_complianceperini   nyse_compliance
perini nyse_compliance
 
perini corporategovernanceguidelines
perini   corporategovernanceguidelinesperini   corporategovernanceguidelines
perini corporategovernanceguidelines
 
perini corporategovernanceguidelines
perini   corporategovernanceguidelinesperini   corporategovernanceguidelines
perini corporategovernanceguidelines
 
perini CodeBusinessConductEthics
perini   CodeBusinessConductEthicsperini   CodeBusinessConductEthics
perini CodeBusinessConductEthics
 
perini CodeBusinessConductEthics
perini   CodeBusinessConductEthicsperini   CodeBusinessConductEthics
perini CodeBusinessConductEthics
 
perini corporate_governance_nominating
perini   corporate_governance_nominatingperini   corporate_governance_nominating
perini corporate_governance_nominating
 
perini compensationcommitteecharter
perini   compensationcommitteecharterperini   compensationcommitteecharter
perini compensationcommitteecharter
 

Recently uploaded

Solution Manual for Financial Accounting, 11th Edition by Robert Libby, Patri...
Solution Manual for Financial Accounting, 11th Edition by Robert Libby, Patri...Solution Manual for Financial Accounting, 11th Edition by Robert Libby, Patri...
Solution Manual for Financial Accounting, 11th Edition by Robert Libby, Patri...ssifa0344
 
00_Main ppt_MeetupDORA&CyberSecurity.pptx
00_Main ppt_MeetupDORA&CyberSecurity.pptx00_Main ppt_MeetupDORA&CyberSecurity.pptx
00_Main ppt_MeetupDORA&CyberSecurity.pptxFinTech Belgium
 
Q3 2024 Earnings Conference Call and Webcast Slides
Q3 2024 Earnings Conference Call and Webcast SlidesQ3 2024 Earnings Conference Call and Webcast Slides
Q3 2024 Earnings Conference Call and Webcast SlidesMarketing847413
 
How Automation is Driving Efficiency Through the Last Mile of Reporting
How Automation is Driving Efficiency Through the Last Mile of ReportingHow Automation is Driving Efficiency Through the Last Mile of Reporting
How Automation is Driving Efficiency Through the Last Mile of ReportingAggregage
 
Call Girls In Yusuf Sarai Women Seeking Men 9654467111
Call Girls In Yusuf Sarai Women Seeking Men 9654467111Call Girls In Yusuf Sarai Women Seeking Men 9654467111
Call Girls In Yusuf Sarai Women Seeking Men 9654467111Sapana Sha
 
Andheri Call Girls In 9825968104 Mumbai Hot Models
Andheri Call Girls In 9825968104 Mumbai Hot ModelsAndheri Call Girls In 9825968104 Mumbai Hot Models
Andheri Call Girls In 9825968104 Mumbai Hot Modelshematsharma006
 
Dividend Policy and Dividend Decision Theories.pptx
Dividend Policy and Dividend Decision Theories.pptxDividend Policy and Dividend Decision Theories.pptx
Dividend Policy and Dividend Decision Theories.pptxanshikagoel52
 
The Economic History of the U.S. Lecture 18.pdf
The Economic History of the U.S. Lecture 18.pdfThe Economic History of the U.S. Lecture 18.pdf
The Economic History of the U.S. Lecture 18.pdfGale Pooley
 
Log your LOA pain with Pension Lab's brilliant campaign
Log your LOA pain with Pension Lab's brilliant campaignLog your LOA pain with Pension Lab's brilliant campaign
Log your LOA pain with Pension Lab's brilliant campaignHenry Tapper
 
Quarter 4- Module 3 Principles of Marketing
Quarter 4- Module 3 Principles of MarketingQuarter 4- Module 3 Principles of Marketing
Quarter 4- Module 3 Principles of MarketingMaristelaRamos12
 
Independent Lucknow Call Girls 8923113531WhatsApp Lucknow Call Girls make you...
Independent Lucknow Call Girls 8923113531WhatsApp Lucknow Call Girls make you...Independent Lucknow Call Girls 8923113531WhatsApp Lucknow Call Girls make you...
Independent Lucknow Call Girls 8923113531WhatsApp Lucknow Call Girls make you...makika9823
 
Best VIP Call Girls Noida Sector 18 Call Me: 8448380779
Best VIP Call Girls Noida Sector 18 Call Me: 8448380779Best VIP Call Girls Noida Sector 18 Call Me: 8448380779
Best VIP Call Girls Noida Sector 18 Call Me: 8448380779Delhi Call girls
 
VIP Call Girls Service Dilsukhnagar Hyderabad Call +91-8250192130
VIP Call Girls Service Dilsukhnagar Hyderabad Call +91-8250192130VIP Call Girls Service Dilsukhnagar Hyderabad Call +91-8250192130
VIP Call Girls Service Dilsukhnagar Hyderabad Call +91-8250192130Suhani Kapoor
 
Booking open Available Pune Call Girls Shivane 6297143586 Call Hot Indian Gi...
Booking open Available Pune Call Girls Shivane  6297143586 Call Hot Indian Gi...Booking open Available Pune Call Girls Shivane  6297143586 Call Hot Indian Gi...
Booking open Available Pune Call Girls Shivane 6297143586 Call Hot Indian Gi...Call Girls in Nagpur High Profile
 
VIP Kolkata Call Girl Serampore 👉 8250192130 Available With Room
VIP Kolkata Call Girl Serampore 👉 8250192130  Available With RoomVIP Kolkata Call Girl Serampore 👉 8250192130  Available With Room
VIP Kolkata Call Girl Serampore 👉 8250192130 Available With Roomdivyansh0kumar0
 
VIP Call Girls LB Nagar ( Hyderabad ) Phone 8250192130 | ₹5k To 25k With Room...
VIP Call Girls LB Nagar ( Hyderabad ) Phone 8250192130 | ₹5k To 25k With Room...VIP Call Girls LB Nagar ( Hyderabad ) Phone 8250192130 | ₹5k To 25k With Room...
VIP Call Girls LB Nagar ( Hyderabad ) Phone 8250192130 | ₹5k To 25k With Room...Suhani Kapoor
 
Russian Call Girls In Gtb Nagar (Delhi) 9711199012 💋✔💕😘 Naughty Call Girls Se...
Russian Call Girls In Gtb Nagar (Delhi) 9711199012 💋✔💕😘 Naughty Call Girls Se...Russian Call Girls In Gtb Nagar (Delhi) 9711199012 💋✔💕😘 Naughty Call Girls Se...
Russian Call Girls In Gtb Nagar (Delhi) 9711199012 💋✔💕😘 Naughty Call Girls Se...shivangimorya083
 
Instant Issue Debit Cards - High School Spirit
Instant Issue Debit Cards - High School SpiritInstant Issue Debit Cards - High School Spirit
Instant Issue Debit Cards - High School Spiritegoetzinger
 

Recently uploaded (20)

Veritas Interim Report 1 January–31 March 2024
Veritas Interim Report 1 January–31 March 2024Veritas Interim Report 1 January–31 March 2024
Veritas Interim Report 1 January–31 March 2024
 
Solution Manual for Financial Accounting, 11th Edition by Robert Libby, Patri...
Solution Manual for Financial Accounting, 11th Edition by Robert Libby, Patri...Solution Manual for Financial Accounting, 11th Edition by Robert Libby, Patri...
Solution Manual for Financial Accounting, 11th Edition by Robert Libby, Patri...
 
00_Main ppt_MeetupDORA&CyberSecurity.pptx
00_Main ppt_MeetupDORA&CyberSecurity.pptx00_Main ppt_MeetupDORA&CyberSecurity.pptx
00_Main ppt_MeetupDORA&CyberSecurity.pptx
 
Q3 2024 Earnings Conference Call and Webcast Slides
Q3 2024 Earnings Conference Call and Webcast SlidesQ3 2024 Earnings Conference Call and Webcast Slides
Q3 2024 Earnings Conference Call and Webcast Slides
 
How Automation is Driving Efficiency Through the Last Mile of Reporting
How Automation is Driving Efficiency Through the Last Mile of ReportingHow Automation is Driving Efficiency Through the Last Mile of Reporting
How Automation is Driving Efficiency Through the Last Mile of Reporting
 
Call Girls In Yusuf Sarai Women Seeking Men 9654467111
Call Girls In Yusuf Sarai Women Seeking Men 9654467111Call Girls In Yusuf Sarai Women Seeking Men 9654467111
Call Girls In Yusuf Sarai Women Seeking Men 9654467111
 
Andheri Call Girls In 9825968104 Mumbai Hot Models
Andheri Call Girls In 9825968104 Mumbai Hot ModelsAndheri Call Girls In 9825968104 Mumbai Hot Models
Andheri Call Girls In 9825968104 Mumbai Hot Models
 
Dividend Policy and Dividend Decision Theories.pptx
Dividend Policy and Dividend Decision Theories.pptxDividend Policy and Dividend Decision Theories.pptx
Dividend Policy and Dividend Decision Theories.pptx
 
The Economic History of the U.S. Lecture 18.pdf
The Economic History of the U.S. Lecture 18.pdfThe Economic History of the U.S. Lecture 18.pdf
The Economic History of the U.S. Lecture 18.pdf
 
Log your LOA pain with Pension Lab's brilliant campaign
Log your LOA pain with Pension Lab's brilliant campaignLog your LOA pain with Pension Lab's brilliant campaign
Log your LOA pain with Pension Lab's brilliant campaign
 
Quarter 4- Module 3 Principles of Marketing
Quarter 4- Module 3 Principles of MarketingQuarter 4- Module 3 Principles of Marketing
Quarter 4- Module 3 Principles of Marketing
 
Independent Lucknow Call Girls 8923113531WhatsApp Lucknow Call Girls make you...
Independent Lucknow Call Girls 8923113531WhatsApp Lucknow Call Girls make you...Independent Lucknow Call Girls 8923113531WhatsApp Lucknow Call Girls make you...
Independent Lucknow Call Girls 8923113531WhatsApp Lucknow Call Girls make you...
 
Best VIP Call Girls Noida Sector 18 Call Me: 8448380779
Best VIP Call Girls Noida Sector 18 Call Me: 8448380779Best VIP Call Girls Noida Sector 18 Call Me: 8448380779
Best VIP Call Girls Noida Sector 18 Call Me: 8448380779
 
Commercial Bank Economic Capsule - April 2024
Commercial Bank Economic Capsule - April 2024Commercial Bank Economic Capsule - April 2024
Commercial Bank Economic Capsule - April 2024
 
VIP Call Girls Service Dilsukhnagar Hyderabad Call +91-8250192130
VIP Call Girls Service Dilsukhnagar Hyderabad Call +91-8250192130VIP Call Girls Service Dilsukhnagar Hyderabad Call +91-8250192130
VIP Call Girls Service Dilsukhnagar Hyderabad Call +91-8250192130
 
Booking open Available Pune Call Girls Shivane 6297143586 Call Hot Indian Gi...
Booking open Available Pune Call Girls Shivane  6297143586 Call Hot Indian Gi...Booking open Available Pune Call Girls Shivane  6297143586 Call Hot Indian Gi...
Booking open Available Pune Call Girls Shivane 6297143586 Call Hot Indian Gi...
 
VIP Kolkata Call Girl Serampore 👉 8250192130 Available With Room
VIP Kolkata Call Girl Serampore 👉 8250192130  Available With RoomVIP Kolkata Call Girl Serampore 👉 8250192130  Available With Room
VIP Kolkata Call Girl Serampore 👉 8250192130 Available With Room
 
VIP Call Girls LB Nagar ( Hyderabad ) Phone 8250192130 | ₹5k To 25k With Room...
VIP Call Girls LB Nagar ( Hyderabad ) Phone 8250192130 | ₹5k To 25k With Room...VIP Call Girls LB Nagar ( Hyderabad ) Phone 8250192130 | ₹5k To 25k With Room...
VIP Call Girls LB Nagar ( Hyderabad ) Phone 8250192130 | ₹5k To 25k With Room...
 
Russian Call Girls In Gtb Nagar (Delhi) 9711199012 💋✔💕😘 Naughty Call Girls Se...
Russian Call Girls In Gtb Nagar (Delhi) 9711199012 💋✔💕😘 Naughty Call Girls Se...Russian Call Girls In Gtb Nagar (Delhi) 9711199012 💋✔💕😘 Naughty Call Girls Se...
Russian Call Girls In Gtb Nagar (Delhi) 9711199012 💋✔💕😘 Naughty Call Girls Se...
 
Instant Issue Debit Cards - High School Spirit
Instant Issue Debit Cards - High School SpiritInstant Issue Debit Cards - High School Spirit
Instant Issue Debit Cards - High School Spirit
 

Toll Brothers historical statistics summary 1997-2008

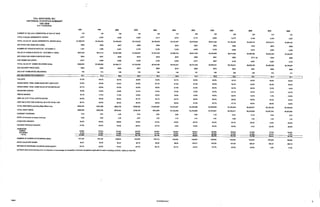
  • 1. TOLL BROTHERS, INC. HISTORICAL STATISTICS SUMMARY 1997-2008 ($ IN THOUSANDS) 1997 1998 1999 2000 2001 2002 2003 2004 2005 2006 2007 2008 116 NUMBER OF SELLING COMMUNITIES AT END OF YEAR 122 140 146 155 170 200 220 230 300 315 273 TOTAL # SALES AGREEMENTS SIGNED 2,701 3,387 3,845 4,364 4,314 5,070 6,132 8,684 10,372 6,164 4,440 2,927 $1,069,279 TOTAL VALUE OF SALES AGREEMENTS SIGNED (000s) $1,383,093 $1,640,990 $2,134,522 $2,158,536 $2,734,457 $3,475,992 $5,641,454 $7,152,463 $4,460,734 $3,010,013 $1,608,191 AVG PRICE PER HOME SOLD (OOOs) $396 $408 $489 $427 $500 $539 $567 $650 $690 $724 $678 $549 NUMBER OF HOMES IN BACKLOG - OCTOBER 31 1,551 1,892 2,381 2,746 2,702 3,342 4,652 6,709 8,805 6,533 3,950 2,046 VALUE OF HOMES IN BACKLOG - OCTOBER 31 (OOOs) $627,220 $814,714 $1,067,685 $1,425,521 $1,403,588 $2,631,900 $1,858,784 $4,433,895 $6,014,648 $4,488,400 $2,854,435 $1,325,491 AVG PRICE PER HOME IN BACKLOG (OOOs) $404 $431 $448 $519 $519 $556 $566 $661 $683 $713 (a) $766 $648 # OF HOMES DELIVERED 2,517 3,093 3,945 3,555 4,358 4,430 4,911 6627 8,769 8,601 6,687 4,743 $968,253 TOTAL VALUE OF HOMES DELIVERED (OOOs) $1,206,290 $1,762,930 $1,438,171 $2,180,469 $2,279,261 $2,731,044 $3,839,451 $5,759,301 $5,945,169 $4,495,600 $3,106,291 AVG DELIVERY PRICE (OOOs) $385 $389 $405 $447 $500 $515 $556 $579 $657 $691 $698 $655 AVG # OF COMMUNITIES DELIVERING 102 114 126 136 144 148 151 185 225 245 214 171 —— — 3S.8 39.0 35.1 31.3 27.7 1 TAX RATE 37.0% 36.1% 36.8% 36.7% 36.8% 36.7% 36.8% 39.1% 49.6% 36.2% 36.8% 39.0% GROSS MARG. TRAD. HOME SALES BEF. WRITE-OFF 22.9% 22.8% 22.6% 24.6% 27.1% 27.6% 27.8% 28.6% 32.3% 30.8% 26.4% 20.4% GROSS MARG. TRAD. HOME SALES AFTER WRITE-OFF 22.7% 22.6% 22.3% 24.2% 26.5% 27.4% 27.6% 28.4% 32.2% 28.3% 12.6% -0.4% OPERATING MARGIN 10.8% 10.8% 10.6% 12.1% 14.3% 14.4% 14.6% 16.2% 21.7% 16.7% •0.1% -12.7% PRETAX MARGIN 10.7% 11.0% 11.0% 12.8% 15.3% 15.0% 14.9% 16.8% 22.8% 18.4% 1.5% -14.8% DEBT AS % OF TOTAL CAPITALIZATION 56.9% 46.2% 52.6% 51.7% 53.1% 48.7% 49.5% 46.0% 38.6% 39.5% 38.3% 39.3% DEBT Net of EXC CASH & Mkt Sec AS % OF TOTAL CAP. 49.1% 42.0% 49.2% 46.4% 48.5% 46.5% 41.2% 35.7% 27.7% 32.0% 26.9% 12.8% TOTAL DEBT(SOOO) excluding Mtge Whse Loan $509,503 $451,588 $682,735 $796,036 $1,032,293 $1,072,857 $1,448,366 $1,636,045 $1,740,580 $2,228,101 $2,189,120 $2,100,039 TOTAL EQUITY($OOO) $385,252 $525,756 $616,334 $745,145 $912,583 $1,129,509 $1,476,628 $1,919,987 $2,763,571 $3,415,926 $3,527,234 $3,237,653 INTEREST COVERAGE • 4.19 4.91 5.16 4.40 5.53 5.00 5.05 7.12 13.21 11.14 6.44 2.01 RATIO of Inventory to house revenues 0.95 0.92 1.00 0.97 1.00 1.12 1.13 1.01 0.88 1.03 - 1.24 1.33 INVENTORY GROWTH 19.3% 20.6% 29.8% 18.6% 27.5% 16.8% 20.7% 25.9% 30.7% 20.3% - -8.6% -25.9% HOUSING REVENUE GROWTH 27.5% 24.6% 19.2% 22.6% 23.7% 4.5% 19.8% 40.6% 50.0% 3.2% -24.4% -30.9% HOMESITES OWNED 12,820 15,578 22,275 23,163 25,981 25,822 29,081 29,804 35,838 41,808 37139 32,081 OPTIONED 9,145 14,803 10,843 11,268 13,165 15,022 18,977 30,385 47,288 31,960 TOTAL 60,189 ,126 NUMBER OF SHARES OUTSTANDING (OOOs) 137,102 147,742 143,850 145,814 139,112 140,432 146,644 149,642 154,943 153,899 157,008 160369 BOOK VALUE PER SHARE $2.81 $3.56 $4.23 $5.18 $6.56 $8.04 $10.07 $12.83 $17.84 $22.20 $22.47 $20.19 RETURN ON BEGINNING SHAREHOLDERS EOUITY 20.7% 22.0% 19.3% 23.7% 28.7% 24.1% 23.0% 27.7% 42.0% 24.9% 1.0% -8.4% (a) Based upon gross backlog prior to reduction of percentage of completion revenues recognized applicable to units in backlog of $170.1 million at 10/31/06. FIN09 quot;CONFIDENTIALquot;
  • 2. TOLL BROTHERS, INC. HISTORICAL STATEMENT OF OPERATIONS 1997-2008 {$ IN THOUSANDS) 1997 1998 1999 2001 aaaa 2003 200Z 2SM 2006 2007 2008 $ % s % S % s % $ $ % $ $ REVENUES Completed contract $968,253 $1,206,290 $1,438,171 1,762,930 2,279,261 2,731,044 3,839,451 5,759,301 $2,180,469 5,945,169 4,495,600 $3,106,293 Percentage of completion 170,111 139,493 41,873 Land sales 17,345 38,730 36,183 27,399 22,491 34,124 27,530 8,173 Total Revenues 2,315,' 100.00quot;, 58,443 100.00quot;/ 3,861,942 100.00°/ 5,793,425 100.00quot;/ii 6,123,453 100.00quot;/o 4,646,979 100.00quot;/. 3,158,213 100.00% COST OF REVENUES Completed contract before impairments 746,275 77.07% 931,833 77.25quot;/. 1,112,780 77.37% 1,329,612 75.42quot;/. 1,589,242 72.89quot;/. 1,649,250 72.36quot;/. 1,971,801 72.20quot;/. 2,739,822 71.36quot;/. 3,897,617 67.68quot;/. 4,111,155 69.15quot;/. 3,307,455 73.57% 2,472,401 79.59% Percentage of completion 132,268 77.75quot;/. 108,954 78.11quot;/. 36,221 86.50quot;/. Land sales 29,809 13,375 77.11quot;/. 76.97quot;/. 21,464 77.97quot;/. 25,671 70.95% 17,875 65.24quot;/. 15,775 70.14quot;/. 24,416 71.55quot;/. 6,997 85.61quot;/. 8,069 67.89quot;/. 4,818 47.95quot;/. Writeoffs of predevel. & impairments 2,048 0.21quot;/= 2,020 0.17quot;/. 7,448 0.35% 5,092 0.42quot;/. 13,034 0.60quot;/. 6,081 5,638 0.27quot;/. 0.21quot;/. 7,452 0.19quot;/. 5,080 0.09quot;/. 152,045 619,516 2.56% 13.78quot;/, 644,991 20.76quot;/. Recovery of prior writedowns (21,064) -0.47quot;/. -3.92quot;/. (121,674) Interest 29,390 3.04quot;/. 35,941 2.98quot;/. 46,169 39,905 2.74quot;/. 2.56quot;/. 58,247 2.64% 84,529 2.79quot;/. 73,245 2.66quot;/. 93,303 2.42quot;/. 125,283 2.16quot;/. 121,993 102,447 1.99quot;/. 2.20quot;/. 2.81quot;/. 88,861 Total Expenses 6.18quot;/i 1,745,531 75.33quot;/ 2,068,559 74.99quot;/( !,856,352 73.96quot;/! 4,052,396 69.95quot;/. 4,524,458 73.89quot;/. 4,125,377 88.78quot;/. 3,125,618 98.97quot;/. Selling Expenses 34,778 3.59quot;/. 43,854 3.64quot;/. 50,895 3.50quot;/. 65,561 3.64quot;/. 79,450 3.60quot;/. 92,092 3.98% 106,265 3.85quot;/. 134,331 3.48quot;/. 3.20% 189,185 167,981 2.90quot;/. 195,765 4.07quot;/. 154,195 General & Administrative 4.88% 51,523 5.32quot;/. 62,875 5.21quot;/. 79,318 5.45quot;/. 104,797 5.82quot;/. 130,279 5.90quot;/. 144,031 6.22quot;/. 6.60quot;/. 182,072 246,749 6.39quot;/. 6.17quot;/. 314,805 5.43quot;/, 327,544 377,639 7.05quot;/. 275,699 Total SG&A 8.73% 86,301 8.91quot;/. 106,729 8.85quot;/. 130,213 8.95quot;/. 9.46quot;/. 170,358 209,729 9.50quot;/. 236,123 10.20quot;/. 288,337 10.45quot;/. 381,080 9.87quot;/. 9.36quot;/. 573,404 482,786 8.33quot;/. 516,729 11.12quot;/. Goodwill write-off 429,894 13.61% 8,973 3,233 Income (loss) from operations I 104,239 10.77quot;/. 129,767 10.76quot;/, 154,151 10.59quot;/, 218,264 12.11quot;/. 316,283 14.32quot;/. 333,790 14.42quot;/. 401,547 14.56quot;/. 624,510 16.17quot;/. 1,258,243 21.72quot;/. (4,100) 1,025,591 16.75quot;/. -0.09quot;/. (400,532) -12.68quot;/, Other Income (loss) 3,407 4,526 8,599 12,702 21,606 13,528 16,798 31,151 68,941 74,780 101,025 (66,255) (Gain) loss from early retirement of debt (4,431) (1,770) (2,318) (7,192) (8,229) (4,056) PRETAX INCOME (LOSS) 15.3 347,318 15.00quot;/ 411,153 14.91quot;/ 647,432 16.76quot;/ 1,323,128 22.84quot;/. 1,126,616 18.40quot;/. 70,680 1.52quot;/. (466,787) -14.78quot;/. TAX PROVISION (BENEFIT) 38,139 47,819 58,866 85,023 124,216 127,431 151333 238,321 517,018 439,403 35,029 (168,977) NET INCOME (LOSS)* 9.68quot;/ 219,887 9.50quot;/( 259,820 9.42 409,1 10.59% 806,110 13.91quot;/. 687,213 11.22quot;/. 35,651 0.77quot;/. (297,810) -9.43quot;/. BASIC EARNINGS (LOSS) PER SHARE* $0.48 $0.58 $0.69 $1.01 $1.49 $1.56 $1.84 $2.75 $5.23 $4.45 $0.23 $(1.88) DILUTED EARNINGS (LOSS) PER SHARE* $0.44 $0.55 $0.68 $0.98 $1.38 $1.46 $1.72 $2.52 $4.78 $4.17 $0.22 $(1.88) * Before Change in Accounting F1N09 quot;CONFIDENTIALquot;
  • 3. TOLL BROTHERS, INC. HISTORICAL BALANCE SHEET 1997-2008 (5 IN THOUSANDS) 1997 1998 1999 2000 2001 2002 2003 2004 s % 2Q05 $ 2006 % 2007 % s % 2008 $ % $ ASSETS % $ % $ % $ % s % Cash 5147,575 13.2% $80,143 6.4% $96,484 5.8% $161,860 8.0% $182,840 7.2% $102,337 3.5% 234,489 Marketable Securities 6.2% 465,834 9.5% 689,219 10.9% 632,524 8.3% 900,337 12.5% 1,633,495 24.8% 190,762 Inventories 5.0% 115,029 2.3% 921,595 82.4% 1,111,863 88.6% 1,443,282 86.5% 1,712,383 84.3% 2,183,541 86.2% 2,551,061 88.1% 3,080,349 Property, Etc. 81.3% 3,878,260 79.1% 15,074 1.3% 5,068,624 14,425 79.9% 1.1% 6,095,702 80.4% 19,633 1.2% 5,572,655 24,075 1.2% 77.2% 33,095 4,127,475 1.3% 62.7% 38,496 43,711 1.3% Receivables, Prepaids & Other 1.2% 52,429 1.1% 21,832 2.0% 79,524 25,149 1.3% 99,089 2.0% 1.3% 68,459 4.1% 84,265 95,722 1.2% 4.7% 74,481 86,462 2.9% 1.3% 95,503 113,633 3.3% Contracts Receivable 3.0% 146,212 3.0% 185,620 2.9% 160,446 2.1% 135,910 1.9% 113,762 1 7% Mortgage Notes Receivable 2,539 0.2% 1,385 0.1% 170,111 2.2% 46,525 0.6% 26,758 1.1% 61,756 Customer Deposits Held in Escrow 2.1% 57,500 1.5% 99,914 2.0% 99,858 1.6% 9,961 0.9% 15,503 1.2% 130,326 1.7% 19,010 93,189 1.1% 17,303 1.3% 0.9% 17,303 49,255 0.7% 0.7% Investments In unconsoildated entities 23,019 0.8% 31,547 0.8% 53,929 1.1% 68,601 1.1% 6,000 0.5% 49,676 0.7% 34,367 21,194 1.3% 18,911 0.5% 0.9% 14,182 18,913 0.6% 0.3% Deferred tax assets 23,193 0.8% 35,400 0.9% 93,971 1.9% 152,394 2.4% 3.2% 245,667 183,171 2.5% 151,771 2.3% r 1,118,626 100.0% 1,254,468 100.0% 169,897 1,668,062 2.4% 100.0% 2,030,254 100.0% 405,703 2,532,200 6.2% 100.0% 2 895 365 100.0% 6,343,840 100.0% 7,583,541 100.0% 7,220,316 100.0% 6,586,836 100.0% LIABILITiES & EQUITY Bank Loans $168,000 $156,000 $186,000 $300,000 $322,520 Senior Debt $207,500 222,500 222,500 0 300,000 331,667 331,667 Subordinated Debt 546,669 845,665 319,924 1,140,028 269,296 1,141,167 469,418 1,142,306 469,499 669,581 1,143,445 Mortgage Company Warehouse Line 819,663 620,000 450,000 350,000 350,000 350,000 24,754 343,000 Other Loans 48,996 49,939 92,053 21,579 89,674 26,292 119,705 76,730 27,317 26,537 40,192 37,867 Customer Deposits 45,694 59,197 117,880 52,698 250,552 69,398 436,934 365,147 82,495 104,924 101,778 281,927 Accts Payable & Accrued Expenses 134,707 176,710 291,424 123,837 415,602 155,530 360,147 260,155 226,612 296,068 362,641 135,591 Mortgage Notes Payable 407,666 498,674 756,174 2,577 1,048,326 1,384 1,117,459 961,106 134,843 income Tax Payable 50,812 59,886 88,081 98,151 738,596 101,630 137,074 209,895 282,147 334,500 197,960 202,247 Totai Liabilities 733,374 728,712 1,051,728 1,285,109 1,619,617 1 765 356 3,576,329 4,159,912 3,685,071 3,349,183 7,703 3,940 8,011 0 Shareholders' Equity 385,252 525,756 616,334 745,145 9.12,583 1,129,509 1,476,628 1,919,987 2,763,571 3,415,926 3,527,234 3,237,653 1,118,626 1,254,468 1,668,062 2,030,254 2,532,200 2,895,365 3,787,391 4,905,578 6,343,840 7,583,541 7,220,316 6,586,836 FiNoa quot;CONFIDENTIALquot;
  • 4. TOLL BROTHERS, INC. HISTORICAL STATISTICS SUMMARY 1986-1997 ($ IN THOUSANDS) 1386 1987 1988 1989 1990 1991 1992 1993 1994 1995 1996 1997 NUMBER OF SELLING COMMUNITIES AT END OF YEAR 15 21 26 40 41 42 62 67 80 97 100 116 TOTAL # SALES AGREEMENTS SIGNED 832 756 656 704 612 863 1,202 1,595 1,716 1,846 2,398 2,701 TOTAL VALUE OF SALES AGREEMENTS SIGNED (OOOs) $133,369 $190,680 $162,504 $185,255 $163,975 $230,324 $342,811 $490,883 $586,941 $660,467 $884,677 $1,069,279 AVG PRICE PER HOME SOLD (OOOs) $160 $252 $248 $263 $268 $267 $285 $308 $342 $358 $369 $396 NUMBER OF HOMES IN BACKLOG - OCTOBER 31 378 460 338 366 251 438 621 892 1,025 1,078 1,367 1,551 VALUE OF HOMES IN BACKLOG - OCTOBER 31 (OOOs) $74,194 $130,288 $95,765 $104,156 $69,795 $124,148 $187,118 $285,441 $370,560 $400,820 $526,194 $627,220 AVG PRICE PER HOME IN BACKLOG (OOOs) $196 $283 $283 $285 $278 $283 $301 $320 $362 $372 $385 $404 # OF HOMES DELIVERED 802 674 778 676 727 676 1,019 1,324 1,583 1,825 2,109 2,517 TOTAL VALUE OF HOMES DELIVERED (OOOs) $124,641 $134,856 $197,027 $176,864 $198,336 $175,971 $279,841 $392,560 $501,822 $643,017 $759,303 $968,253 AVG DELIVERY PRICE (OOOs) $155 $200 $253 $262 $273 $260 $275 $296 $317 $352 $360 $385 AVG # OF COMMUNITIES DELIVERING 15 19 22 21 32 37 52 59 75 90 102 AVG DELIVERIES PER COMMUNITY 25.5 26.8 243 23.4 24.7 TAX RATE 50.0% 48.5% 41.0% 39.0% 37.1% 40.6% 39.8% 36.4% 37.1% 37.4% 37.5% 37.0% GROSS MARG. TRAD. HOME SALES BEF. WRITE-OFF 31.3% 39.7% 35.9% 34.8% 29.7% 26.1% 28.0% 26.6% 25.6% 25.4% 24.1% 22.9% GROSS MARG. TRAD. HOME SALES AFTER WRITE-OFF 31.3% 39.7% 35.0% 30.8% 25.2% 23.4% 27.2% 25.9% 24.2% 24.6% 23.5% 22.7% OPERATING MARGIN 17.4% 23.0% 19.1% 11.1% 6.7% 2.7% 9.7% 10.5% 10.9% 11.8% 11.1% 10.8% PRETAX MA.RGIN 19.0% 24.7% 20.7% 12.2% 8.5% 4.8% 9.8% 10.9% 11.3% 12.4% 11.3% 10.7% DEBT AS % OF TOTAL CAPITALIZATION 57.5% 63.7% 66.4% 65.9% 58.5% 47.2% 53.1% 54.4% 54.6% 52.2% 52.0% 56.9% DEBT Net of EXC CASH & Mkt Sec AS % OF TOTAL CAP. 54.6% 61.5% 63.6% 66.0% 58.5% 41.7% 46.0% 51.2% 51.1% 50.6% 51.0% 49.1% TOTAL DEBT($OOO) excluding Mtge Whse Loan $42,437 $85,894 $143,683 $165,189 $133,181 $105,456 $154,610 $199,221 $245,475 $280,283 $340,524 $509,503 TOTAL EQUITY($OOO) $31,405 $48,842 $72,787 $85,400 $94,599 $117,925 $136,412 $167,006 $204,176 $256,659 $314,677 $385,252 INTEREST COVERAGE 7.06 11.15 4.58 2.07 2.29 2.23 3.35 3.33 4.12 4.48 4.51 4.19 RATIO of Inventory to house revenues 0.53 1.07 1.05 1.45 1.21 1.27 1.03 1.03 1.01 0.97 1.02 0.95 INVENTORY GROWTH 116.2% 43.6% 24.4% •6.5% ERR 29.2% 39.8% 25.8% 23.2% - 23.8% 19.3% HOUSING REVENUE GROWTH 8.2% 46.1% -10.2% 12.1% ERR 59.0% 40.3% 27.8% 28.1% 18.1% 27.5% HOMESITES OWNED 1.461 2,147 4,724 5,075 4,548 3,974 5,633 5,744 OPTIONED 6,779 9,542 12,065 4,853 12,820 7,141 4,041 2,832 2,117 3,281 3,592 4,271 TOTAL ' - ' ^quot; 10,015 11,224 14,584 17,302 21,965 NUMBER OF SHARES OUTSTANDING (OOOs) 119,972 120,268 120,168 119,652 131,248 132,348 118,736 134,552 133,276 133,692 135,674 137,102 BOOK VALUE PER SHARE $0.26 $0.41 $0.61 $0.71 $0.80 $0.90 $1.03 $1.25 $1.53 $1.91 $2.32 $2.81 RETURN ON BEGINNING SHAREHOLDERS EQUITY 122.5% 54.7% 49.3% 18.0% 11.7% 5.3% 14.0% 19.6% 21.7% 24.5% 20.9% 20.7% |:: (a) Based upon gross backlog prior to reduction of percentage of completion revenues recognized appilcabie to units in backlog of $170.1 million at 10/31/06. FIN09 quot;CONFIDENTIAf
  • 5. TOLL BROTHERS, INC. HISTORICAL STATEMENT OF OPERATIONS 1986-1997 (S IN THOUSANDS) 1986 1987 1988 1989 1990 1991 1992 1993 1994 1995 1996 $ % 1997 $ % $ % % $ $ % $ % % $ $ % $ % % REVENUES $ % % i Completed contract $124,641 $134,856 $197,027 $176,864 $198,336 $175,971 $279,841 $392,560 $501,822 $643,017 Percentage of completion $759,303 $968,253 Land sales Total Revenues 175,971 1 279,841 501,822 100.00% 643,017 100.00% 759,303 100.00% 968,253 100.00% COST OF REVENUES Completed contract before Impairments 85,595 68.67% 81,325 60.31% 126,367 115,266 64.14% 65.17% 139,389 70.28% 73.94% 72.04% 288,124 73.40% 130,113 Percentage of completion 201,600 479,643 373,283 74.39% 74.59% 575,983 75.86% 746,275 77.07% Land sales Writeoffs of predevei. & impairments 1,769 0.90% 7,196 4.07% 8,987 4.53% 4,721 2.68% 1,988 0.71% 2,754 0.70% 6,957 1.39% 5,366 0.83% Recovery of prior writedowns 5,007 0.66% 2,048 0.21% Interest 4,235 3.40% 3,505 2.60% 5,440 2.76% 6,699 3.79% 9,356 4.72% 9,920 5.64% 16,047 5.73% 17,129 4.36% 18,196 3.63% 22,207 3.45% 24,189 3.19% 29,390 3.04% Total Expenses ^'19.635 398,436 79.40% 507,216 78.88% 605,179 79.70% 777,713 80.32% Selling Expenses 3,382 2.71% 3,585 2.66% 5,765 2.93% 7,299 4.13% 9,274 4.68% 9,477 5.39% 10,913 3.90% 14,746 3.76% 17,856 3.56% General & Administrative 23,992 3.73% 28,847 3.80% 9,727 7.80% 34,778 3.59% 15,431 11.44% 20,023 10.16% 20,703 11.71% 18,061 9.11% 16,939 9.63% 22,060 7.88% 28,580 7.28% 30,932 Total SG&A 6.16% 35,692 5.55% 40,888 13,109 5.38% 10.52% 51,523 19,016 5.32% 14.10% 25,788 13.09% 15.83% 28,002 27 335 13 78% Goodwill write-off 48,788 9.72% 59,684 9.28% 69,735 9.18% 86,301 8.91% Income (loss) from operations 21,702 17.41% 31,010 22.99% 37,663 19.12% 19,701 11.14% 13,269 6.69% 4,801 2.73% 27,233 9.73% 41,227 10.50% 54,598 76,117 10.88% 84,389 11.84% 11.11% 104,239 10.77% Other income (loss) 2,016 2,336 3,140 1,819 1,695 1,447 1,630 2,701 2,242 3,322 (Gain) loss from early retirement of debt 1,404 3,407 1,837 2,196 (1,371) (1,108) (4,431) PRETAX iNCOiVIE (LOSS) 8^444 27,492 56,840 11.33% 79,439 12.35% 85,793 11.30% 103,215 10.66% TAX PROVISION (BENEFIT) 11,857 16,173 16,729 8,393 6,813 16,069 3,431 10,955 20,663 32,049 29,507 38,139 NET INCOME (LOSS)* 36,177 7.21% 49,932 7.77% 53,744 7.08% 65,076 6.72% 1 BASIC EARNINGS (LOSS) PER SHARE* $0.11 $0.14 $0.20 $0.11 $0.08 $0.04 $0.13 $0.20 $0.27 DILUTED EARNINGS (LOSS) PER SHARE* $0.37 $0.40 $0.11 $0.48 $0.14 $0.20 $0.11 $0.08 $0.04 $0.12 $0.20 $0.25 $0.34 $0.36 $0.44 * Before Change in Accounting FIN09 quot;CONFIDENTIALquot;
  • 6. TOLL BROTHERS, INC. HISTORICAL BALANCE SHEET 1986-1997 ($ IN THOUSANDS) 1986 1387 1988 1989 1990 1991 1992 1993 1994 % $ 1995 $ 1996 $ % $ 1997 $ $ % $ % ASSETS $ $ $ $ $ % Cash $14,720 13.6% $18,009 9.9% $26,583 $9,160 10.4% 2.6% $9,854 3.1% $31,266 10.0% $48,627 12.6% Marketable Securities $34,071 7.2% $41,700 7.1% $27,772 4.0% $22,891 2.7% $147,575 13.2% Inventories 66,543 61.5% 143,894 79.2% 206,593 80.5% 256,934 73.8% 240,155 75.9% 222,775 71.3% 287,844 74.8% Property, Etc. 402,515 84.6% 3,306 506,347 3.1% 86.3% 623,830 90.1% 5,836 3.2% 772,471 10,990 4.3% 92.2% 11,699 3.4% 921,595 82.4% 10,504 3.3% 10,362 3.3% 10,087 2.6% Receivables, Prepalds & Other 10,296 2.2% 6,995 11,537 6.5% 2.0% 11,898 1.7% 14,026 7.7% 12,948 12,445 4.8% 17,996 1.5% 5.2% 15,074 1.3% 10,167 3.2% 8,495 2.7% 15,193 3.9% Contracts Receivable 15,603 3.3% 20,578 3.5% 21,198 3.1% 22,029 2.6% 2.0% 21,832 Mortgage Notes Receivable 16,621 15.4% 52,374 15.0% 45,854 14.5% 39,526 12.7% 23,085 Customer Deposits Held in Escrow 6.0% 9,902 2.1% 4,614 0.8% 3,940 0.6% 2,833 0.3% 2,589 0.0% 0.2% 0.0% investments in unconsoiidated entities 3,611 0.8% 2,117 0.4% 3,819 0.6% 4,754 0.6% 9,961 0.9% Deferred tax assets 108,185 100.0% 181,765 100.0% 256,611 100.0% 348,163 100.0% 316,534 100.0% 312,424 100.0% 384,836 100.0% 475,998 100.0% 586,893 100.0% 692,457 100.0% 837,926 100.0% 1,118,626 100.0% LiABILITIES a EQUITY Bank Loans $62,626 $87,527 $66,500 $47,300 Senior Debt $22,300 $21,293 $10,000 $52,000 $118,000 $168,000 Subordinated Debt $29,963 $29,967 69,635 69,681 61,474 55,513 Mortgage Company Warehouse Line 128,854 174,442 227,969 221,226 208,415 319,924 Other Loans 12,474 55,927 11,422 7,981 5,207 2,643 Customer Deposits 3,456 3,486 6,802 7,506 12,685 7,057 14,109 21,579 8,480 9,019 10,241 Accts Payable & Accrued Expenses 6,009 15,130 22,449 11,405 30,071 22,883 36,194 24,177 43,387 24,080 22,163 52,698 Mortgage Notes Payable 20,847 32,793 47,192 5,969 69,786 78,411 100,634 52,617 123,837 39,864 Income Tax Payable 45,988 24,403 10,810 10,167 4,686 11,461 3,912 7,484 2,816 11,858 16,775 2,577 15,910 21,488 29,320 32,699 36,998 35,888 44,759 Total Liabilities 76,780 132,923 183,824 262,763 221,935 194,499 248,424 308,992 382,717 435,798 523,249 733,374 Shareholders' Equity 31,405 48,842 72,787 85,400 94,599 117,925 136,412 167,006 204,176 256,659 314,677 385,252 108,185 181,765 256,611 348,163 316,534 312,424 384,836 475,998 586,893 692,457 837,926 1,118,626 FIN09 quot;CONFIDENTIALquot;