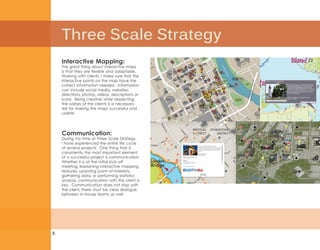
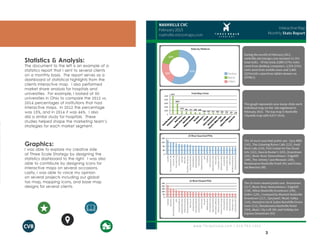
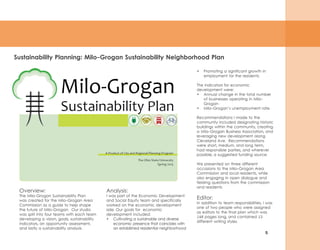
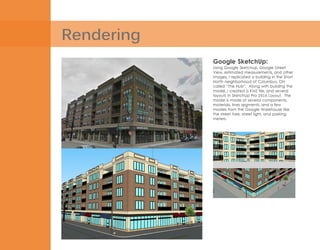
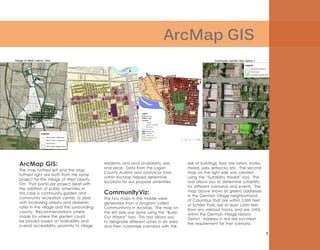
Acknowledgement
I would like to thank the faculty at the Knowlton School
of Architecture’s Master of City and Regional Planning
Program and my fellow classmates and friends for both
the knowledge they imparted on me and their support and
encouragement throughout these last two years. Thank you.
1
Three Scale Strategy
Studio Work
Rendering
ArcMap GIS
Creating Places
Urban Design & Site Planning
2-3
4-5
6
7
8-9
10-11
Table of Contents:
Three Scale Strategy
2
Communication:
During my time at Three Scale Strategy
I have experienced the entire life cycle
of several projects. One thing that is
consistently the most important element
of a successful project is communication.
Whether it is at the initial kick-off
meeting, explaining interactive mapping
features, updating point-of-interests,
gathering data, or performing statistics
analysis, communication with the client is
key. Communication does not stop with
the client, there must be clear dialogue
between in-house teams as well.
Interactive Mapping:
The great thing about interactive maps
is that they are flexible and adaptable.
Working with clients, I make sure that the
interactive points on the map have the
correct information needed. Information
can include social media, websites,
directions, photos, videos, descriptions or
icons. Being creative while respecting
the wishes of the clients is a necessary
skill for making the maps successful and
usable.
3
Statistics & Analysis:
The document to the left is an example of a
statistics report that I sent to several clients
on a monthly basis. The report serves as a
dashboard of statistical highlights from the
clients interactive map. I also performed
market share analysis for hospitals and
universities. For example, I looked at 50
universities in Ohio to compare the 2012 vs.
2014 percentages of institutions that had
interactive maps. In 2012 the percentage
was 15%, and in 2014 it was 44%. I also
did a similar study for hospitals. These
studies helped shape the marketing team’s
strategies for each market segment.
Graphics:
I was able to explore my creative side
at Three Scale Strategy by designing the
statistics dashboard to the right. I was also
able to contribute by designing icons for
interactive maps on several occasions.
Lastly, I was able to voice my opinion
on several projects including our global
tax map, mapping icons, and base map
designs for several clients.
Studio Work
4
Overview:
I was involved in the creation of a
comprehensive hazard mitigation plan
for Fayette County in southwest Ohio.
Hazard mitigation plans are important
because the federal government
mandates that every county must have
a current mitigation plan in order to be
eligible for federal disaster relief funding,
should there be a disaster in that county.
Fayette County’s plan had been expired
for two years when we started working
on the updated version. My focus area
in this plan was dealing with several
individual natural hazards including,
tornadoes, earthquakes, and karst
topography.
Once completed, the plan was sent
to the Ohio Emergency Management
Agency for approval. Upon their
approval, the plan is then forwarded
to FEMA for final approval. FEMA
approved the plan in March of 2015.
Each municipality, as well as the overall
county, will then formally adopt the plan.
This will cover the county until 2019.
Public Involvement:
An integral part of building the plan
was working with the Emergency
Management Agency at both the
Comprehensive Planning: Countywide Hazard Mitigation Plan
county and state levels. It was
also important to get the public’s
perspective on this updated plan.
We held two public meetings at the
county where we communicated
and collaborated with public officials
that included: county commissioners,
mayors, township supervisors, the county
engineer and the county sheriff.
With their help, we came up with a
prioritized list of specific mitigation
actions designed to reduce property
damage and loss of life for each
identified hazard. The mitigation actions
had to include responsible agencies, start
& end dates, current status, and funding
sources.
Assessment & Analysis:
Processes used to complete the analysis
included thorough review of FEMA
guidelines, historical research of events
in Fayette County, community outreach,
studying existing plans, and GIS utilization,
specifically with a program called HAZUS
that allowed us to estimate human,
structural, and economic impacts.
5
Sustainability Planning: Milo-Grogan Sustainability Neighborhood Plan
Overview:
The Milo-Grogan Sustainability Plan
was created for the Milo-Grogan Area
Commission as a guide to help shape
the future of Milo-Grogan. Our studio
was split into four teams with each team
developing a vision, goals, sustainability
indicators, an opportunity assessment,
and lastly a sustainability analysis.
•	 Promoting a significant growth in
employment for the residents.
The indicators for economic
development were:
•	 Annual change in the total number
of businesses operating in Milo-
Grogan
•	 Milo-Grogan’s unemployment rate.
Recommendations I made to the
community included designating historic
buildings within the community, creating
a Milo-Grogan Business Association, and
leveraging new development along
Cleveland Ave. Recommendations
were short, medium, and long term,
had responsible parties, and wherever
possible, a suggested funding source.
We presented on three different
occasions to the Milo-Grogan Area
Commission and local residents, while
also engaging in open dialogue and
fielding questions from the commission
and residents.
Editor:
In addition to team responsibilities, I was
one of two people who were assigned
as editors to the final plan which was
146 pages long, and contained 13
different writing styles.
Analysis:
I was part of the Economic Development
and Social Equity team and specifically
worked on the economic development
side. Our goals for economic
development included:
•	 Cultivating a sustainable and diverse
economic presence that coincides with
an established residential neighborhood
Rendering
Google SketchUp:
Using Google Sketchup, Google Street
View, estimated measurements, and other
images, I replicated a building in the Short
North neighborhood of Columbus, OH
called “The Hub”. Along with building the
model, I created a KMZ file, and several
layouts in SketchUp Pro 2014 Layout. The
model is made of several components,
materials, lines segments, and a few
models from the Google Warehouse like
the street tree, street light, and parking
meters.
7
ArcMap GIS
ArcMap GIS:
The map furthest left and the map
furthest right are both from the same
project for the Village of West Liberty,
OH. That particular project dealt with
the addition of public amenities, in
this case a community garden and
community recreation center, to deal
with increasing obesity and diabetes
rates in the village and the surrounding
county. Recommendations where
made for where the garden could
be placed based on walkability and
overall accessibility, proximity to village
residents, and land availability, size,
and price. Data from the Logan
County Auditor and analytical tools
within ArcMap helped determine
locations for our propose amenities.
CommunityViz:
The two maps in the middle were
generated from a program called
CommunityViz in ArcMap. The map on
the left side was done using the “Build-
Out Wizard” tool. This tool allows you
to designate different zones in an area
and then customize scenarios with the
size of buildings, floor are ration, stories,
mixed, uses, setbacks, etc. The second
map on the right side was created
using the “Suitability Wizard” tool. This
tool allows you to determine suitability
for different scenarios and events. The
map above shows (in green) addresses
in the German Village neighborhood
of Columbus that are within 2,500 feet
of Schiller Park, are at least 1,000 feet
from any railroad tracks, and are 100%
within the German Village Historic
District. Address in red did not meet
the requirement for that scenario.
Grandview Yard Site Plan
8
Grandview Yard
Development Site
Planning:
Grandview Yard is a 114 acre, formerly
industrial, site in Grandview Heights,
OH. The planned redevelopment is to
occur in three phases:
• Phase I – develop 10 acres to
accommodate 50,000 square feet of
retail space and appropriate parking.
• Phase II – develop 60 acres of into
at least 140 single family homes.
• Phase III – complete development
of the site as a Planned United
Development (PUD) that would include
buildings for office space, single family
homes, multifamily homes as well as
planned green space.
To complete this project I choose to
follow the Smart Code Version 9.2
for design standards of the entire
development. These design standards
enable a dense, mixed-use, and
walkable neighborhood. The code
guides decisions on everything from
lane and sidewalk widths, to on-street
parking, lot setbacks, lot coverage
percentages, building sizes, and green
space needs. One key design element
was to incorporate the single family
housing section of the development
into the existing neighborhood that
borders this site to the west. I also
wanted a centralized designated
green space placed in the center of
the site. Mixed used buildings with
office and retail on ground level floors
were placed along the main north/
south street that would bisect the site.
These buildings were generally 4-6
stories tall with residential units on the
upper floors. Parking structures were
generally limited behind mixed used
buildings so they would not be viewed
from the main street. I also wanted to
place as much open space along the
adjoining railroad tracks to the east
of the site as I possible could. These
9
open spaces would be more natural in use
and not necessarily as productive or gathering
type spaces. All streets would have two lanes
of on-street parking, decorative lighting, street
trees, and tree lawns. Because of the density
of the single family homes, garages are in the
back of the properties and can be accessed
through alleyways. This frees up space for
more on-street parking and also improves the
aesthetics of the those streets.
Creating Places
10
The Story of a Space:
This image was created as collage of 18 original photos, intended to be 18” x 24”, to tell the story of an urban public
space through a series of photos. The space that I chose to document is Jackson Square, located in the French Quarter
of New Orleans, LA. I wanted to showcase the variety of people and activities occurring simultaneously in one space.
11
Mardi Gras Poster:
The poster above was created in Photoshop as an 18”
x 24” advertisement for Mardi Gras in New Orleans, LA.
Made for people to be able to view and quickly absorb
the message, the poster is meant to be seen by people
from medium distances. The simple graphics and layout
relay the message of the poster quickly and effectively.
While in the background numerous layering and opacity
levels of different images give the poster a hazy surreal
feeling.
Imaginary Streetscape: Using six different Images I created this
imaginary streetscape in Photoshop. Knowledge of Photoshop’s image adjustment
tools and transformation tools allowed me to manipulate the skew, perspective, and
scale of the photos needed to make the perspective in this streetscape work.
3-D Elevation:
The original image on the left looks flat and one dimensional. By using various
elements in Photoshop to create different types of shadows, textures, colors, and by
manipulating their depth and perspective, the image on the right appears three
dimensional.
Timothy_Dietrich_Portfolio_HiResMax

Timothy_Dietrich_Portfolio_HiResMax

  • 2.
    Acknowledgement I would liketo thank the faculty at the Knowlton School of Architecture’s Master of City and Regional Planning Program and my fellow classmates and friends for both the knowledge they imparted on me and their support and encouragement throughout these last two years. Thank you.
  • 3.
    1 Three Scale Strategy StudioWork Rendering ArcMap GIS Creating Places Urban Design & Site Planning 2-3 4-5 6 7 8-9 10-11 Table of Contents:
  • 4.
    Three Scale Strategy 2 Communication: Duringmy time at Three Scale Strategy I have experienced the entire life cycle of several projects. One thing that is consistently the most important element of a successful project is communication. Whether it is at the initial kick-off meeting, explaining interactive mapping features, updating point-of-interests, gathering data, or performing statistics analysis, communication with the client is key. Communication does not stop with the client, there must be clear dialogue between in-house teams as well. Interactive Mapping: The great thing about interactive maps is that they are flexible and adaptable. Working with clients, I make sure that the interactive points on the map have the correct information needed. Information can include social media, websites, directions, photos, videos, descriptions or icons. Being creative while respecting the wishes of the clients is a necessary skill for making the maps successful and usable.
  • 5.
    3 Statistics & Analysis: Thedocument to the left is an example of a statistics report that I sent to several clients on a monthly basis. The report serves as a dashboard of statistical highlights from the clients interactive map. I also performed market share analysis for hospitals and universities. For example, I looked at 50 universities in Ohio to compare the 2012 vs. 2014 percentages of institutions that had interactive maps. In 2012 the percentage was 15%, and in 2014 it was 44%. I also did a similar study for hospitals. These studies helped shape the marketing team’s strategies for each market segment. Graphics: I was able to explore my creative side at Three Scale Strategy by designing the statistics dashboard to the right. I was also able to contribute by designing icons for interactive maps on several occasions. Lastly, I was able to voice my opinion on several projects including our global tax map, mapping icons, and base map designs for several clients.
  • 6.
    Studio Work 4 Overview: I wasinvolved in the creation of a comprehensive hazard mitigation plan for Fayette County in southwest Ohio. Hazard mitigation plans are important because the federal government mandates that every county must have a current mitigation plan in order to be eligible for federal disaster relief funding, should there be a disaster in that county. Fayette County’s plan had been expired for two years when we started working on the updated version. My focus area in this plan was dealing with several individual natural hazards including, tornadoes, earthquakes, and karst topography. Once completed, the plan was sent to the Ohio Emergency Management Agency for approval. Upon their approval, the plan is then forwarded to FEMA for final approval. FEMA approved the plan in March of 2015. Each municipality, as well as the overall county, will then formally adopt the plan. This will cover the county until 2019. Public Involvement: An integral part of building the plan was working with the Emergency Management Agency at both the Comprehensive Planning: Countywide Hazard Mitigation Plan county and state levels. It was also important to get the public’s perspective on this updated plan. We held two public meetings at the county where we communicated and collaborated with public officials that included: county commissioners, mayors, township supervisors, the county engineer and the county sheriff. With their help, we came up with a prioritized list of specific mitigation actions designed to reduce property damage and loss of life for each identified hazard. The mitigation actions had to include responsible agencies, start & end dates, current status, and funding sources. Assessment & Analysis: Processes used to complete the analysis included thorough review of FEMA guidelines, historical research of events in Fayette County, community outreach, studying existing plans, and GIS utilization, specifically with a program called HAZUS that allowed us to estimate human, structural, and economic impacts.
  • 7.
    5 Sustainability Planning: Milo-GroganSustainability Neighborhood Plan Overview: The Milo-Grogan Sustainability Plan was created for the Milo-Grogan Area Commission as a guide to help shape the future of Milo-Grogan. Our studio was split into four teams with each team developing a vision, goals, sustainability indicators, an opportunity assessment, and lastly a sustainability analysis. • Promoting a significant growth in employment for the residents. The indicators for economic development were: • Annual change in the total number of businesses operating in Milo- Grogan • Milo-Grogan’s unemployment rate. Recommendations I made to the community included designating historic buildings within the community, creating a Milo-Grogan Business Association, and leveraging new development along Cleveland Ave. Recommendations were short, medium, and long term, had responsible parties, and wherever possible, a suggested funding source. We presented on three different occasions to the Milo-Grogan Area Commission and local residents, while also engaging in open dialogue and fielding questions from the commission and residents. Editor: In addition to team responsibilities, I was one of two people who were assigned as editors to the final plan which was 146 pages long, and contained 13 different writing styles. Analysis: I was part of the Economic Development and Social Equity team and specifically worked on the economic development side. Our goals for economic development included: • Cultivating a sustainable and diverse economic presence that coincides with an established residential neighborhood
  • 8.
    Rendering Google SketchUp: Using GoogleSketchup, Google Street View, estimated measurements, and other images, I replicated a building in the Short North neighborhood of Columbus, OH called “The Hub”. Along with building the model, I created a KMZ file, and several layouts in SketchUp Pro 2014 Layout. The model is made of several components, materials, lines segments, and a few models from the Google Warehouse like the street tree, street light, and parking meters.
  • 9.
    7 ArcMap GIS ArcMap GIS: Themap furthest left and the map furthest right are both from the same project for the Village of West Liberty, OH. That particular project dealt with the addition of public amenities, in this case a community garden and community recreation center, to deal with increasing obesity and diabetes rates in the village and the surrounding county. Recommendations where made for where the garden could be placed based on walkability and overall accessibility, proximity to village residents, and land availability, size, and price. Data from the Logan County Auditor and analytical tools within ArcMap helped determine locations for our propose amenities. CommunityViz: The two maps in the middle were generated from a program called CommunityViz in ArcMap. The map on the left side was done using the “Build- Out Wizard” tool. This tool allows you to designate different zones in an area and then customize scenarios with the size of buildings, floor are ration, stories, mixed, uses, setbacks, etc. The second map on the right side was created using the “Suitability Wizard” tool. This tool allows you to determine suitability for different scenarios and events. The map above shows (in green) addresses in the German Village neighborhood of Columbus that are within 2,500 feet of Schiller Park, are at least 1,000 feet from any railroad tracks, and are 100% within the German Village Historic District. Address in red did not meet the requirement for that scenario.
  • 10.
    Grandview Yard SitePlan 8 Grandview Yard Development Site Planning: Grandview Yard is a 114 acre, formerly industrial, site in Grandview Heights, OH. The planned redevelopment is to occur in three phases: • Phase I – develop 10 acres to accommodate 50,000 square feet of retail space and appropriate parking. • Phase II – develop 60 acres of into at least 140 single family homes. • Phase III – complete development of the site as a Planned United Development (PUD) that would include buildings for office space, single family homes, multifamily homes as well as planned green space. To complete this project I choose to follow the Smart Code Version 9.2 for design standards of the entire development. These design standards enable a dense, mixed-use, and walkable neighborhood. The code guides decisions on everything from lane and sidewalk widths, to on-street parking, lot setbacks, lot coverage percentages, building sizes, and green space needs. One key design element was to incorporate the single family housing section of the development into the existing neighborhood that borders this site to the west. I also wanted a centralized designated green space placed in the center of the site. Mixed used buildings with office and retail on ground level floors were placed along the main north/ south street that would bisect the site. These buildings were generally 4-6 stories tall with residential units on the upper floors. Parking structures were generally limited behind mixed used buildings so they would not be viewed from the main street. I also wanted to place as much open space along the adjoining railroad tracks to the east of the site as I possible could. These
  • 11.
    9 open spaces wouldbe more natural in use and not necessarily as productive or gathering type spaces. All streets would have two lanes of on-street parking, decorative lighting, street trees, and tree lawns. Because of the density of the single family homes, garages are in the back of the properties and can be accessed through alleyways. This frees up space for more on-street parking and also improves the aesthetics of the those streets.
  • 12.
    Creating Places 10 The Storyof a Space: This image was created as collage of 18 original photos, intended to be 18” x 24”, to tell the story of an urban public space through a series of photos. The space that I chose to document is Jackson Square, located in the French Quarter of New Orleans, LA. I wanted to showcase the variety of people and activities occurring simultaneously in one space.
  • 13.
    11 Mardi Gras Poster: Theposter above was created in Photoshop as an 18” x 24” advertisement for Mardi Gras in New Orleans, LA. Made for people to be able to view and quickly absorb the message, the poster is meant to be seen by people from medium distances. The simple graphics and layout relay the message of the poster quickly and effectively. While in the background numerous layering and opacity levels of different images give the poster a hazy surreal feeling. Imaginary Streetscape: Using six different Images I created this imaginary streetscape in Photoshop. Knowledge of Photoshop’s image adjustment tools and transformation tools allowed me to manipulate the skew, perspective, and scale of the photos needed to make the perspective in this streetscape work. 3-D Elevation: The original image on the left looks flat and one dimensional. By using various elements in Photoshop to create different types of shadows, textures, colors, and by manipulating their depth and perspective, the image on the right appears three dimensional.