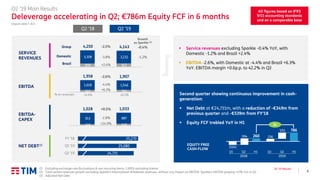
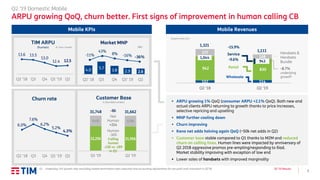
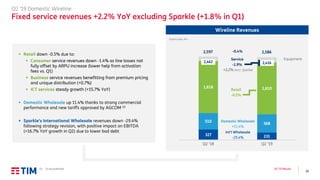
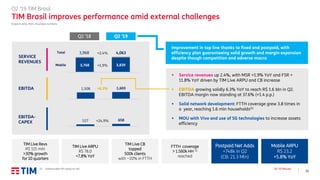
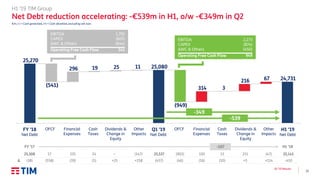
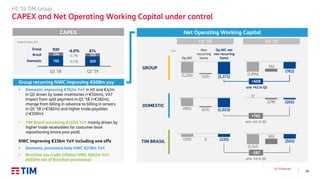
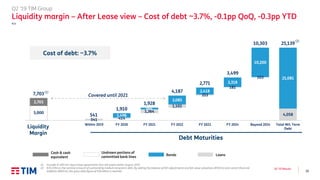
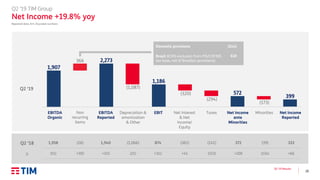
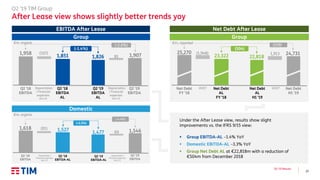
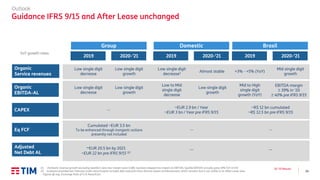
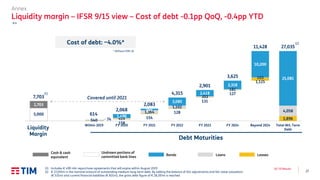
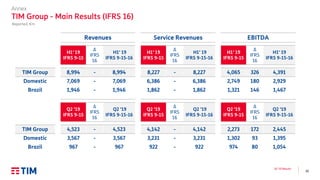
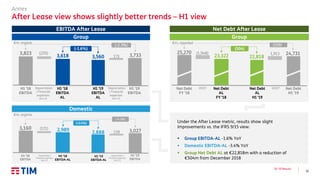
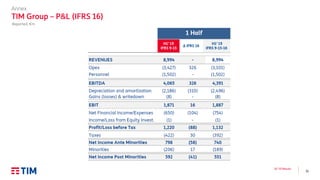
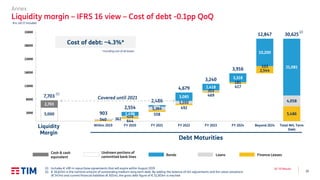
In Q2 2019:
- Net debt was reduced by €349M from the previous quarter to €24.7B total, through strong cash generation.
- Equity free cash flow trebled year-over-year in the first half of 2019 to €786M.
- EBITDA declined 2.6% year-over-year due to a 4.4% drop in the Domestic segment, but grew 6.3% in Brazil.
- Mobile revenues declined 8.7% year-over-year due to lower handset sales, while fixed service revenues grew 2.2% excluding Sparkle.
I risultati di TIM per il primo trimestre 2020, illustrati in webcast e conference call il 19 maggio 2020.
TIM 2020 First Quarter Results, presented on May 19, 2020, via webcast and conference call.
I risultati di TIM per il primo trimestre 2020, illustrati in webcast e conference call il 19 maggio 2020.
TIM 2020 First Quarter Results, presented on May 19, 2020, via webcast and conference call.
RISULTATI PRIMO TRIMESTRE 2018
RICAVI1 TOTALI A € 69,5 MILIONI -1,1% SU BASE ANNUA, CRESCONO DEL +6% I RICAVI DIGITALI
EBITDA A € 12,7 MILIONI VS €10,4 MILIONI NEL Q1 2017, AL NETTO DEGLI EFFETTI IFRS 162 EBITDA Q1 2018 PARI A € 10,5 MILIONI (+0,7%)
UTILE NETTO A € 3,9 MILIONI VS €1,6 MILIONI NEL Q1 2017
DISPONIBILITA’ LIQUIDE PARI A € 92 MILIONI, +23% RISPETTO AL 31 DICEMBRE 2017
ITALIAONLINE SI CONFERMA LA PRIMA INTERNET COMPANY ITALIANA CON DATI DI AUDIENCE GIORNALIERA IN CRESCITA DEL +14% SU BASE ANNUA
Solvay 9 months 2018 results - PresentationSolvay Group
Solvay published on November 8, 2018 its first nine months 2018 results. Earnings toolkit and press release are available here: https://www.solvay.com/en/event/nine-months-2018-earnings
TIM GROUP FY '23 Preliminary Results.pdfGruppo TIM
On February 15, 2024, TIM management has presented in conference call its FY 2023 preliminary results approved by the Board of Directors.
Il 15 febbraio 2024 il management di TIM ha presentato in conference call i risultati preliminari del FY 2023 approvati dal Consiglio di Amministrazione.
Il 9 novembre 2023 il management di TIM ha presentato in conference call i risultati del Q3 2023 approvati dal Consiglio di Amministrazione.
On November 9, 2023, TIM management has presented in conference call its Q3 2023 results approved by the Board of Directors.
I risultati di TIM per il primo trimestre 2022, illustrati in webcast e conference call il 5 maggio 2022.
TIM 2022 First Quarter Results, presented on May 5, 2022, via webcast and conference call.
2. Elemental Economics - Mineral demand.pdfNeal Brewster
After this second you should be able to: Explain the main determinants of demand for any mineral product, and their relative importance; recognise and explain how demand for any product is likely to change with economic activity; recognise and explain the roles of technology and relative prices in influencing demand; be able to explain the differences between the rates of growth of demand for different products.
Yes of course, you can easily start mining pi network coin today and sell to legit pi vendors in the United States.
Here the telegram contact of my personal vendor.
@Pi_vendor_247
#pi network #pi coins #legit #passive income
#US
How to get verified on Coinbase Account?_.docxBuy bitget
t's important to note that buying verified Coinbase accounts is not recommended and may violate Coinbase's terms of service. Instead of searching to "buy verified Coinbase accounts," follow the proper steps to verify your own account to ensure compliance and security.
5 Tips for Creating Standard Financial ReportsEasyReports
Well-crafted financial reports serve as vital tools for decision-making and transparency within an organization. By following the undermentioned tips, you can create standardized financial reports that effectively communicate your company's financial health and performance to stakeholders.
The secret way to sell pi coins effortlessly.DOT TECH
Well as we all know pi isn't launched yet. But you can still sell your pi coins effortlessly because some whales in China are interested in holding massive pi coins. And they are willing to pay good money for it. If you are interested in selling I will leave a contact for you. Just telegram this number below. I sold about 3000 pi coins to him and he paid me immediately.
Telegram: @Pi_vendor_247
Financial Assets: Debit vs Equity Securities.pptxWrito-Finance
financial assets represent claim for future benefit or cash. Financial assets are formed by establishing contracts between participants. These financial assets are used for collection of huge amounts of money for business purposes.
Two major Types: Debt Securities and Equity Securities.
Debt Securities are Also known as fixed-income securities or instruments. The type of assets is formed by establishing contracts between investor and issuer of the asset.
• The first type of Debit securities is BONDS. Bonds are issued by corporations and government (both local and national government).
• The second important type of Debit security is NOTES. Apart from similarities associated with notes and bonds, notes have shorter term maturity.
• The 3rd important type of Debit security is TRESURY BILLS. These securities have short-term ranging from three months, six months, and one year. Issuer of such securities are governments.
• Above discussed debit securities are mostly issued by governments and corporations. CERTIFICATE OF DEPOSITS CDs are issued by Banks and Financial Institutions. Risk factor associated with CDs gets reduced when issued by reputable institutions or Banks.
Following are the risk attached with debt securities: Credit risk, interest rate risk and currency risk
There are no fixed maturity dates in such securities, and asset’s value is determined by company’s performance. There are two major types of equity securities: common stock and preferred stock.
Common Stock: These are simple equity securities and bear no complexities which the preferred stock bears. Holders of such securities or instrument have the voting rights when it comes to select the company’s board of director or the business decisions to be made.
Preferred Stock: Preferred stocks are sometime referred to as hybrid securities, because it contains elements of both debit security and equity security. Preferred stock confers ownership rights to security holder that is why it is equity instrument
<a href="https://www.writofinance.com/equity-securities-features-types-risk/" >Equity securities </a> as a whole is used for capital funding for companies. Companies have multiple expenses to cover. Potential growth of company is required in competitive market. So, these securities are used for capital generation, and then uses it for company’s growth.
Concluding remarks
Both are employed in business. Businesses are often established through debit securities, then what is the need for equity securities. Companies have to cover multiple expenses and expansion of business. They can also use equity instruments for repayment of debits. So, there are multiple uses for securities. As an investor, you need tools for analysis. Investment decisions are made by carefully analyzing the market. For better analysis of the stock market, investors often employ financial analysis of companies.
where can I find a legit pi merchant onlineDOT TECH
Yes. This is very easy what you need is a recommendation from someone who has successfully traded pi coins before with a merchant.
Who is a pi merchant?
A pi merchant is someone who buys pi network coins and resell them to Investors looking forward to hold thousands of pi coins before the open mainnet.
I will leave the telegram contact of my personal pi merchant to trade with
@Pi_vendor_247
how to sell pi coins in South Korea profitably.DOT TECH
Yes. You can sell your pi network coins in South Korea or any other country, by finding a verified pi merchant
What is a verified pi merchant?
Since pi network is not launched yet on any exchange, the only way you can sell pi coins is by selling to a verified pi merchant, and this is because pi network is not launched yet on any exchange and no pre-sale or ico offerings Is done on pi.
Since there is no pre-sale, the only way exchanges can get pi is by buying from miners. So a pi merchant facilitates these transactions by acting as a bridge for both transactions.
How can i find a pi vendor/merchant?
Well for those who haven't traded with a pi merchant or who don't already have one. I will leave the telegram id of my personal pi merchant who i trade pi with.
Tele gram: @Pi_vendor_247
#pi #sell #nigeria #pinetwork #picoins #sellpi #Nigerian #tradepi #pinetworkcoins #sellmypi
This presentation poster infographic delves into the multifaceted impacts of globalization through the lens of Nike, a prominent global brand. It explores how globalization has reshaped Nike's supply chain, marketing strategies, and cultural influence worldwide, examining both the benefits and challenges associated with its global expansion.
PPrreesseenntteedd bbyy:: GGrroouupp 66
GGlloobbaalliizzaattiioonn
o f
PP
oo
ll
yy
ee
ss
tt
ee
rr
RR
uu
bb
bb
ee
rr
EE
tt
hh
yy
ll
ee
nn
ee
VV
ii
nn
yy
ll
AA
cc
ee
tt
aa
tt
ee
GG
ee
nn
uu
ii
nn
ee
LL
ee
aa
tt
hh
ee
rr
SS
yy
nn
tt
hh
ee
tt
ii
cc
LL
ee
aa
tt
hh
ee
rr
CC
oo
tt
tt
oo
nn
C
o
u
n
t
r
i
e
s
I
n
v
o
l
v
e
d
Ni
k
e
h
a
s
m
o
r
e
t
h
a
n
7
0
0
s
h
o
p
s
i
n
c
o
n
t
r
a
c
t
w
i
t
h
w
o
r
l
d
w
i
d
e,
w
h
e
r
e
i
n
t
h
e
i
r
offi
c
e
s
a
n
d
i
n
d
e
p
e
n
d
e
n
t
fa
c
t
o
r
y
o
u
t
l
e
t
s
a
r
e
fo
u
n
d
w
i
t
h
i
n
t
h
e
p
r
e
m
i
s
e
s
of
ap
p
r
o
x
i
m
a
t
e
l
y
4
5
c
o
u
n
t
r
i
e
s.
AAuussttrraalliiaa
China
India
IInnddoonneessiiaa
TThhaaiillaanndd
TTuurrkkeeyy
USA
VViieettnnaamm
NNiikkee SSuuppppllyy CChhaaiinn
RRuubbbbeerr,, FFaabbrriicc
aanndd ootthheerr rraaww
mmaatteerriiaallss
Shoe
MMaannuuffaaccttuurriinngg
aanndd AAsssseemmbbllyy
MMaarrkkeettiinngg
SSppoorrttiinngg ggooooddss,,
ddeevveellooppmmeenntt
aanndd SShhooee ssttoorreess
OOnnlliinnee,, CCaattaalloogg
aanndd ootthheerr rreettaaiill
NNiikkee bbrraannddeedd
shoes
PPrroodduucctt
ddeevveellooppmmeenntt
CCuussttoommeerr nneeeeddss//wwaannttss ffeeeeddbbaacckk
NNiikk
Nike Supply Chain
Globalization of Nike
Nike Manufacturing Process
Rubber Materials Nike
Ethylene Vinyl Acetate Nike
Genuine Leather Nike
Synthetic Leather Nike
Cotton in Nike Apparel
Nike Shops Worldwide
Nike Manufacturing Countries
Cold Cement Assembly Nike
3D Printing Nike Shoes
Nike Product Development
Nike Marketing Strategies
Nike Customer Feedback
Nike Distribution Centers
Automation in Nike Manufacturing
Nike Consumer Direct Acceleration
Nike Logistics and Transport
how to sell pi coins effectively (from 50 - 100k pi)DOT TECH
Anywhere in the world, including Africa, America, and Europe, you can sell Pi Network Coins online and receive cash through online payment options.
Pi has not yet been launched on any exchange because we are currently using the confined Mainnet. The planned launch date for Pi is June 28, 2026.
Reselling to investors who want to hold until the mainnet launch in 2026 is currently the sole way to sell.
Consequently, right now. All you need to do is select the right pi network provider.
Who is a pi merchant?
An individual who buys coins from miners on the pi network and resells them to investors hoping to hang onto them until the mainnet is launched is known as a pi merchant.
debuts.
I'll provide you the Telegram username
@Pi_vendor_247
Turin Startup Ecosystem 2024 - Ricerca sulle Startup e il Sistema dell'Innov...Quotidiano Piemontese
Turin Startup Ecosystem 2024
Una ricerca de il Club degli Investitori, in collaborazione con ToTeM Torino Tech Map e con il supporto della ESCP Business School e di Growth Capital
The European Unemployment Puzzle: implications from population agingGRAPE
We study the link between the evolving age structure of the working population and unemployment. We build a large new Keynesian OLG model with a realistic age structure, labor market frictions, sticky prices, and aggregate shocks. Once calibrated to the European economy, we quantify the extent to which demographic changes over the last three decades have contributed to the decline of the unemployment rate. Our findings yield important implications for the future evolution of unemployment given the anticipated further aging of the working population in Europe. We also quantify the implications for optimal monetary policy: lowering inflation volatility becomes less costly in terms of GDP and unemployment volatility, which hints that optimal monetary policy may be more hawkish in an aging society. Finally, our results also propose a partial reversal of the European-US unemployment puzzle due to the fact that the share of young workers is expected to remain robust in the US.
Abhay Bhutada Leads Poonawalla Fincorp To Record Low NPA And Unprecedented Gr...Vighnesh Shashtri
Under the leadership of Abhay Bhutada, Poonawalla Fincorp has achieved record-low Non-Performing Assets (NPA) and witnessed unprecedented growth. Bhutada's strategic vision and effective management have significantly enhanced the company's financial health, showcasing a robust performance in the financial sector. This achievement underscores the company's resilience and ability to thrive in a competitive market, setting a new benchmark for operational excellence in the industry.
2. 1
Safe Harbour
This presentation contains statements that constitute forward looking statements regarding the
intent, belief or current expectations of future growth in the different business lines and the global
business, financial results and other aspects of the activities and situation relating to the TIM Group.
Such forward looking statements are not guarantees of future performance and involve risks and
uncertainties, and actual results may differ materially from those projected or implied in the
forward looking statements as a result of various factors.
The 2Q'19 and 1H'19 financial and operating data have been extracted or derived, with the exception of some
data, from the TIM Group Half-year Condensed Consolidated Financial Statements as of and for the six months
ended 30 June 2019, which has been prepared in accordance with International Financial Reporting Standards
issued by the International Accounting Standards Board and endorsed by the European Union (designated as
"IFRS"). Please note that the limited review by the external auditors (E&Y) on the TIM Group Half-year Condensed
Consolidated Financial Statements at 30 June 2019 has not yet been completed.
The accounting policies and consolidation principles adopted in the preparation of the TIM Group Half-year
Condensed Consolidated Financial Statements as of and for the six months ended 30 June 2019 are the same as
those adopted in the TIM Group Annual Audited Consolidated Financial Statements as of 31 December 2018, to
which reference can be made, except for the adoption of the new accounting principle (IFRS 16 - Lease), adopted
starting from 1 January 2019. In particular, TIM adopts IFRS 16, using the simplified retrospective approach,
without restatement of prior period comparatives. The implementation of the new standard has not been fully
completed; the impact of the adoption of IFRS 16 is unaudited and may be subject to change until the publication
of TIM’s 2019 Annual Report. It should be noted that, starting from 1 January 2018, the TIM Group adopted IFRS
15 (Revenues from contracts with customers) and IFRS 9 (Financial instruments).
To enable the year-on-year comparison of the economic and financial performance for the first half of 2019, “IFRS
9/15” income statement figures, prepared in accordance with the previous accounting standards applied (IAS 17
and related Interpretations) are provided, for the purposes of the distinction between operating leases and
financial leases and the consequent accounting treatment of lease liabilities
Alternative Performance Measures
The TIM Group, in addition to the conventional financial performance measures established by IFRS,
uses certain alternative performance measures in order to present a better understanding of the
trend of operations and financial condition. In particular, such alternative performance measures
include: EBITDA, EBIT, Organic change and impact of non recurring items on revenue, EBITDA and
EBIT; EBITDA margin and EBIT margin and net financial debt. Moreover, following the adoption of
IFRS 16, the TIM Group provides the following further financial indicators:
▪ EBITDA adjusted After Lease ("EBITDA-AL"), which is calculated by adjusting Organic EBITDA, net
of non-recurring items, of the amounts related to the accounting treatment of finance lease
contracts in accordance with IAS 17 (applied until the end of 2018) and IFRS 16 (applied from
2019);
▪ Adjusted Net Financial Debt After Lease, which is calculated by excluding from the adjusted net
financial deb the liabilities related to the accounting treatment of finance lease contracts in
accordance with IAS 17 (applied until the end of 2018) and IFRS 16 (applied from 2019).
Such alternative performance measures are unaudited.
4. 3
Q2 ’19 Results
Highlights
Plan execution at full speed
▪ Net Debt further decrease driven by strong OFCF generation
▪ Working capital outflow strongly reduced
▪ Equity Free Cash Flow generation trebled vs. 2018 in H1 2019
Accelerating deleverage
What happened in Q2
Revamp culture
and organization
Discipline, focus and simplicity
Revamp domestic business
value and quality positioning,
modernization, efficiency
Further develop Brazil
ride growth waves and efficiency plan
Deleverage
and focus on ROIC
KPIs
Net Debt reduced
-€349m Q2, -€539m H1
EqFCF generation
€570m Q2, €786m H1
▪ Agreement with Labour Unions on “Expansion Contract” from late
August, first company in Italy to use the new law
▪ First waves of exits: 1,581 headcounts exits in H1 including 1,266
on 1 July; second round in December
▪ Accelerating re-skilling and inclusion, e.g. engagement survey
▪ 5G launched and ramping up to bring value through premiumness
▪ OpenSignal award confirms TIM’s top of the class Mobile network
▪ Mobile ARPU stabilized for TIM; market prices up (new clients & CB)
▪ “Fix the fixed”: BB net adds back to growth; comprehensive plan
under way to improve KPIs
▪ Revenue reacceleration despite competitive and macro dynamics
▪ Infrastructure sharing and other projects; MOU signed with Vivo
▪ New R$ 3.4 Bn tax asset: final judgment provides right to
compensate past excess operating tax payments from future taxes
Q2 ’19 EBITDA +6.3% YoY
New Brazilian tax asset
R$ 3.4 Bn or €0.8bn to be
used in 3/4 years
+17 months expansion
contract financial impact
similar to “solidarietà”
on top of
~37% of 2021 cost
cutting(1) secured
13.0 12.4 12.5
Q4 '18 Q1 '19 Q2
Human ARPU € / line / month
(1) Planned cost cutting: -8% P/L view, -14% cash-view on addressable costs (€5.1bn) in 2021
5. 4
Q2 ’19 Results
Highlights
Strategic initiatives update
▪ Work in progress with financial advisors, contacts with Open Fiber shareholders protected
by NDA announced on June 20th
▪ Options presented to TIM Board
▪ Board confirmed the mandate to the CEO to continue negotiations with OF shareholders
▪ TIMVISION: moving from content production to content aggregation
▪ Settled long time dispute with Sky, which will allow to bundle with TIMVISION NowTV
(ticket Sport) that includes several sports like Serie A TIM matches
▪ Distribution agreements with Amazon, Discovery, Mediaset, Netflix and others
▪ Agreements signed on July 26th (1)
▪ TIM and Vodafone will jointly control the new INWIT through equal stakes (37.5% each,
with the option of reducing to 25%) and will enter into a three-year lock-up agreement
▪ TIM expects >€150m synergies p.a.: >€80m p.a. direct synergies on top of €75m pro-quota
share (37.5%) of estimated synergies (€200m) for New INWIT in terms of annual
improvement in EBITDA by 2026 stemming from the deal
▪ The transaction will allow TIM to cut debt by more than €1.4bn over time
▪ Partnership with consumer credit player to enhance credit management effectiveness,
support sales and exploit cross selling opportunities
▪ Short list defined, partner to be selected by October 2019
Network sharing partnership
TIM-Vodafone Italia
Potential partnership
in fiber roll-out
Transformational strategy in
content aggregation
Consumer credit partnership
(1) The transaction is subject to approval by INWIT’s non-controlling shareholders
7. 6
Q2 ’19 Results
Second quarter showing continuous improvement in cash-
generation:
▪ Net Debt at €24,731m, with a reduction of -€349m from
previous quarter and -€539m from FY’18
▪ Equity FCF trebled YoY in H1118 149
913 887
1,028 1,033
▪ Service revenues excluding Sparkle -0.4% YoY, with
Domestic -1.2% and Brazil +2.4%
▪ EBITDA -2.6%, with Domestic at -4.4% and Brazil +6.3%
YoY. EBITDA margin +0.6p.p. to 42.2% in Q2
Organic data (1), €m
Q2 ’19 Main Results
Deleverage accelerating in Q2; €786m Equity FCF in 6 months
Q2 ’18
SERVICE
REVENUES
EBITDA
EBITDA-
CAPEX
NET DEBT(3)
Domestic
Brazil
899 922
3,358 3,232
4,250 4,143Group
Growth
ex Sparkle (2)
-1.2%
-0.4%
24,731
25,080
25,270
Q2 '19
Q1 '19
FY '18
EQUITY FREE
CASH-FLOW
Q2 ’19
All figures based on IFRS
9/15 accounting standards
and on a comparable base
+0.5%
-2.8%
+24.9%
-2.5%
-3.8%
+2.4%
342 364
1,618 1,546
1,958 1,907-2.6%
-4.4%
+6.3%
% on revenues 41.6% 42.2%
Q1 Q2 H1
2018
Q1 Q2 H1
2019
3x
(1) Excluding exchange rate fluctuations & non recurring items. CAPEX excluding license
(2) Total service revenues growth excluding Sparkle’s International Wholesale revenues, without any impact on EBITDA. Sparkle’s EBITDA growing +17% YoY in Q2
(3) Adjusted Net Debt
8. 7
Q2 ’19 Results
Q2 ’19 Domestic Mobile
ARPU growing QoQ, churn better. First signs of improvement in human calling CB
Mobile KPIs
Customer Base
k, Rounded numbers
22,256 21,956
9,492 9,706
31,748 31,662
Q1 '19 Q2 '19
-86
Human
-300
Calling
human
-230 vs -289
in Q1
Not
Human
+214
(1) Underlying YoY growth rate: excluding mobile termination rates reduction and accounting adjustments for pre-paid cards mismatch in Q2’18
Organic data, €m
Mobile Revenues
102 114
942 830
277
168
Q2 '18 Q2 '19
1,321
1,111
Handsets &
Handsets
Bundle
1,044
943
Service
-9.6%
-15.9%
-8.7%
underlying
growth1
▪ ARPU growing 1% QoQ (consumer ARPU +2.1% QoQ). Both new and
actual clients ARPU returning to growth thanks to price increases,
selective repricing and upselling
▪ MNP further cooling down
▪ Churn improving
▪ Kena net adds halving again QoQ (~50k net adds in Q2)
▪ Customer base stable compared to Q1 thanks to M2M and reduced
churn on calling lines. Human lines were impacted by anniversary of
Q2 2018 aggressive promos pre-empting/responding to Iliad.
Market stability improving with exception of low end
▪ Lower sales of handsets with improved marginality
13.6 13.5
13.0
12.4 12.5
Q2 '18 Q3 Q4 Q1 '19 Q2
€ / line / month
TIM ARPU
(human)
4.0 5.7
3.8 2.9 2.6
Q2' 18 Q3 Q4 Q1' 19 Q2
Market MNP
-11%
43%
8% -16% -36%
Mln
6.0%
7.6%
6.2%
5.2%
4.3%
Q2 '18 Q3 Q4 Q1 '19 Q2
Churn rate
Wholesale
Retail
9. 8
Q2 ’19 Results
Q2 ’19 Domestic Mobile
5G launched in July consistently with quality approach and ROIC enhancing priority
Premium price offering
19.99€
29.99€
49.99€
+50%
+150%
5G4G
40GB 50GB 100GB
150 Mbps 2 Gbps 2 Gbps
Active
sharing TIM on Vodafone’s
antennas
Vodafone on
TIM’s antennas
Passive
sharing
~ 11k towers ~ 11k towers
Towers
New services
Mobile prices are on an
upward trend since year
end 2018, with new TIM’s
5G offering raising the
bar from 3Q’ 19
Full national coverage
By 2025
4 Years ahead
of previous plan thanks to
Inwit, Vodafone partnership
CAPEX
and
OPEX
Savings
Business Consumer
▪ Private wireless networks
▪ Smart City
▪ Smart Manufacturing
▪ Automotive
▪ Multivideo 4k
▪ Cloud gaming
▪ eTourism
▪ Immersive sport experience
Coverage
Infrastructure sharing
ROIC enhancing approach
5G
10. 9
Q2 ’19 Results
>€ 150m
FINANCIAL
BENEFITS
OPERATING
BENEFITS
WIDER 5G
COVERAGE
FASTER 5G
ROLL-OUT
ENHANCED
4G/5G CAPACITY
Planned coverage achieved 4
years ahead
5G full national coverage
reached by 2025
Sharing 4G nodes
TIM’s direct cash flow benefits
>€ 800m
>€ 80m
Cash flow benefits
(average per year)
Cumulated
10 years ~€ 200m
~€ 75m
TIM pro quota
(37.5%)
Additional EBITDA
run rate at INWIT
@ 2026
Access to INWIT’s improved cash generation
Q2 ’19 Domestic Mobile
TIM - Vodafone partnership ticks all boxes and generates > €150m synergies p.a.
11. 10
Q2 ’19 Results
327 231
510
568
1,618 1,610
Q2 '18 Q2 '19
Wireline Revenues
Organic data, €m
Q2 ’19 Domestic Wireline
Fixed service revenues +2.2% YoY excluding Sparkle (+1.8% in Q1)
2,597 2,586
Int’l Wholesale
-29.4%
Equipment
2,462 2,416
Domestic Wholesale
+11.4%
Retail
-0.5%
Service
-1.9%
-0.4%
▪ Retail down -0.5% due to:
▪ Consumer service revenues down -1.4% as line losses not
fully offset by ARPU increase (lower help from activation
fees vs. Q1)
▪ Business service revenues benefitting from premium pricing
and unique distribution (+0.7%)
▪ ICT services steady growth (+15.7% YoY)
▪ Domestic Wholesale up 11.4% thanks to strong commercial
performance and new tariffs approved by AGCOM (1)
▪ Sparkle’s International Wholesale revenues down -29.4%
following strategy revision, with positive impact on EBITDA
(+16.7% YoY growth in Q2) due to lower bad debt
+2.2% excl. Sparkle
(1) To be published
12. 11
Q2 ’19 Results
8,093 8,079
9,876 9,530
Q1 '19 Q2 '19
Wireline KPIs
Q2 ’19 Domestic Wireline
ARPU growth benefitting from FTTx conversion; still supported in Q2 by pricing dynamics
17,969
Wholesale
-14
Retail
-346
-360
▪ Retail line losses were 346k in Q2 ’19, due to higher clean-up
activity vs. Q1 (stricter disconnection policy discipline to optimize
credit management introduced in Q1)
▪ Broadband net adds back to growth, thanks to push on voice only
customers
▪ Wholesale lines see continuous migration to fiber (+253k VULA)
offsetting disconnections on lower ARPU copper lines (-249k ULL,
down QoQ) with strong benefit on revenues (VULA priced >50%
above ULL)
Total Accesses (1)
(1) On TIM infrastructure, retail VoIP excluded
2,616 2,869
3,345 3,428
Q1 '19 Q2 '19
5,961 6,297
+83
FTTx Accesses
32.6 33.0 34.9 35.5 35.6 35.7
24.9 25.2 27.1 28.0 29.0 29.6
Q1 '18 Q2 Q3 Q4 Q1 '19 Q2
Broadband
+17.2% YoY
Consumer
+8.3%YoY
ARPU
Migration to fiber continues: 6.3m lines reached, +5.6% QoQ and
+45% YoY although Q2 focus was on migrating voice only to ADSLLines x 1,000
▪ ARPU consumer at 35.7 €/month, growing 8.3% YoY.
Continuous growth of broadband ARPU (+17.2% yoy) driven by
2018 repricing and upselling of “beyond connectivity” services
▪ Market discipline 2019: competitors reducing price gap vs. TIM’s
premium positioning: repricing of existing client base in July and
August by main competitors
17,609
+253
+336
€ / line / month
60
Q2 '18 Q3 Q4 Q1 '19 Q2
Broadband net adds
lines x 1,000
13. 12
Q2 ’19 Results
Q2 ’19 Domestic Wireline
Fix the fixed: pulling all levers
▪ Premium positioning: the best technology at the max speed
▪ Modular offering with valuable adds-on: security, entertainment, smart home,
assistance, voice designed for upselling
▪ 1st Year in promo and 2nd year price increase “embedded”
▪ ARPU from 2nd year, +14/17% vs previous offering
▪ Bad-debt-proof: bank account direct debit or €100 deposit
Broadband
push
Expected
improvement in
regulatory
framework
and incremental
sales force
Geo-marketing
approach
FWA
launch
▪ TIM Flexy: value for money offer targeting
2nd homes
▪ Local promos in selected cities
▪ New FWA offer in Q3-Q4 in municipalities
with high market potential and no fiber
coverage
Strong push on
premium
content
Distribution
processes
tightened
▪ Back to positive net BB adds in Q2 (+60k)
▪ Pushing migration of voice only customers to
broadband
TIM SUPERNew
offering
AGCOM access market analysis envisages:
▪ Withdrawal of the ban for network technicians
to sell to TIM retail customers, leading to
additional staff for upselling services and
products to the current TIM customer base
▪ Withdrawal of ex ante test on NGA flagship
products
▪ Reduction of the notice period from 30 to 20
days on offers that remain subject to replicability
test ex ante
▪ Improving key technical and commercial
processes with the aim of enhancing
customer satisfaction and reducing churn
14. 13
Q2 ’19 Results
Q2 ’19 Domestic Wireline
TIMVISION content strategy: a new football/sports proposition
# Number of matches per matchday
Distribution through set-top box
Content strategy to increase fixed arpu and decrease churn rate
Bundle NowTv + TIMVISION
7
OTHER SPORTS
F1, MotoGP, Tennis (Wimbledon, ATP
Masters 1000), Basket FIBA 2019 World
Cup, Golf, Rugby, Athletics
5
2
ticket sport
kit Sport
Co-marketing Agreement
Streaming of free-to-air channels (including some Champions League
matches) plus 7 days “catch-up TV”
15. 14
Q2 ’19 Results
-26
15
548 544
124 116
242 277
397 399
98 122
391 277
377
273
Interconnection
Equipment
CoGS
Commercial
Industrial
G&A
Labour
Other
Organic data, €m
▪ Interconnection & equipment: benefiting from new
strategy for Sparkle and for lower mobile subsidies
▪ Commercial: commissioning costs rationalized (-31%
fall YoY), caring optimization through digital channels
▪ Industrial: increased productivity in assurance and
lower energy consumption. However higher YoY
energy cost negotiated in 2018 weigh €15m in Q2
▪ G&A: lower cost of utilities and consulting
▪ Labour: limited reduction due to one off release of
provisions for unused holidays (€23m) adding to lower
capitalization
▪ Other: Q2 2018 benefited from liability reversal and
rebates (~€35m)
Q2 ’19 Domestic OPEX
Cost reduction moving forward, focus remains on cash impact
2,0232,152
OPEX
OPEX on a reduction path at €2,023m, down €129m YoY
(-6%)
Net of deferred costs, on a cash view, the reduction
reaches €204m (-9% YoY)
Q2 ’19Q2 ’18
OPEX
1%
14%
-7%
-1%
-6%
(-129)
-28%
-29%
24%
-9%
(1) Net of deferred costs, total OPEX amounts to € 2,284m in Q2’18 and € 2,079m in Q2’19
(2) Net of capitalized labour cost
Net of deferred
costs (1)
-8%
+1%
-8%
-1%
-28%
-29%
+24%
-35
+4
-15
-6
-205
-104
-113
+24
+41
(2)
16. 15
Q2 ’19 Results
▪ Service revenues up 2.4%, with MSR +1.9% YoY and FSR +
11.8% YoY driven by TIM Live ARPU and CB increase
▪ EBITDA growing solidly 6.3% YoY to reach R$ 1.6 bln in Q2.
EBITDA margin now standing at 37.6% (+1.4 p.p.)
▪ Solid network development: FTTH coverage grew 3.8 times in
a year, reaching 1.6 mln households(1)
▪ MOU with Vivo and use of 5G technologies to increase assets
efficiency
Organic data, R$m, Rounded numbers
(1) Addressable HH ready to sell
Q2 ’19 TIM Brasil
TIM Brasil improves performance amid external challenges
SERVICE
REVENUES
EBITDA
EBITDA-
CAPEX
Mobile
Total
3,768 3,839
1,508 1,603+6.3%
527 658+24.9%
3,968 4,063+2.4%
+1.9%
Q2 ’18 Q2 ’19
Improvement in top line thanks to fixed and postpaid, with
efficiency plan guaranteeing solid growth and margin expansion
despite though competition and adverse macro
Postpaid Net Adds
+748k in Q2
(CB: 21.3 Mln)
TIM Live ARPU
R$ 78.0
+7.8% YoY
TIM Live CB
topped
500k clients
with ~20% in FTTH
FTTH coverage
> 1.560k HH (1)
reached
TIM Live Revs
R$ 115 mln
>30% growth
for 10 quarters
Mobile ARPU
R$ 23.2
+5.8% YoY
17. 16
Q2 ’19 Results
In 2017 Brazilian Supreme Court stated that ICMS (State Tax) cannot be
included in the calculation basis of PIS and COFINS (Federal Tax).
PIS/COFINS are levied on revenues and the Supreme Court stated that
ICMS cannot be considered a revenue.
Q2 ’19 TIM Brasil
TIM Brasil’s new TAX asset: R$3.4 Bn implying c. €0.8bn debt reduction in 3/4 years
R$ 3,418m (1)
Gross tax credits
To be used in ~3/4 years (2)
Now booked in NWC it will
gradually improve net debt
when used
Leading case:
Favorable decision
Apr. 2017 Q4’ 18 Q2’ 19 Q3’ 19
R$ 353m R$ 2,876m R$ 189m
Booked after final
court decision:
TIM NE
Booked after final
court decision:
TIM CEL
Final court decision.
To be booked:
TIM CEL
(1) Monetary correction recognition will increase until the compensation of the tax credits
(2) In 2018, company paid ~R$ 880m of PIS/COFINS
19. 18
Q2 ’19 Results
H1 ’19 TIM Group
CAPEX and Net Operating Working Capital under control
H1 ’18 H1 ’19
GROUP
DOMESTIC
TIM BRASIL
Op.WC
Op.WC net
non recurring
items
Non
recurring
items
+608
+762
-167
o/w +42 in Q2
o/w +41 in Q2
o/w -13 in Q2
Group recurring NWC improving €608m yoy
▪ Domestic improving €762m YoY in H1 and €42m
in Q2 driven by lower inventories (+€104m), VAT
impact from split payment in Q1 ’18 (+€282m),
change from billing in advance to billing in arrears
in Q1 ’18 (+€182m) and higher trade payables
(+€100m)
▪ TIM Brasil worsening €167m YoY mainly driven by
higher trade receivables for costumer base
repositioning (more post paid)
NWC improving €156m YoY including one offs
▪ Domestic provisions help NWC €278m YoY
▪ Brazilian tax credit inflates NWC €662m YoY
(€610m net of Brazilian provisions)
Organic data, €m
CAPEX Net Operating Working Capital
€m
Q2 ’19
705 659
224 215
Q2 ’18
-6.5%
930 874-6.0%
Domestic
Group
Brazil -3.7%
20. 19
Q2 ’19 Results
1
541 414
1,364
1,102
353
181
103
4,0585,000
1,496
564
3,085
2,418
3,318
10,200
21,081
2,703
7,703
541
1,910
1,928
4,187
2,771
3,499
10,303 25,139
Liquidity margin Within 2019 FY 2020 FY 2021 FY 2022 FY 2023 FY 2024 Beyond 2024 Total M/L Term
Debt
(2)
Debt Maturities
Liquidity
Margin
Bonds Loans
Undrawn portions of
committed bank lines
Cash & cash
equivalent
(1) Includes € 490 mln repurchase agreements that will expire within August 2019
(2) €25,139m is the nominal amount of outstanding medium-long term debt. By adding the balance of IAS adjustments and fair value valuations (€514m) and current financial
liabilities (€831m), the gross debt figure of €26,484m is reached
Cost of debt: ~3.7%
Q2 ’19 TIM Group
Liquidity margin – After Lease view – Cost of debt ~3.7%, -0.1pp QoQ, -0.3pp YTD
€m
Covered until 2021
(1)
21. 20
Q2 ’19 Results
Q2 ’19 TIM Group
Net Income +19.8% yoy
Reported data, €m, Rounded numbers
Net Interest
& Net
Income/
Equity
EBIT Net Income
Reported
Taxes Net Income
ante
Minorities
Minorities
874 (361) (141) 372 (39) 333
+312 +41 (153) +200 (134) +66
EBITDA
Organic
EBITDA
Reported
Depreciation &
amortization
& Other
1,940
+333
(1,066)
(21)
1,958
(51)
Non
recurring
items
(26)
+392
Q2 ‘18
D
Q2 ‘19
Domestic provisions
Brasil (ICMS exclusion from PIS/COFINS
tax base, net of Brazilian provisions)
(244)
610
22. 21
Q2 ’19 Results
Q2 ’19 TIM Group
After Lease view shows slightly better trends yoy
€m, organic
Group
69
1,618 (91) 1,527 1,5461,477
(-3.3%)
(-4.4%)
Q2 ’18
EBITDA
81
1,958 (107)
Depreciation
/ Financial
expenses
(IAS 17)
1,851 1,907
Q2 ’18
EBITDA
AL
Q2 ‘19
EBITDA
AL
1,826
Q2 ‘19
EBITDA
(-1.4%)
(-2.6%)
Depreciation
/ Financial
expenses
(IAS 17)
Q2 ‘18
EBITDA
Depreciation /
Financial expenses
(IAS 17)
Q2 ‘19
EBITDA
Depreciation /
Financial expenses
(IAS 17)
Domestic
EBITDA After Lease
€m, organic
Group
Net Debt
FY ’18
1,91325,270 (1,948)
IAS17
23,322 24,731
Net Debt
AL
FY ’18
Net Debt
AL
H1 ’19
22,818
Net Debt
H1 ’19
(504)
(539)
Net Debt After Lease
IAS17
Under the After Lease view, results show slight
improvements vs. the IFRS 9/15 view:
▪ Group EBITDA-AL –1.4% YoY
▪ Domestic EBITDA-AL –3.3% YoY
▪ Group Net Debt AL at €22,818m with a reduction of
€504m from December 2018
€m, reported
Q2 ‘18
EBITDA-AL
Q2 ‘19
EBITDA-AL
24. 23
Q2 ’19 Results
Q2 ’19 TIM Group
Key Take-aways
▪ We are delivering on time and de-levering fast
▪ Return on invested capital remains our key priority
▪ Organic action remains focused on:
• Revenues stabilization
• Cost cutting, including risk
• Stopping NWC outflows
• Invested capital optimisation
▪ We are committed to provide additional upside through more inorganic action
▪ Guidance unchanged
25. 24
Q2 ’19 Results
Outlook
Guidance IFRS 9/15 and After Lease unchanged
2019
Group Domestic Brasil
2020-’21 2019 2020-’21 2019 2020-’21
Organic
Service revenues
Organic
EBITDA-AL
CAPEX
Eq FCF
Adjusted
Net Debt AL
Low single digit
decrease
Low single digit
growth
Low single digit
decrease1 Almost stable +3% - +5% (YoY)
Mid single digit
growth
Low single digit
decrease
Low single digit
growth
Low to Mid
single digit
decrease
Low single digit
growth
Mid to High
single digit
growth (YoY)
EBITDA margin
≥ 39% in ‘20
≥ 40% pre IFRS 9/15
~EUR 2.9 bn / Year
~EUR 3 bn / Year pre IFRS 9/15
~R$ 12 bn cumulated
~R$ 12.5 bn pre IFRS 9/15
--
Cumulated ~EUR 3.5 bn
To be enhanced through inorganic actions
presently not included
-- --
~EUR 20.5 bn by 2021
~EUR 22 bn pre IFRS 9/15 (2)
-- --
YoY growth rates
(1) Domestic revenue growth excluding Sparkle’s zero-low margin voice traffic business stopped (no impact on EBITDA; Sparkle EBITDA actually grew 18% YoY in H1)
(2) Guidance provided last February under old principles includes debt reduction from finance leases reimbursement, which remains but is not visible in an After Lease view
- Figures @ avg. Exchange Rate of 4.31 Reais/Euro
28. 27
Q2 ’19 Results
74
158
154
128
131
127
1,125
1,896540 414
1,364
1,102
353
181
103
4,058
5,000 1,496
564
3,085
2,418
3,318
10,200
21,081
2,703
7,703
614
2,068
2,083
4,315
2,901
3,625
11,428 27,035
Liquidity margin Within 2019 FY 2020 FY 2021 FY 2022 FY 2023 FY 2024 Beyond 2024 Total M/L Term
Debt
(2)
Debt Maturities
Liquidity
Margin
Bonds Loans
Undrawn portions of
committed bank lines
Cash & cash
equivalent
(1) Includes € 490 mln repurchase agreements that will expire within August 2019
(2) € 27,035m is the nominal amount of outstanding medium-long term debt. By adding the balance of IAS adjustments and fair value valuations
(€ 531m) and current financial liabilities (€ 831m), the gross debt figure of € 28,397m is reached
Annex
Liquidity margin – IFSR 9/15 view – Cost of debt -0.1pp QoQ, -0.4pp YTD
€m
Leases
(1)
Cost of debt: ~4.0%*
* Without IFRS 16
Covered until 2021
29. 28
Q2 ’19 Results
Average m/l term maturity:
7.7 years (bond 7.8 years only)*
Fixed rate portion on medium-long term
debt approximately 70%
Around 25% of outstanding bonds
(nominal amount) denominated in USD
and GBP and is fully hedged
Cost of debt: ~4.0%* including
cost of finance leasing
Gross debt 32,003
Financial Assets (3,675)
of which C&CE and marketable securities (2,704)
- C & CE (1,700)
- Marketable securities (1,004)
- Government Securities (567)
- Other (437)
Net financial position (with IFRS 16) 28,328
Net finance leases (IFRS 16) (3,597)
Net financial position 24,731
Maturities and Risk Management
N.B. The figures are net of the adjustment due to the fair value measurement of derivatives and related financial liabilities/assets, as follows:
- the impact on Gross Financial Debt is equal to € 1,975m (of which € 327 m on bonds);
- the impact on Financial Assets is equal to € 1,279m.
Therefore, the Net Financial Indebtedness is adjusted by € 696m
N.B. The difference between total financial assets (€ 3,675m) and C&CE and marketable securities (€ 2,704m) is equal to € 971m and refers to positive MTM
derivatives (accrued interests and exchange rate) for € 798m, financial receivables for lease for € 113m and other credits for € 59m
€m
Annex
Well diversified and hedged debt
Banks & EIB
4,862
Other
445
Lease liabilities
5,519
Bonds
21,177
15.2%
66.2%
1.4%
17.2%
* Without IFRS 16
30. 29
Q2 ’19 Results
Annex
Change in financial reporting: a reminder of key impacts
Unità di misura (100
D
IFRS 9/15
Post
IFRS 9/15
DNewRep
DIFRS16
IFRS 16 D IFRS16 D IAS17
"After
lease"
1000
Domestic -0.2 15.0 15.0 15.0
o/w Services -0.2 13.7 -0.3 13.4 13.4
Brasil -0.0 3.9 3.9 3.9
Group -0.2 18.9 18.9 18.9
Domestic -0.3 6.4 +0.4 6.7 -0.4 -0.3 6.0
Brasil -0.0 1.5 +0.3 1.8 -0.3 -0.1 1.4
Group -0.3 7.8 +0.7 8.5 -0.7 -0.4 7.4
Domestic -0.3 6.0 +0.4 6.4 -0.4 -0.3 5.6
Brasil -0.0 1.5 +0.3 1.8 -0.3 -0.1 1.4
Group -0.3 7.4 +0.7 8.1 -0.7 -0.4 7.0
Domestic -0.1 3.1 3.1 3.1
Brasil -0.0 0.9 0.9 0.9
Group -0.1 4.0 4.0 4.0
Net Debt 25.3 +3.6 28.9 -3.6 -1.9 23.3
Debt / EBITDA 3.2x 3.4x 3.1x
(1) Equipment in the new reporting includes Handsets bundle
CAPEX
ex spectrum
3.2
0.9
4.2
Net Debt
(Group)
25.3
3.1x
EBITDA
organic
6.6
1.5
8.1
EBITDA
reported
6.2
1.5
7.7
Reporting 2018 New Reporting
2018FY € Bn
Pre
IFRS 9/15
REVENUES
15.2
13.8
4.0
19.1
o IFRS16 impacts OPEX
(operating leases
removed) and Net
Debt (operating leases
liabilities added)
o For “After Lease”
view, both IAS17 and
IFRS16 effects are
removed and all
leases reclassified as
OPEX.
Net Debt is net of all
lease liabilities
1
2
3
2 3
New revenues
reporting
no impact on total
revenues1
D IFRS 16
DNewRevs
Reporting
34. 33
Q2 ’19 Results
(2)
362
644
558
492
469
417
2,544
5,486
540
414
1,364
1,102
353
181
103
4,058
5,000 1,496
564
3,085
2,418
3,318
10,200
21,081
2,703
7,703
903
2,554
2,486
4,679
3,240
3,916
12,847 30,625
-2000
3000
8000
13000
18000
23000
28000
33000
Liquidity margin Within 2019 FY 2020 FY 2021 FY 2022 FY 2023 FY 2024 Beyond 2024 Total M/L Term
Debt
Debt Maturities
Covered until 2021
Bonds Loans
Undrawn portions of
committed bank lines
Cash & cash
equivalent
(1) Includes € 490 m repurchase agreements that will expire within August 2019
(2) € 30,625m is the nominal amount of outstanding medium-long term debt. By adding the balance of IAS adjustments and fair value valuations
(€ 547m) and current financial liabilities (€ 831m), the gross debt figure of € 32,003m is reached
€m, IAS 17 included
Finance Leases
Liquidity
Margin
(1)
Cost of debt: ~4.3%*
* Including cost of all leases
Annex
Liquidity margin – IFRS 16 view – Cost of debt -0.1pp QoQ
35. 34
For further questions please contact the IR Team
IR Webpage
www.telecomitalia.com/investors
+39 06 3688 1
+39 02 8595 1
Phone
E-mail
Investor_relations@telecomitalia.it
Contact details for all
IR representatives:
www.telecomitalia.com/ircontacts
Investor Relations Contact Details
TIM
Slideshare
www.slideshare.net/telecomitaliacorporatewww.twitter.com/TIMNewsroom
TIM Twitter