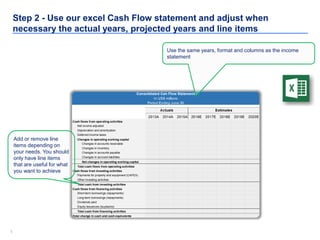
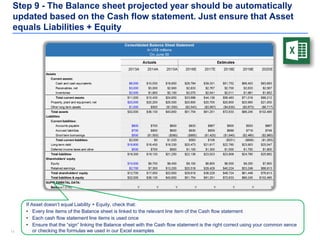
Three Financial Statements
Model
Training & Templates
By Former Deloitte
Management
Consultants
22
Table of content
How to create a 3 Financial Statements Model in 10 steps
Other products we provide at www.slidebooks.com
1
3
Free bonus slides2
33
Step 1 - Use our excel Income Statement template and adjust when
necessary the actual years, projected years and line items
Adjust the actual and projected years. Taking 3 historical
years and 5 projected years is usually a good trade-off
between being comprehensive and effective
Add or remove line
items depending on
your needs. You should
only have line items
that are useful for what
you want to achieve
The line items in
percentage have been
added to facilitate the
projection that we will
do later on
44
Click below or keep watching the following slides
Click here to download the
editable Excel and PowerPoint
version at www.slidebooks.com
55
Step 2 - Use our excel Cash Flow statement and adjust when
necessary the actual years, projected years and line items
Use the same years, format and columns as the income
statement
Add or remove line
items depending on
your needs. You should
only have line items
that are useful for what
you want to achieve
66
Step 3 - Use our excel Balance Sheet statement and adjust when
necessary the actual years, projected years and line items
Use the same years, format and columns as the income
statement
Add or remove
line items
depending on your
needs. You should
only have line
items that are
useful for what
you want to
achieve
77
Click below or keep watching the following slides
Click here to download the
editable Excel and PowerPoint
version at www.slidebooks.com
88
Step 4 - Create a map of the different excel sheets of your workbook
Income
statement
Cash flow
Balance
sheet
Quarterly and/or annual reports
Scenario with
assumptions
99
Step 5 - Fill in the historical years for the 3 financial statements
Income
statement
• Fill in the “$” line items using the company’s quarterly or/and yearly reports
• Fill the “%” line items using the formulas in our “Example” excels sheets (If you
added or removed line items, make sure the formulas stay relevant
Cash flow
• Link the line items “Net Income”, “D&A” and “Dividend paid” with the relevant
items within the Income statement
• Fill in the remaining line items using the company’s quarterly or/and yearly
reports
Balance
sheet
• Fill in every line items of the first historical year using the company’s quarterly
or/and yearly reports
• Fill in every line items of the other historical years by linking them with the
relevant line items from the cash flow statement
Generic tips
• Use a blue font for the hardcoded cells
• Use a black font for the calculated cells
• Use green font for your assumptions
1010
Step 6 - Identify if required several scenarios including different
assumptions using our excel sheet “scenario”
Insert below your scenario #
1
Changing the number in the yellow box, will update the
“selected scenario” which will update the 3 financial
statemens
1111
Click below or keep watching the following slides
Click here to download the
editable Excel and PowerPoint
version at www.slidebooks.com
1212
Step 7 - Fill in the projected years of the income statement with the
assumptions included in the excel sheet “Scenario”
Important
Note
• Sometimes you may want to have some assumptions in your income statement sheet and not
in your scenario sheet. If you do, make sure that they are in green. Besides be aware that
when you will change of scenario in your scenario sheet, these assumptions will stay identical
1313
Step 8 - Fill in the projected years of the cash flow statement
1414
Step 9 - The Balance sheet projected year should be automatically
updated based on the Cash flow statement. Just ensure that Asset
equals Liabilities + Equity
If Asset doesn’t equal Liability + Equity, check that:
• Every line items of the Balance sheet is linked to the relevant line item of the Cash flow statement
• Each cash flow statement line items is used once
• Ensure that the “sign” linking the Balance sheet with the Cash flow statement is the right correct using your common sence
or checking the formulas we used in our Excel examples
1515
Step 10 - Double check that your financial statements automatically
update when you change of scenario and make sure the financial
statements are linked properly
From Income statement…
Revenue
Cost of goods sold
Gross profit
Operating expenses
EBITDA
Depreciation and amortization
EBIT
Interest
Income tax expense
Net Income (Adjusted)
Net Income
Dividend payout
Net income after distribution
…to Cash flow statement
Net income adjusted
Depreciation and amortization
Deferred income taxes
Changes in accounts receivable
Changes in inventory
Changes in accounts payable
Changes in accrued liabilities
CAPEX
Other investing activities
Debt
Dividends paid
Equity Issuances (buybacks)
Total change in cash
Operating
activities
Investing
activities
Investing
activities
1616
Step 10 - Double check that your financial statements automatically
update when you change of scenario and make sure the financial
statements are linked properly
From Cash flow statement…
Net income adjusted
Depreciation and amortization
Deferred income taxes
Changes in accounts receivable
Changes in inventory
Changes in accounts payable
Changes in accrued liabilities
CAPEX
Other investing activities
Debt
Dividends paid
Equity Issuances (buybacks)
Total change in cash
Operating
activities
Investing
activities
Investing
activities
…to Balance Sheet
Cash
Receivables, net
Inventories
Property, plant and equipment, net
Other long term assets
Accounts payable
Accrued liabilities
Debt
Deferred income taxes
Equity
Retained earnings
Asset
Liabilities
Equity
1717
Click below or keep watching the following slides
Click here to download the
editable Excel and PowerPoint
version at www.slidebooks.com
1818
Table of content
How to create a 3 Financial Statements Model in 10 steps
Other products we provide at www.slidebooks.com
1
3
Free bonus slides2
1919
Roadmap
Insert priority
Insert priority
Insert priority
1
2
3
# initiatives
Revenue
(FY19 $M)
Insert stream of work
Projects 7 52.3
Functional
Delivery
3 3.5
Subtotal 10 55.8
Insert stream of work
Projects 5 60.2
Functional
Delivery
2 30.3
Subtotal 7 90.5
Insert stream of work
Projects 10 31.0
Functional
Delivery
9 7.0
Subtotal 19 38.0
Insert stream of work
Projects 9 29.3
Functional
Delivery
9 23.5
Subtotal 18 52.3
Total 54 $500M
2020
Roadmap
Insert priority
Insert priority
Insert priority
1
2
3
# initiatives
Revenue
(FY19 $M)
Insert stream of work
Projects 7 52.3
Functional
Delivery
3 3.5
Subtotal 10 55.8
Insert stream of work
Projects 5 60.2
Functional
Delivery
2 30.3
Subtotal 7 90.5
Insert stream of work
Projects 10 31.0
Functional
Delivery
9 7.0
Subtotal 19 38.0
Insert stream of work
Projects 9 29.3
Functional
Delivery
9 23.5
Subtotal 18 52.3
Total 54 $500M
2121
Click below or keep watching the following slides
Click here to download the
editable Excel and PowerPoint
version at www.slidebooks.com
2222
Roadmap
Insert priority
Insert priority
Insert priority
1
2
3
# initiatives
Revenue
(FY19 $M)
Insert stream of work
Projects 7 52.3
Functional
Delivery
3 3.5
Subtotal 10 55.8
Insert stream of work
Projects 5 60.2
Functional
Delivery
2 30.3
Subtotal 7 90.5
Insert stream of work
Projects 10 31.0
Functional
Delivery
9 7.0
Subtotal 19 38.0
Insert stream of work
Projects 9 29.3
Functional
Delivery
9 23.5
Subtotal 18 52.3
Total 54 $500M
2323
Calendar in a Powerpoint table
M T W T F
Week 1
• Working Group
Meeting
• … • …
Week 2
• Working Group
Meeting
• Steering
Committee
Meeting
Week #
• Working Group
Meeting
Week #
• Working Group
Meeting
• Steering
Committee
Meeting
Week #
• Working Group
Meeting
• Board Meeting
Steering Committee Meeting Board MeetingWorking Group Meeting
2424
Calendar in a Powerpoint table
M T W T F
1 2 3 4 5
8 9 10 11 12
15 16 17 18 19
22 23 24 25 26
29 30 31
M T W T F
1 2 3 4
7 8 9 10 11
14 15 16 17 18
21 22 23 24 25
28 29 30 31
M T W T F
1 2 3
6 7 8 9 10
13 14 15 16 17
20 21 22 23 24
27 28 29 30 31
M T W T F
1 2
5 6 7 8 9
12 13 14 15 16
19 20 21 22 23
26 27 28 29 30
Month starting on a Monday Month starting on a Tuesday
Month starting on a Wednesday
Steering Committee Meeting Board MeetingWorking Group Meeting
Month starting on a Thursday
2525
Click below or keep watching the following slides
Click here to download the
editable Excel and PowerPoint
version at www.slidebooks.com
2626
Calendar in a Powerpoint table
Steering Committee Meeting Board MeetingWorking Group Meeting
M T W T F
1
4 5 6 7 8
11 12 13 14 15
18 19 20 21 22
25 26 27 28 29
M T W T F
3 4 5 6 7
10 11 12 13 14
17 18 19 20 21
24 25 26 27 28
31
M T W T F
2 3 4 5 6
9 10 11 12 13
16 17 18 19 20
23 24 25 26 27
30 31
Month starting on a Friday Month starting on a Saturday
Month starting on a Sunday
2727
Table of content
How to create a 3 Financial Statements Model in 10 steps
Other products we provide at www.slidebooks.com
1
3
Free bonus slides2
2828
Click below or keep watching the following slides
Click here to download the
editable Excel and PowerPoint
version at www.slidebooks.com
2929
Package
1500 slides and 25 Excel Sheets
Click here on “slide show” mode
to access this product
3030
Mckinsey Seven-S tool - Product Sample
Click here on “slide show” mode
to access this tool
3131
Worldwide Maps - Product Sample
Click here on “slide show” mode
to access our Worldwide maps

Three Financial statements model Template

  • 1.
    Three Financial Statements Model Training& Templates By Former Deloitte Management Consultants
  • 2.
    22 Table of content Howto create a 3 Financial Statements Model in 10 steps Other products we provide at www.slidebooks.com 1 3 Free bonus slides2
  • 3.
    33 Step 1 -Use our excel Income Statement template and adjust when necessary the actual years, projected years and line items Adjust the actual and projected years. Taking 3 historical years and 5 projected years is usually a good trade-off between being comprehensive and effective Add or remove line items depending on your needs. You should only have line items that are useful for what you want to achieve The line items in percentage have been added to facilitate the projection that we will do later on
  • 4.
    44 Click below orkeep watching the following slides Click here to download the editable Excel and PowerPoint version at www.slidebooks.com
  • 5.
    55 Step 2 -Use our excel Cash Flow statement and adjust when necessary the actual years, projected years and line items Use the same years, format and columns as the income statement Add or remove line items depending on your needs. You should only have line items that are useful for what you want to achieve
  • 6.
    66 Step 3 -Use our excel Balance Sheet statement and adjust when necessary the actual years, projected years and line items Use the same years, format and columns as the income statement Add or remove line items depending on your needs. You should only have line items that are useful for what you want to achieve
  • 7.
    77 Click below orkeep watching the following slides Click here to download the editable Excel and PowerPoint version at www.slidebooks.com
  • 8.
    88 Step 4 -Create a map of the different excel sheets of your workbook Income statement Cash flow Balance sheet Quarterly and/or annual reports Scenario with assumptions
  • 9.
    99 Step 5 -Fill in the historical years for the 3 financial statements Income statement • Fill in the “$” line items using the company’s quarterly or/and yearly reports • Fill the “%” line items using the formulas in our “Example” excels sheets (If you added or removed line items, make sure the formulas stay relevant Cash flow • Link the line items “Net Income”, “D&A” and “Dividend paid” with the relevant items within the Income statement • Fill in the remaining line items using the company’s quarterly or/and yearly reports Balance sheet • Fill in every line items of the first historical year using the company’s quarterly or/and yearly reports • Fill in every line items of the other historical years by linking them with the relevant line items from the cash flow statement Generic tips • Use a blue font for the hardcoded cells • Use a black font for the calculated cells • Use green font for your assumptions
  • 10.
    1010 Step 6 -Identify if required several scenarios including different assumptions using our excel sheet “scenario” Insert below your scenario # 1 Changing the number in the yellow box, will update the “selected scenario” which will update the 3 financial statemens
  • 11.
    1111 Click below orkeep watching the following slides Click here to download the editable Excel and PowerPoint version at www.slidebooks.com
  • 12.
    1212 Step 7 -Fill in the projected years of the income statement with the assumptions included in the excel sheet “Scenario” Important Note • Sometimes you may want to have some assumptions in your income statement sheet and not in your scenario sheet. If you do, make sure that they are in green. Besides be aware that when you will change of scenario in your scenario sheet, these assumptions will stay identical
  • 13.
    1313 Step 8 -Fill in the projected years of the cash flow statement
  • 14.
    1414 Step 9 -The Balance sheet projected year should be automatically updated based on the Cash flow statement. Just ensure that Asset equals Liabilities + Equity If Asset doesn’t equal Liability + Equity, check that: • Every line items of the Balance sheet is linked to the relevant line item of the Cash flow statement • Each cash flow statement line items is used once • Ensure that the “sign” linking the Balance sheet with the Cash flow statement is the right correct using your common sence or checking the formulas we used in our Excel examples
  • 15.
    1515 Step 10 -Double check that your financial statements automatically update when you change of scenario and make sure the financial statements are linked properly From Income statement… Revenue Cost of goods sold Gross profit Operating expenses EBITDA Depreciation and amortization EBIT Interest Income tax expense Net Income (Adjusted) Net Income Dividend payout Net income after distribution …to Cash flow statement Net income adjusted Depreciation and amortization Deferred income taxes Changes in accounts receivable Changes in inventory Changes in accounts payable Changes in accrued liabilities CAPEX Other investing activities Debt Dividends paid Equity Issuances (buybacks) Total change in cash Operating activities Investing activities Investing activities
  • 16.
    1616 Step 10 -Double check that your financial statements automatically update when you change of scenario and make sure the financial statements are linked properly From Cash flow statement… Net income adjusted Depreciation and amortization Deferred income taxes Changes in accounts receivable Changes in inventory Changes in accounts payable Changes in accrued liabilities CAPEX Other investing activities Debt Dividends paid Equity Issuances (buybacks) Total change in cash Operating activities Investing activities Investing activities …to Balance Sheet Cash Receivables, net Inventories Property, plant and equipment, net Other long term assets Accounts payable Accrued liabilities Debt Deferred income taxes Equity Retained earnings Asset Liabilities Equity
  • 17.
    1717 Click below orkeep watching the following slides Click here to download the editable Excel and PowerPoint version at www.slidebooks.com
  • 18.
    1818 Table of content Howto create a 3 Financial Statements Model in 10 steps Other products we provide at www.slidebooks.com 1 3 Free bonus slides2
  • 19.
    1919 Roadmap Insert priority Insert priority Insertpriority 1 2 3 # initiatives Revenue (FY19 $M) Insert stream of work Projects 7 52.3 Functional Delivery 3 3.5 Subtotal 10 55.8 Insert stream of work Projects 5 60.2 Functional Delivery 2 30.3 Subtotal 7 90.5 Insert stream of work Projects 10 31.0 Functional Delivery 9 7.0 Subtotal 19 38.0 Insert stream of work Projects 9 29.3 Functional Delivery 9 23.5 Subtotal 18 52.3 Total 54 $500M
  • 20.
    2020 Roadmap Insert priority Insert priority Insertpriority 1 2 3 # initiatives Revenue (FY19 $M) Insert stream of work Projects 7 52.3 Functional Delivery 3 3.5 Subtotal 10 55.8 Insert stream of work Projects 5 60.2 Functional Delivery 2 30.3 Subtotal 7 90.5 Insert stream of work Projects 10 31.0 Functional Delivery 9 7.0 Subtotal 19 38.0 Insert stream of work Projects 9 29.3 Functional Delivery 9 23.5 Subtotal 18 52.3 Total 54 $500M
  • 21.
    2121 Click below orkeep watching the following slides Click here to download the editable Excel and PowerPoint version at www.slidebooks.com
  • 22.
    2222 Roadmap Insert priority Insert priority Insertpriority 1 2 3 # initiatives Revenue (FY19 $M) Insert stream of work Projects 7 52.3 Functional Delivery 3 3.5 Subtotal 10 55.8 Insert stream of work Projects 5 60.2 Functional Delivery 2 30.3 Subtotal 7 90.5 Insert stream of work Projects 10 31.0 Functional Delivery 9 7.0 Subtotal 19 38.0 Insert stream of work Projects 9 29.3 Functional Delivery 9 23.5 Subtotal 18 52.3 Total 54 $500M
  • 23.
    2323 Calendar in aPowerpoint table M T W T F Week 1 • Working Group Meeting • … • … Week 2 • Working Group Meeting • Steering Committee Meeting Week # • Working Group Meeting Week # • Working Group Meeting • Steering Committee Meeting Week # • Working Group Meeting • Board Meeting Steering Committee Meeting Board MeetingWorking Group Meeting
  • 24.
    2424 Calendar in aPowerpoint table M T W T F 1 2 3 4 5 8 9 10 11 12 15 16 17 18 19 22 23 24 25 26 29 30 31 M T W T F 1 2 3 4 7 8 9 10 11 14 15 16 17 18 21 22 23 24 25 28 29 30 31 M T W T F 1 2 3 6 7 8 9 10 13 14 15 16 17 20 21 22 23 24 27 28 29 30 31 M T W T F 1 2 5 6 7 8 9 12 13 14 15 16 19 20 21 22 23 26 27 28 29 30 Month starting on a Monday Month starting on a Tuesday Month starting on a Wednesday Steering Committee Meeting Board MeetingWorking Group Meeting Month starting on a Thursday
  • 25.
    2525 Click below orkeep watching the following slides Click here to download the editable Excel and PowerPoint version at www.slidebooks.com
  • 26.
    2626 Calendar in aPowerpoint table Steering Committee Meeting Board MeetingWorking Group Meeting M T W T F 1 4 5 6 7 8 11 12 13 14 15 18 19 20 21 22 25 26 27 28 29 M T W T F 3 4 5 6 7 10 11 12 13 14 17 18 19 20 21 24 25 26 27 28 31 M T W T F 2 3 4 5 6 9 10 11 12 13 16 17 18 19 20 23 24 25 26 27 30 31 Month starting on a Friday Month starting on a Saturday Month starting on a Sunday
  • 27.
    2727 Table of content Howto create a 3 Financial Statements Model in 10 steps Other products we provide at www.slidebooks.com 1 3 Free bonus slides2
  • 28.
    2828 Click below orkeep watching the following slides Click here to download the editable Excel and PowerPoint version at www.slidebooks.com
  • 29.
    2929 Package 1500 slides and25 Excel Sheets Click here on “slide show” mode to access this product
  • 30.
    3030 Mckinsey Seven-S tool- Product Sample Click here on “slide show” mode to access this tool
  • 31.
    3131 Worldwide Maps -Product Sample Click here on “slide show” mode to access our Worldwide maps