Downloaded 117 times

![35
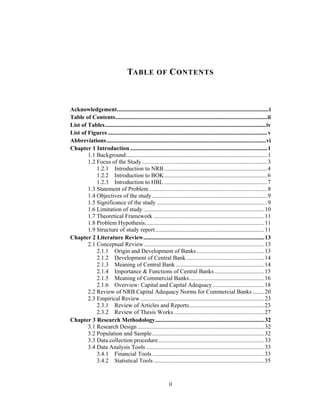
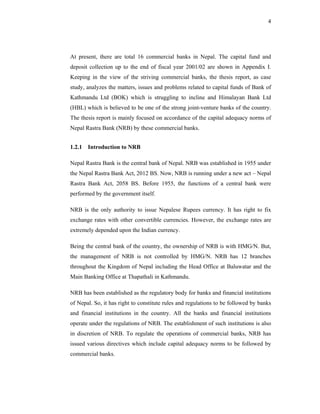
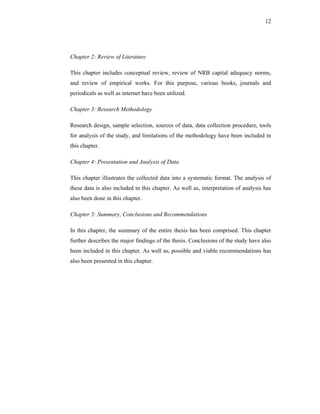
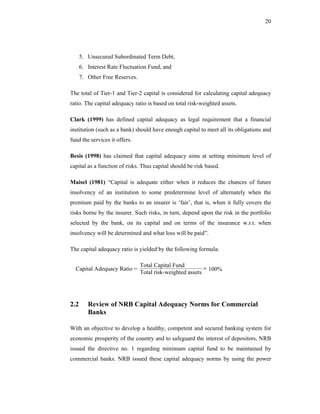
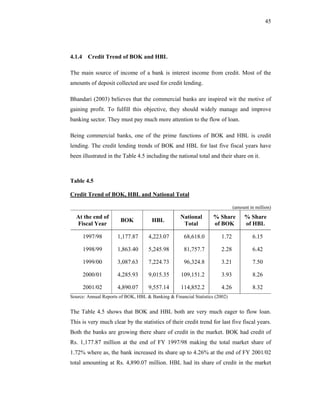
The capital to deposit ratio is derived by the following formula:
Total capital fund
Total deposit collected
× 100%
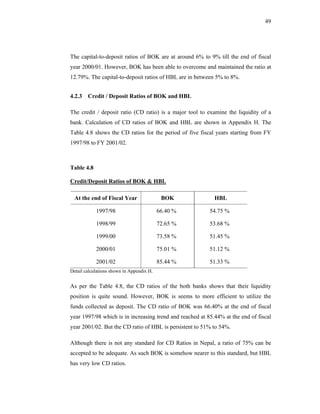
(c) Credit / Deposit Ratio:
The credit / deposit ratio (CD ratio) is a major tool to examine the liquidity of a
bank. CD ratio measures the ratio of fund that a bank has utilized in credit out of the
deposit total collected. More the CD ratio more the effectiveness of the bank to
utilize the fund it collected.
The CD ratio is derived by the following formula:
Total Credit
Total deposit collected
× 100%
3.4.2 Statistical Tools
The following statistical tools are used to analyze the data:
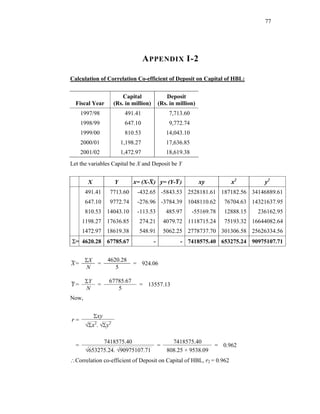
(a) Karl Pearson Correlation Analysis:
The relation between two variables is correlated by Karl Pearson’s correlation co-
efficient. The following is the formula proposed by Karl Pearson for calculation of
correlation coefficient.
NΣXY - (ΣX)(ΣY)
r=
√[NΣX - (ΣX)2] √[NΣY2 - (ΣY)2]
2
Where,
N = Numbers of pairs in observation
X = Product of the first variable
Y = Product of the second variable](https://image.slidesharecdn.com/thesis1-110907115702-phpapp01/85/Thesis-1-44-320.jpg)
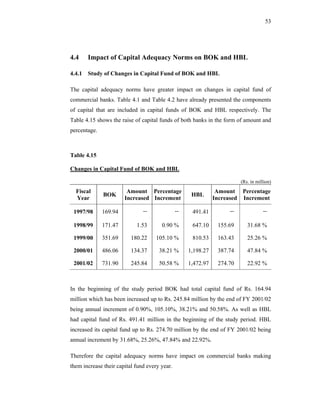


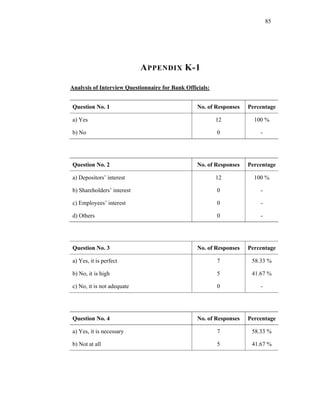

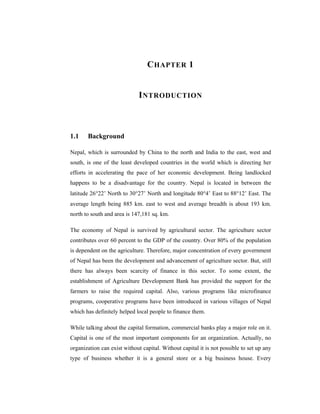
This thesis examines the impact of Nepal Rastra Bank's (NRB) capital adequacy norms on two commercial banks in Nepal - Bank of Kathmandu Ltd (BOK) and Himalayan Bank Ltd (HBL). The study analyzes the capital funds, risk-weighted assets, deposit trends, credit trends, capital adequacy ratios, and perceptions of depositors at both banks. Statistical tests are used to determine the relationship between capital funds and other variables after the introduction of NRB's capital adequacy directives in 2001. The results indicate that both banks increased their capital funds in response to the new norms, but that BOK still struggles to meet requirements while HBL remains one of Nepal's stronger joint-venture


![Banks Indian [www.writekraft.com]](https://cdn.slidesharecdn.com/ss_thumbnails/banksindian-180705081301-thumbnail.jpg?width=640&height=640&fit=bounds)
![Banks Indian [www.writekraft.com]](https://cdn.slidesharecdn.com/ss_thumbnails/banksindian-180615092304-thumbnail.jpg?width=640&height=640&fit=bounds)
![Banks Indian [www.writekraft.com]](https://cdn.slidesharecdn.com/ss_thumbnails/banksindian-180613085422-thumbnail.jpg?width=640&height=640&fit=bounds)
![Banks Indian [www.writekraft.com]](https://cdn.slidesharecdn.com/ss_thumbnails/banksindian-180612105247-thumbnail.jpg?width=640&height=640&fit=bounds)
![Banks Indian [www.writekraft.com]](https://cdn.slidesharecdn.com/ss_thumbnails/banksindian-180608093653-thumbnail.jpg?width=640&height=640&fit=bounds)


