Download as PDF, PPTX

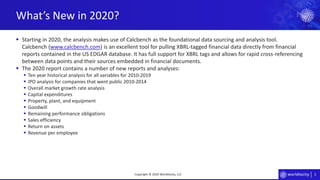
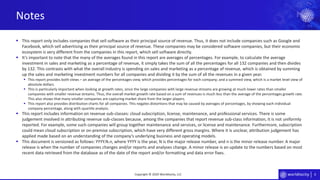
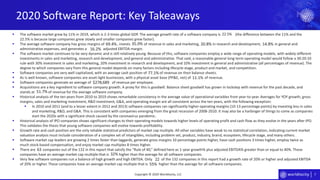

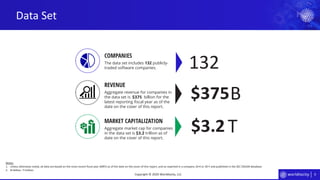

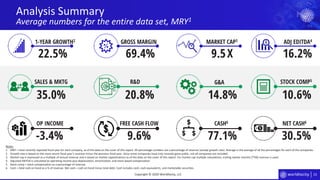
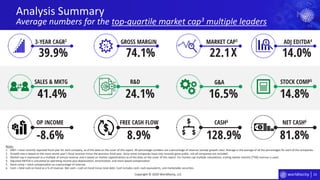
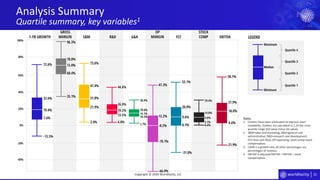

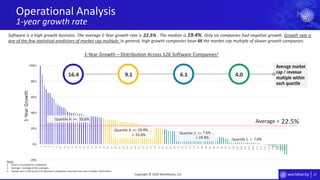
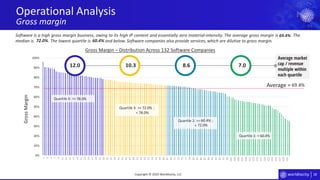
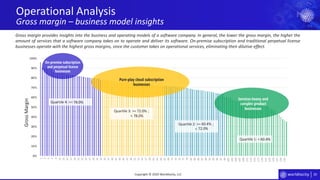
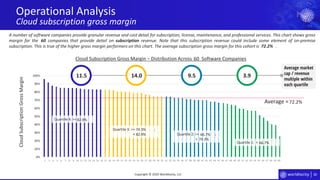
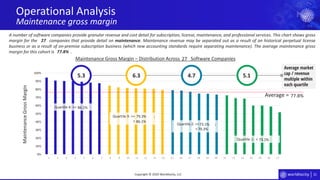
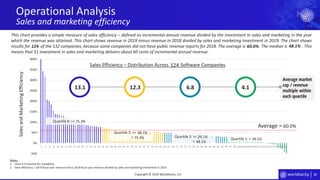
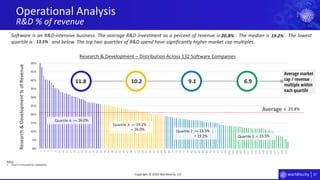
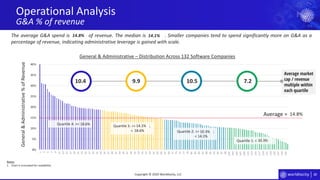
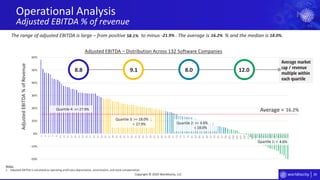
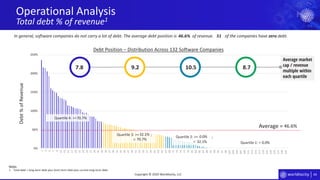
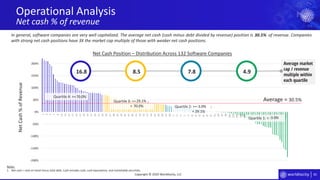
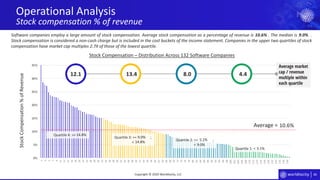
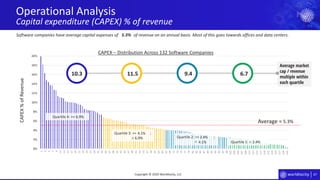

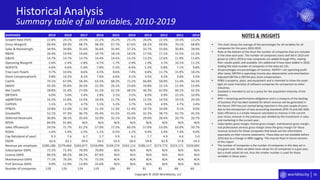


The 2020 Software Report provides benchmarking data for 132 public software companies, aimed at helping industry professionals understand company operations amidst the disruptions caused by the COVID-19 pandemic. It highlights key metrics such as market growth rates, average gross margins, and investment patterns, while also emphasizing the diversity in software company business models beyond just SaaS. The report stresses the importance of adapting operating strategies in light of evolving market conditions and offers insights for future analysis and research.


