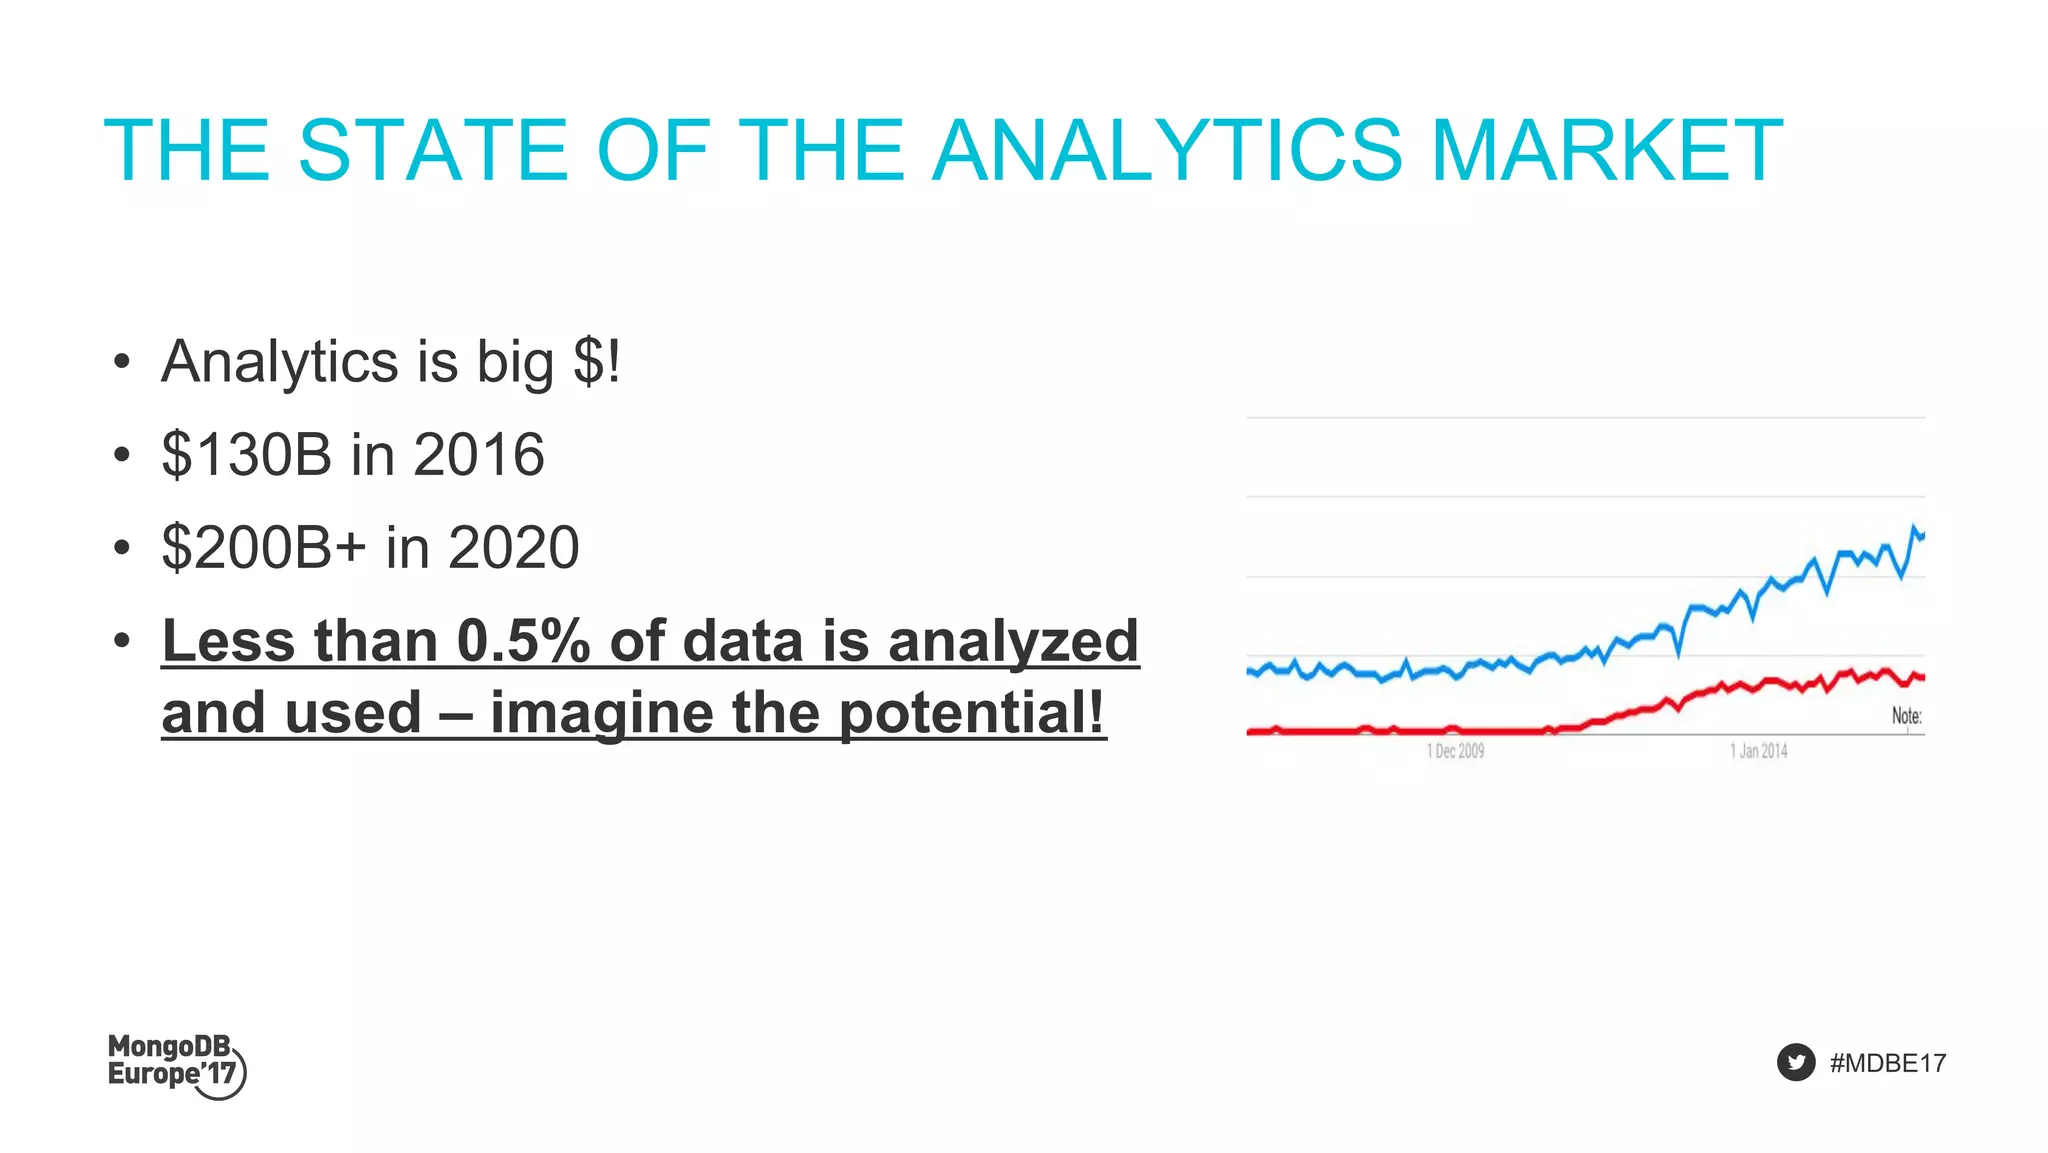
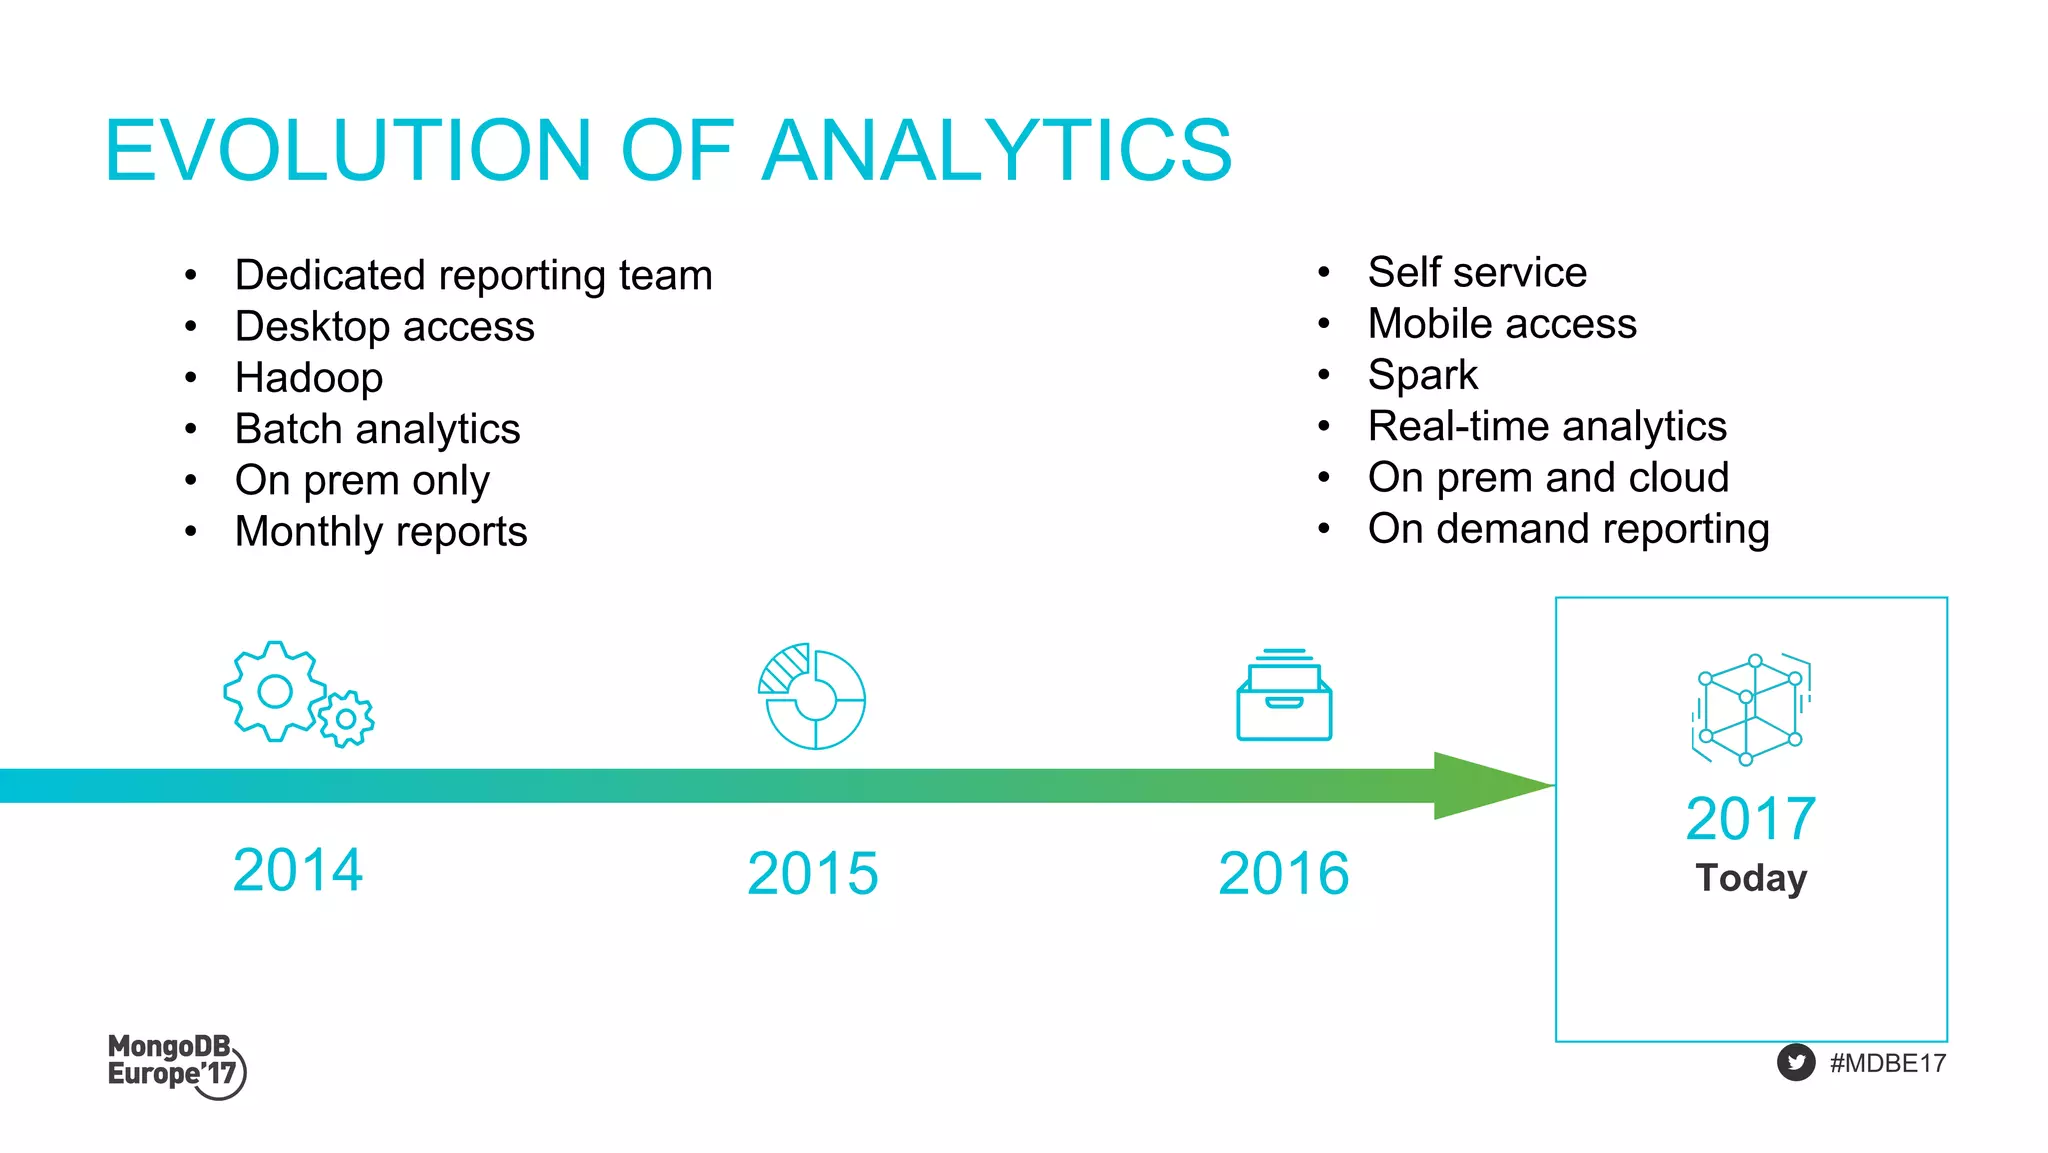
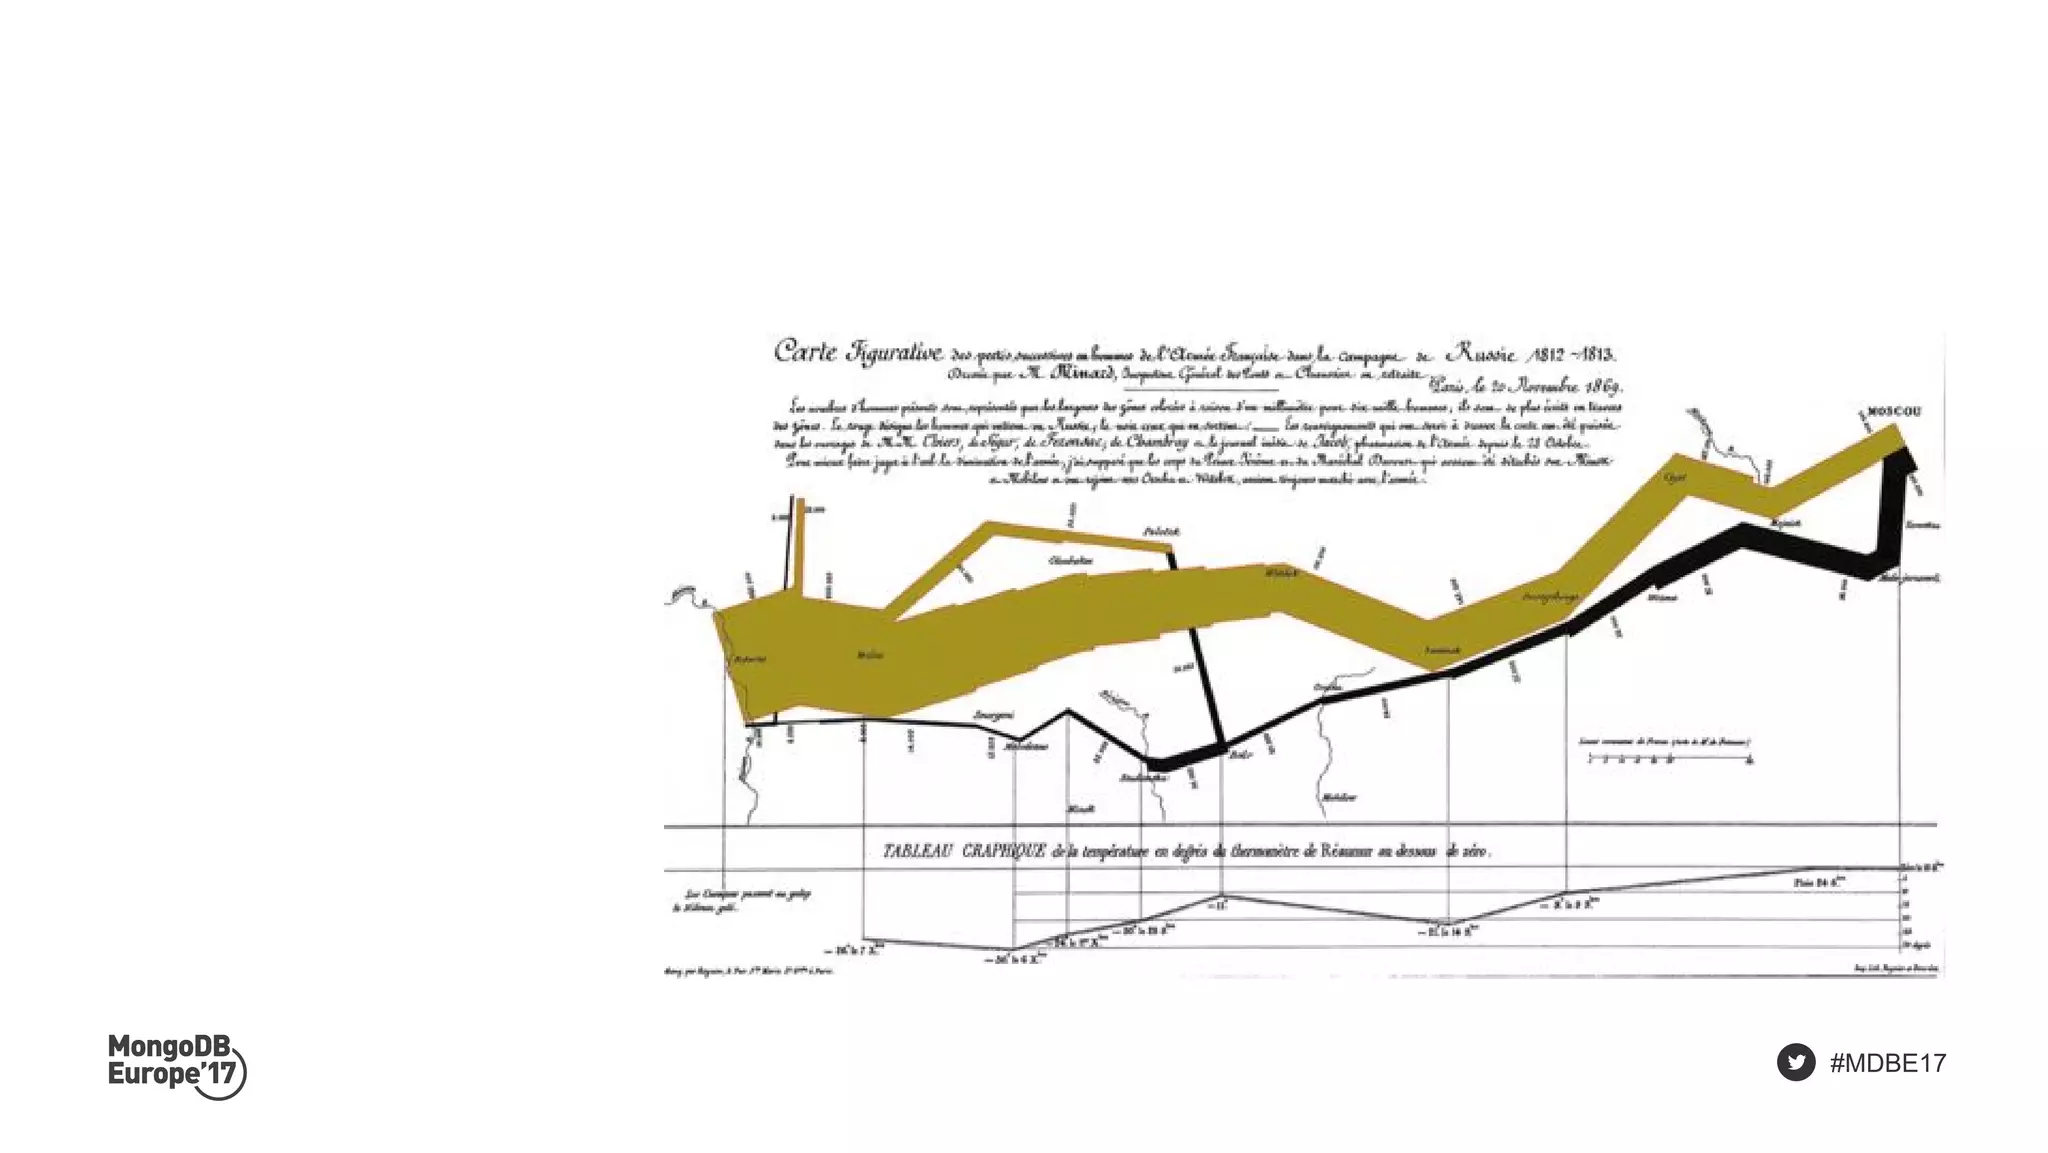
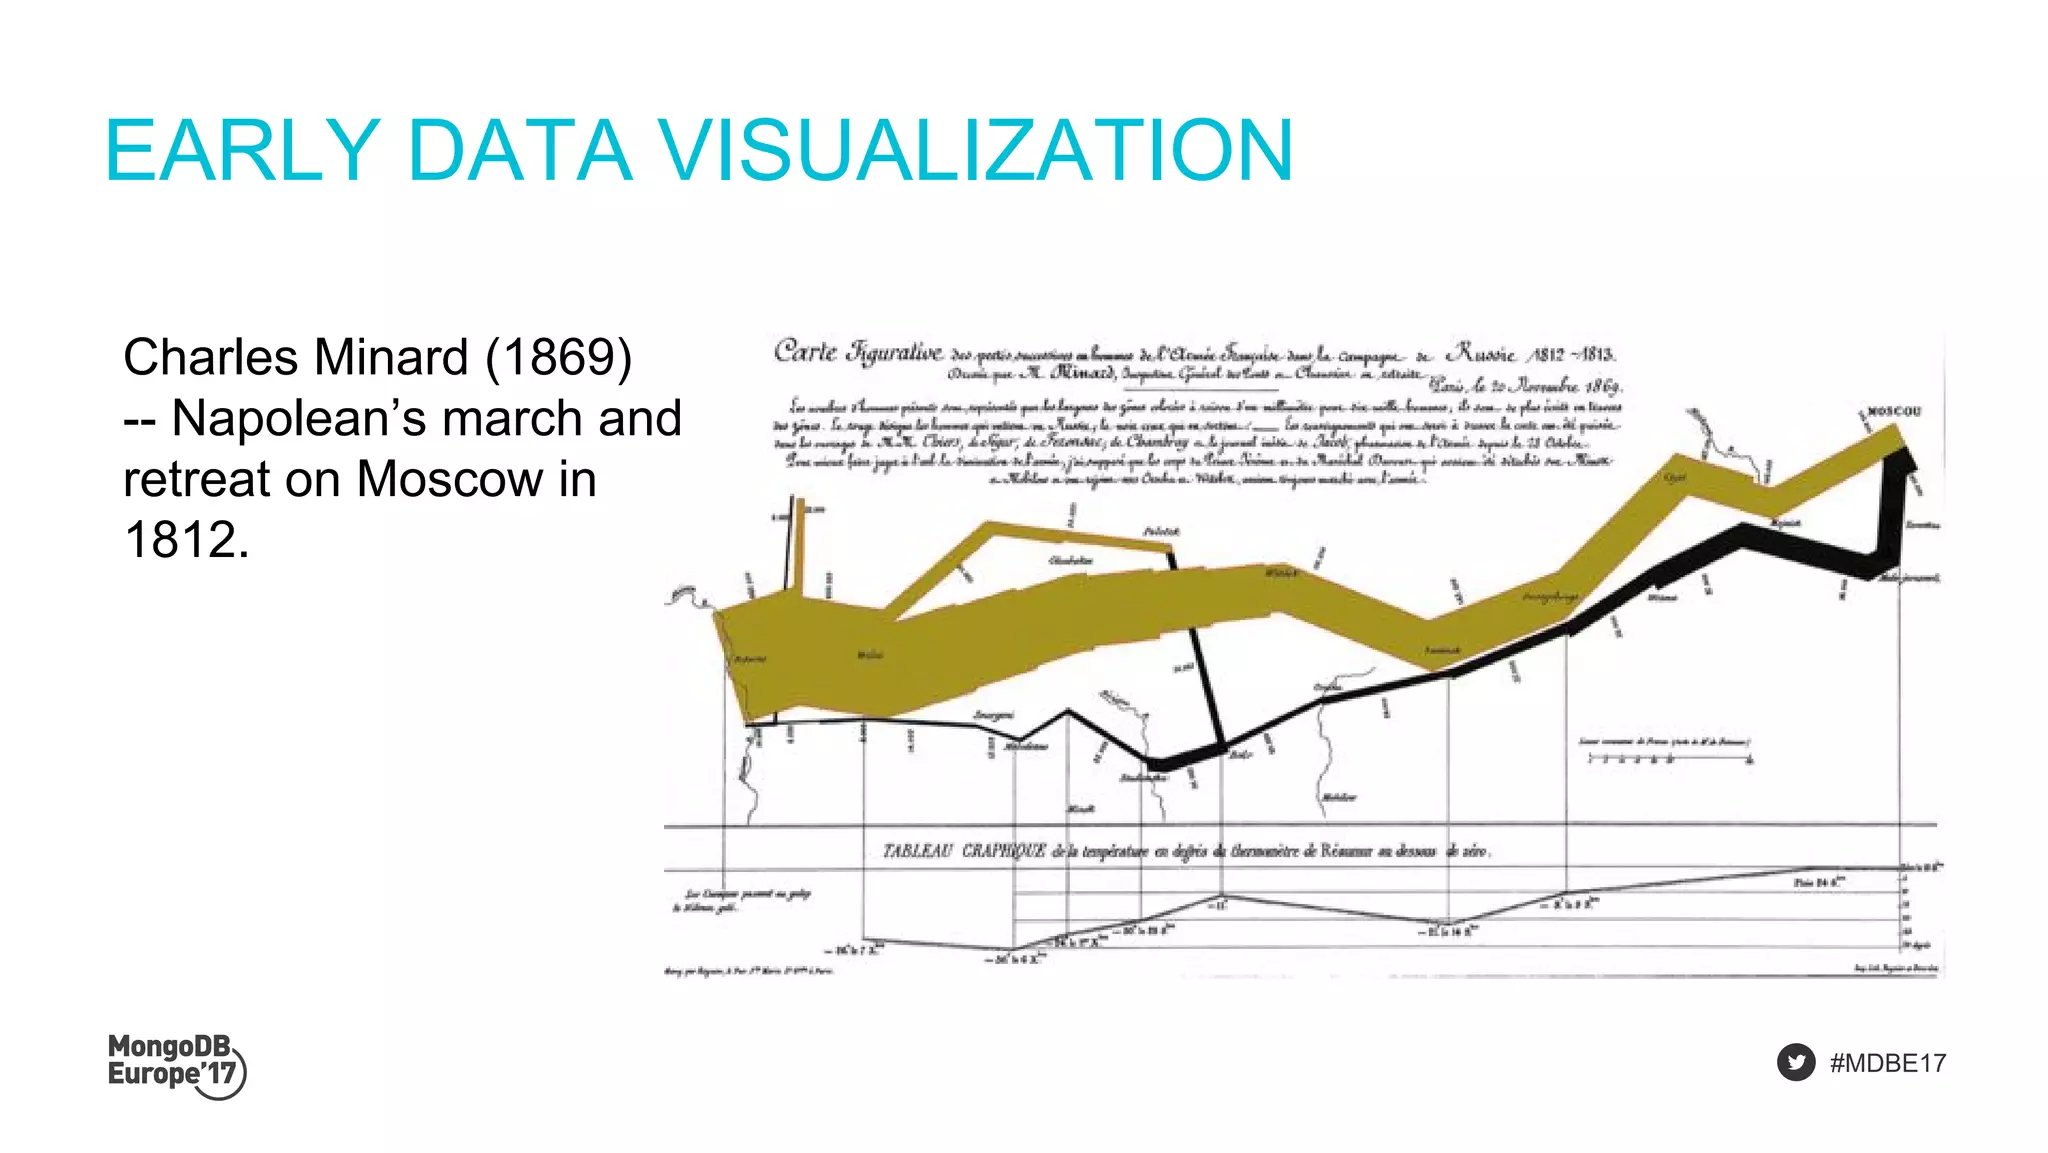
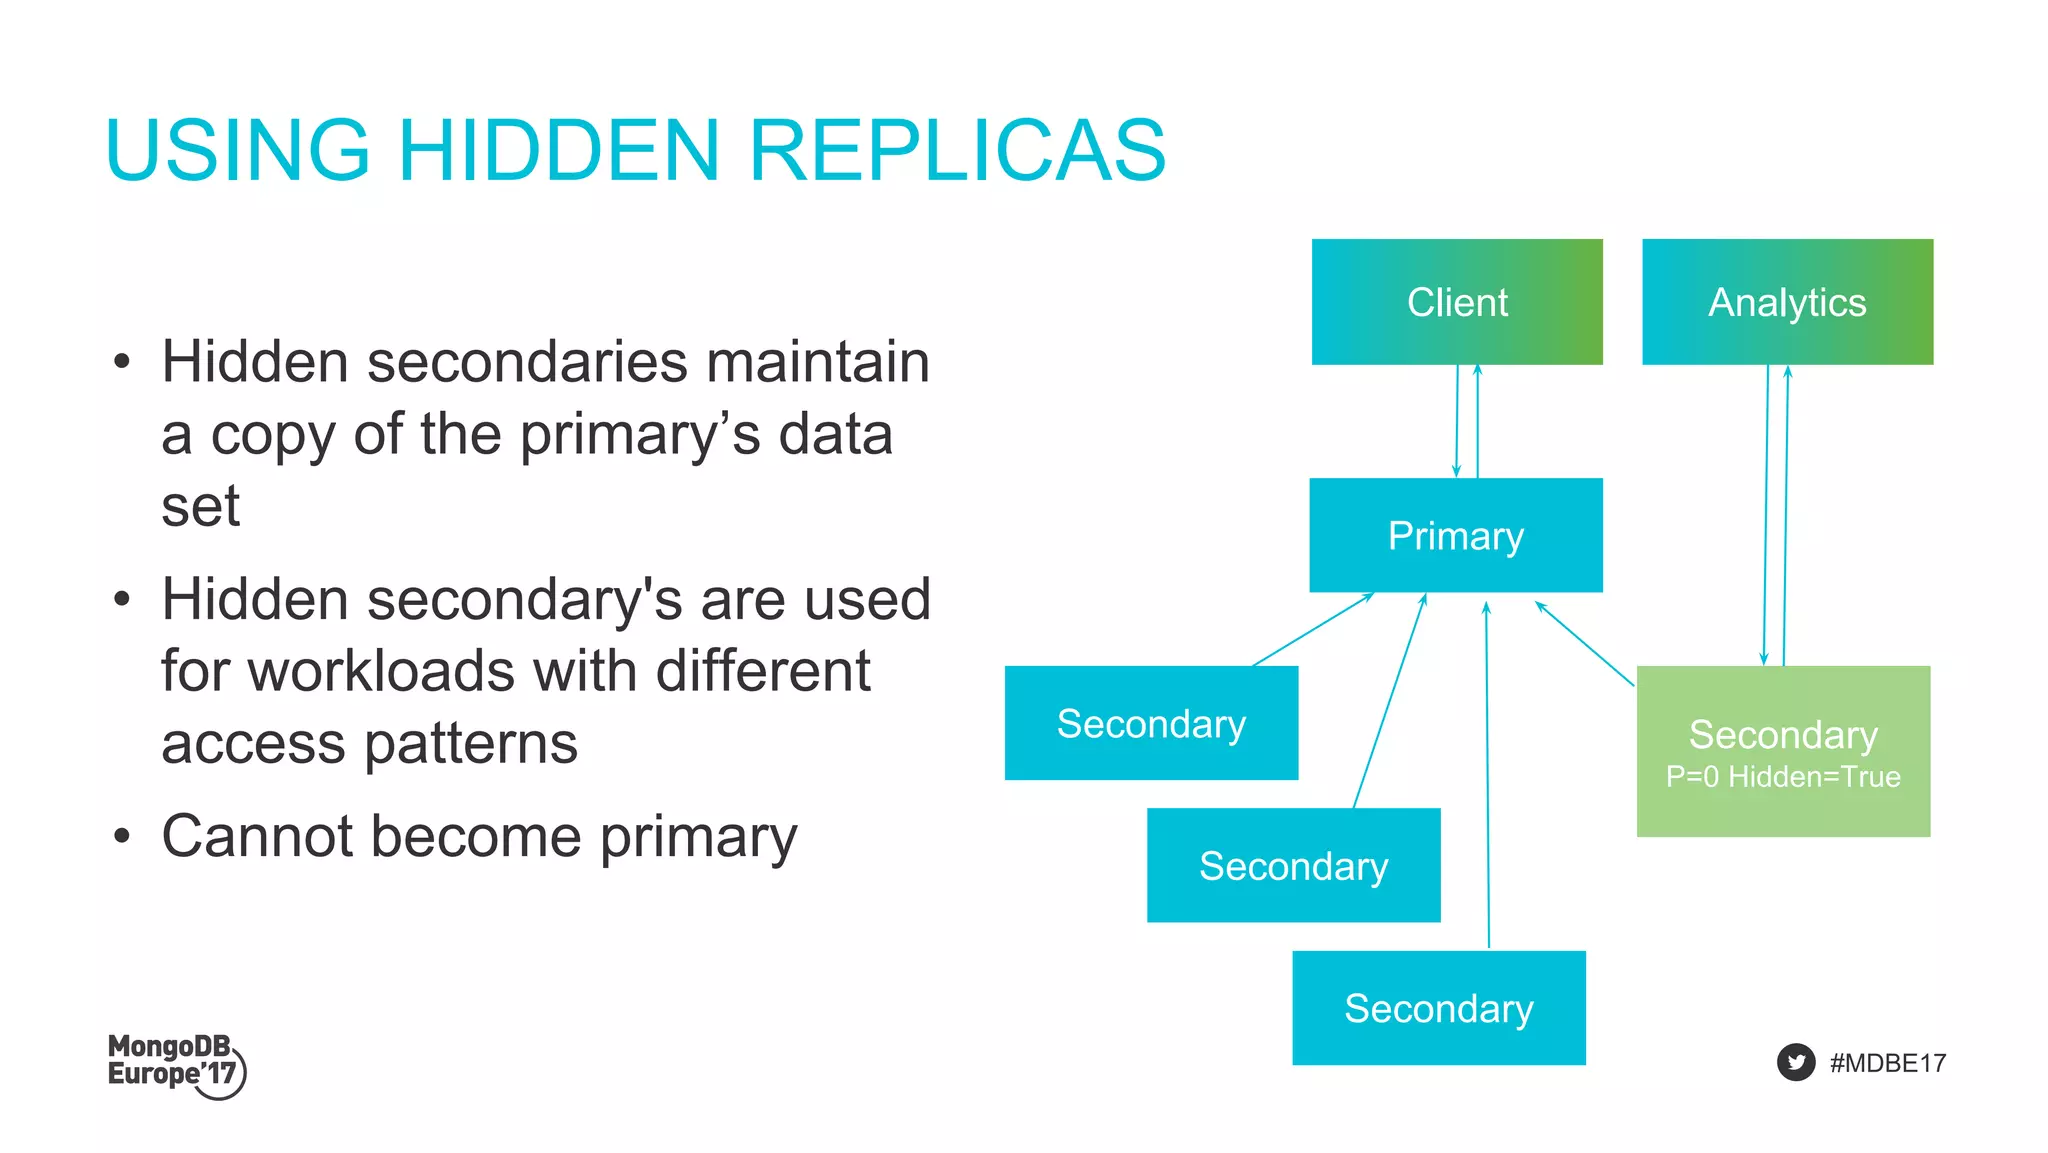
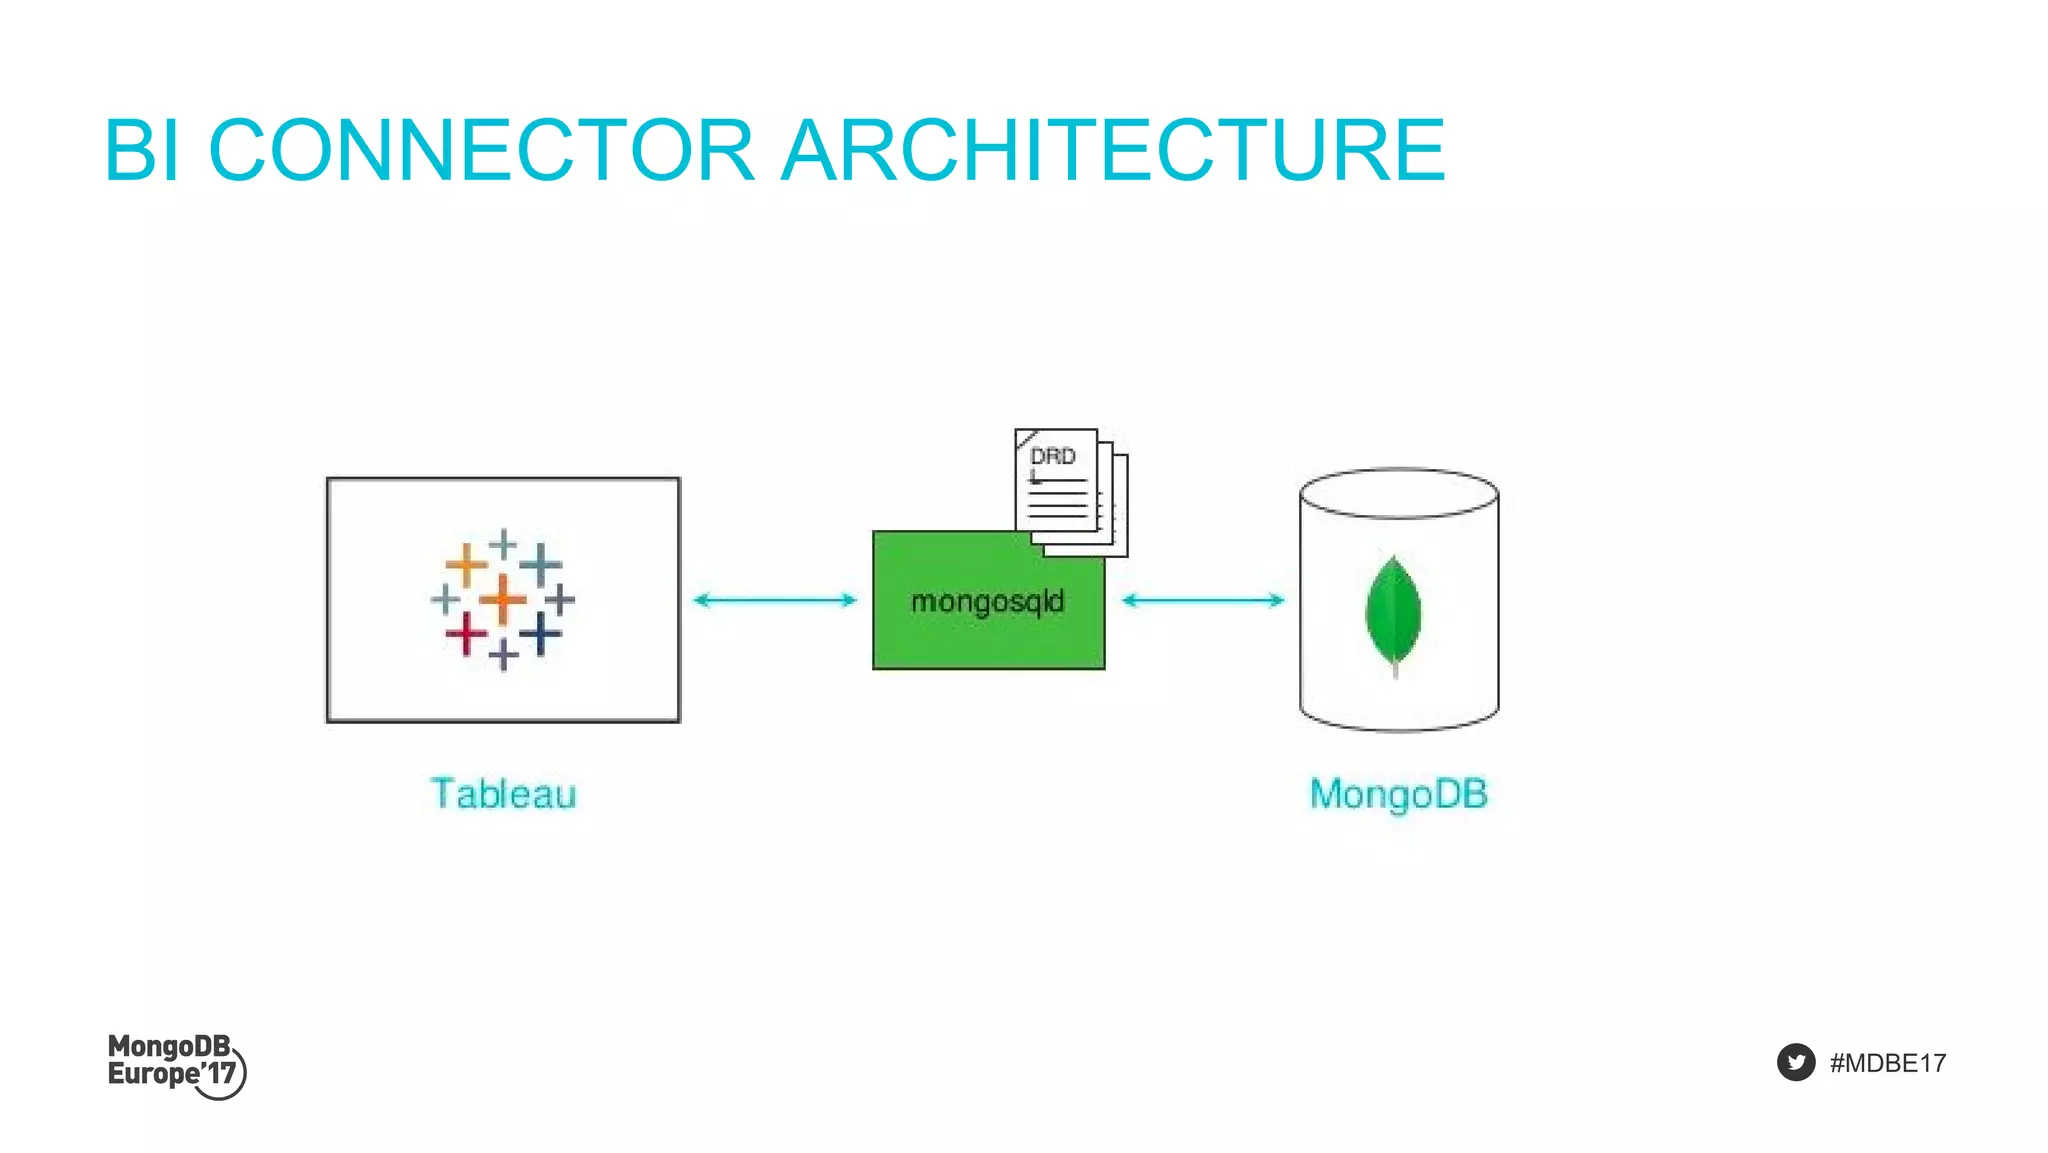
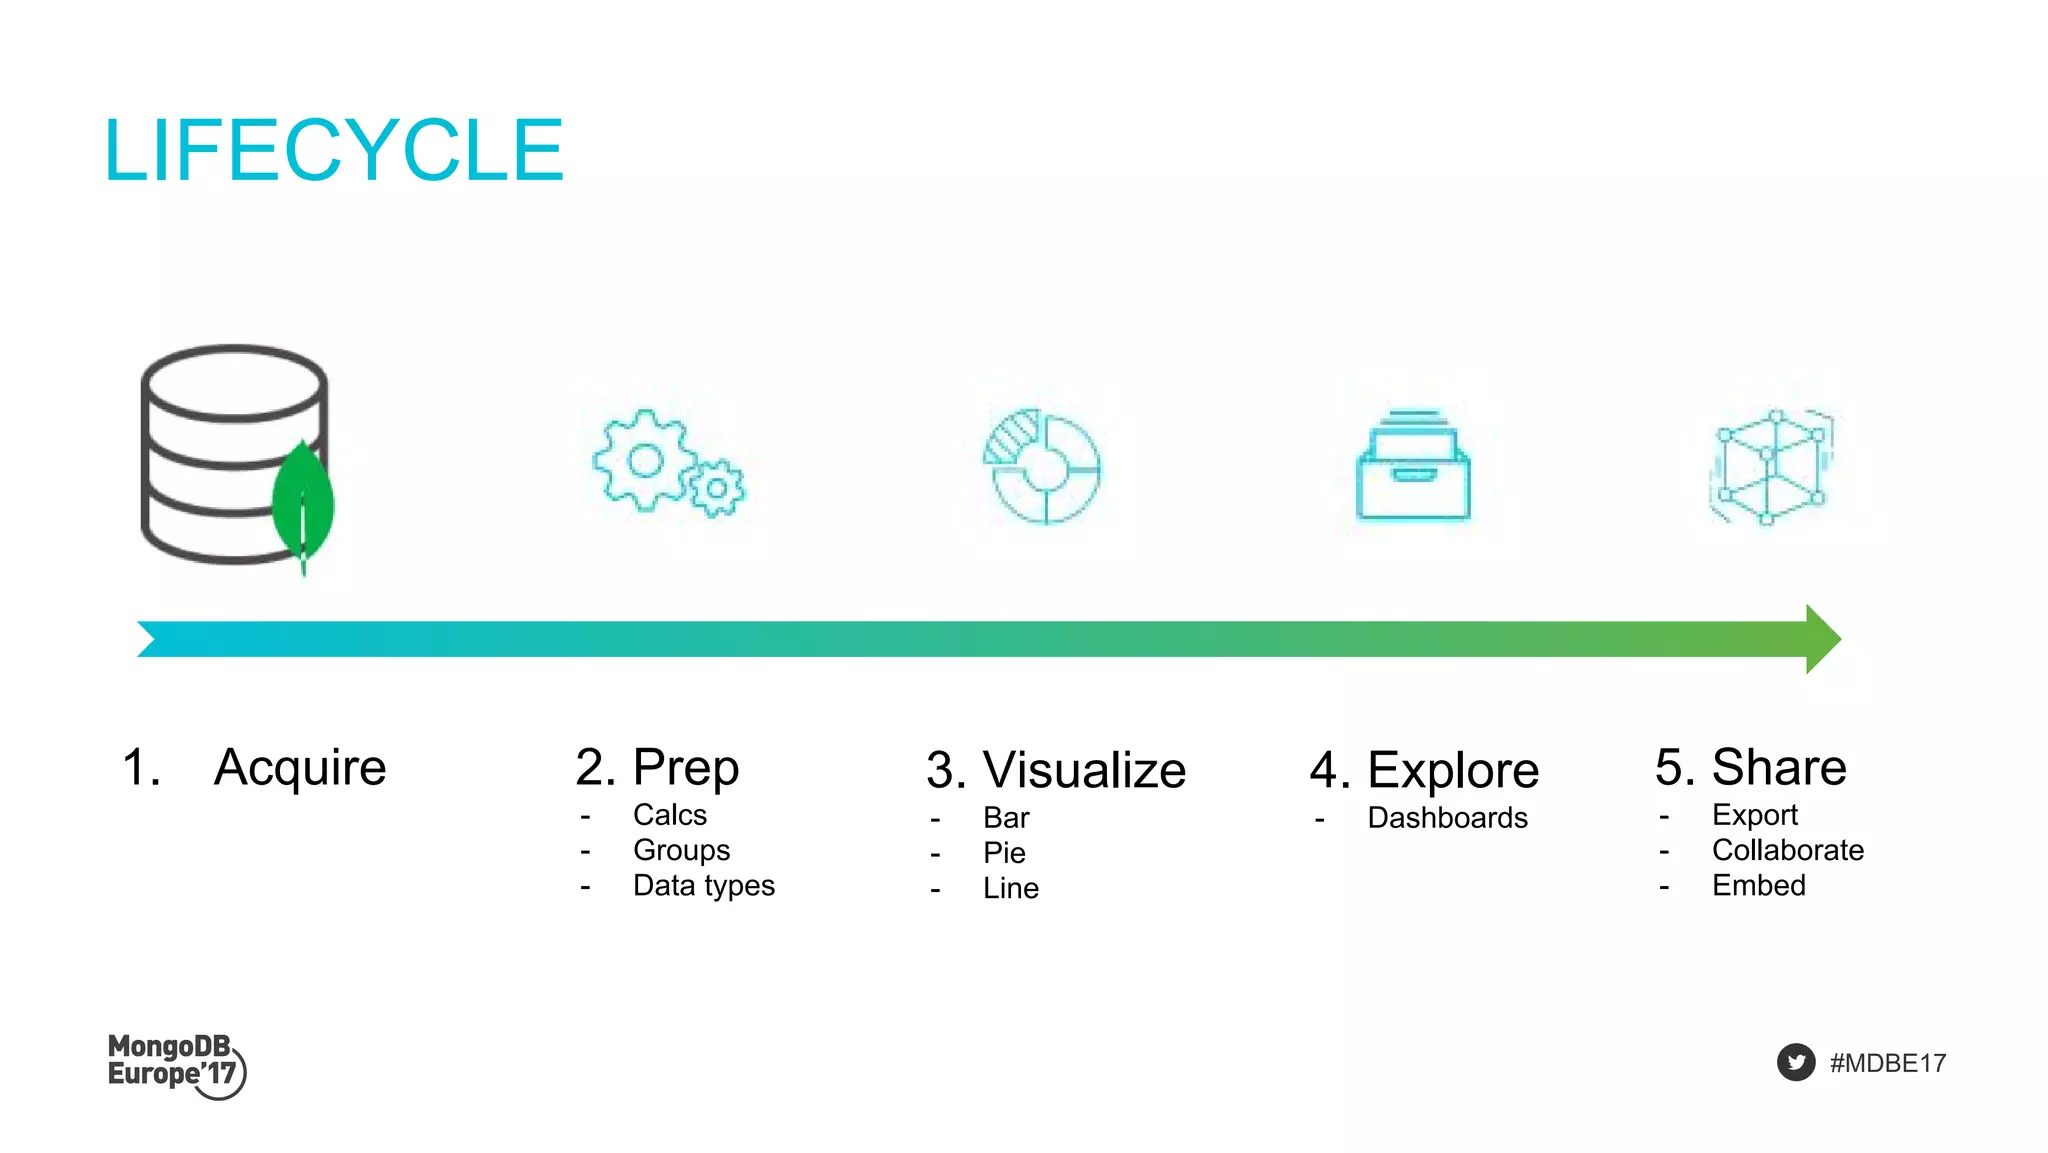
#MDBE17
Sam Weaver, MongoDB Product Manager
TPT: UNDERSTANDING YOUR
MONGODB DATA
#samuel_weaver
#MDBE17
SAM WEAVER
Product Manager
#MDBE17
AGENDA
Background
The importance of data visualization
How do we visualize data in MongoDB (+demo’s)
Q&A
01
02
03
04
WHERE ARE WE
NOW?
#MDBE17
TERMINOLOGY
“Business
Intelligence” “Business
Analytics”
Data
visualization
ANALYTICS
#MDBE17
DATA GROWTH IS EXPLOSIVE
• More data created in the last 2 years
than entire previous history of the
human race
• By 2020:
‒ 1.7MB per person every second
#MDBE17
THE STATE OF THE ANALYTICS MARKET
• Analytics is big $!
• $130B in 2016
• $200B+ in 2020
• Less than 0.5% of data is analyzed
and used – imagine the potential!
#MDBE17
• Self service
• Mobile access
• Spark
• Real-time analytics
• On prem and cloud
• On demand reporting
EVOLUTION OF ANALYTICS
2017
Today2015 20162014
• Dedicated reporting team
• Desktop access
• Hadoop
• Batch analytics
• On prem only
• Monthly reports
THE IMPORTANCE
OF DATA VIZ
#MDBE17
#MDBE17
EARLY DATA VISUALIZATION
Charles Minard (1869)
-- Napolean’s march and
retreat on Moscow in
1812.
I
X Y
10 8.04
8 6.95
13 7.58
9 8.81
11 8.33
14 9.96
6 7.24
4 4.26
12 10.84
7 4.82
5 5.68
9.00 7.50
10.00 3.75
0.816
I
X Y
10 8.04
8 6.95
13 7.58
9 8.81
11 8.33
14 9.96
6 7.24
4 4.26
12 10.84
7 4.82
5 5.68
9.00 7.50
10.00 3.75
0.816
I
X Y
10 8.04
8 6.95
13 7.58
9 8.81
11 8.33
14 9.96
6 7.24
4 4.26
12 10.84
7 4.82
5 5.68
9.00 7.50
10.00 3.75
0.816
II III IV
X Y X Y X Y
10 9.14 10 7.46 8 6.58
8 8.14 8 6.77 8 5.76
13 8.74 13 12.74 8 7.71
9 8.77 9 7.11 8 8.84
11 9.26 11 7.81 8 8.47
14 8.1 14 8.84 8 7.04
6 6.13 6 6.08 8 5.25
4 3.1 4 5.39 19 12.5
12 9.13 12 8.15 8 5.56
7 7.26 7 6.42 8 7.91
5 4.74 5 5.73 8 6.89
9.00 7.50 9.00 7.50 9.00 7.50Mean
10.00 3.75 10.00 3.75 10.00 3.75Variance (Population)
0.816 0.816 0.817 Correlation (Pearson)
SO YOU WANT TO
VISUALIZE?
#MDBE17
THING’S TO THINK ABOUT
• Use the correct architecture
• Determine what your needs are
‒ Multiple data sources?
‒ Huge amounts of complex data?
‒ Quick self service?
• Choose the right solution for you
ARCHITECTURE
FOR ANALYTICS
#MDBE17
USING HIDDEN REPLICAS
• Hidden secondaries maintain
a copy of the primary’s data
set
• Hidden secondary's are used
for workloads with different
access patterns
• Cannot become primary
Client
Primary
Secondary
Secondary
Secondary
Secondary
P=0 Hidden=True
Analytics
BUILD YOUR OWN
#MDBE17
BUILD YOUR OWN
• Pros
‒ Custom tailored solution: fits exactly as required!
• Cons
‒ High investment
‒ Maintenance
‒ Deep understanding of the underlying tech and its language(s)
MONGODB
COMPASS
#MDBE17
MONGODB COMPASS
• Developer tool
• Data management and manipulation
• Interesting schema analysis
• Used daily: a good first place to start
#MDBE17
WHEN TO USE?
• Day-to-day development/operations
• Adding indexes
• Viewing server stats
• Data manipulation
• 10,000->1ft view of data
BI CONNECTOR
#MDBE17
MONGODB BI CONNECTOR
• Visualize and explore MongoDB
data in SQL-based BI tools:
‒ Automatically discovers the
schema
‒ Translates complex SQL
statements issued by the BI tool
into MongoDB aggregation queries
‒ Converts the results into a tabular
format for rendering inside the BI
tool
#MDBE17
BI CONNECTOR ARCHITECTURE
#MDBE17
WHEN TO USE?
• Multi data sources (not just mongodb)
• Business analysts
• Extremely powerful but high ramp
MONGODB CHARTS
#MDBE17
MONGODB CHARTS
• Lightweight
• Intuitive
• Build visualizations on MongoDB data (nested, polymorphic)
• Share content in a dashboard
#MDBE17
WHEN TO USE?
• When you want quick answers
• No need to flatten / ETL your mongodb data
• Self service for the technical audience
#MDBE17
LIFECYCLE
1. Acquire 2. Prep
- Calcs
- Groups
- Data types
3. Visualize
- Bar
- Pie
- Line
4. Explore
- Dashboards
5. Share
- Export
- Collaborate
- Embed
DEMO
The Path to Truly Understanding your MongoDB Data

The Path to Truly Understanding your MongoDB Data