Download as PDF, PPTX


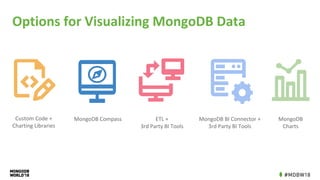
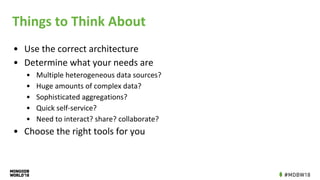


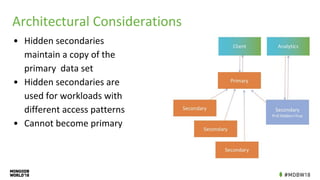


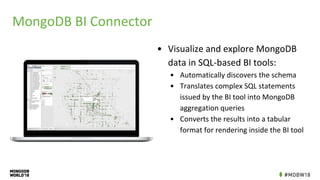
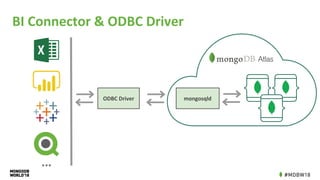
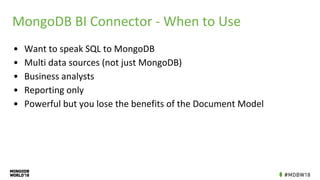


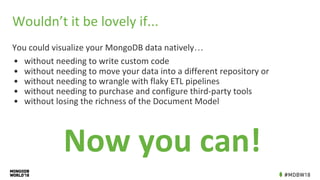
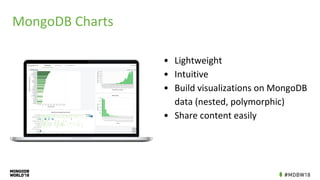
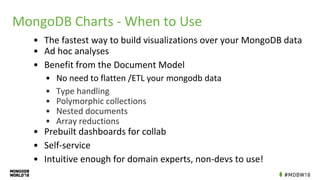
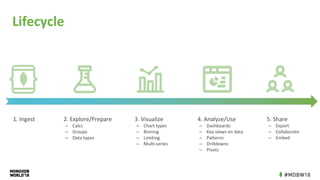


This document discusses options for visualizing data from MongoDB databases. It begins by outlining some architectural considerations for visualizing hidden secondary databases that maintain copies of primary data for different access patterns. It then discusses several options for visualizing MongoDB data, including building custom visualizations using code and charting libraries, using MongoDB's BI Connector to connect to third-party BI tools like Excel, and using MongoDB Compass or Charts for interactive data exploration and visualization without code. It provides advice on which tools are best suited for different use cases like exploratory analysis, self-service visualization, or complex reporting needs. The document concludes with recommendations to think about your specific architecture, needs, and tools that fit those needs.

![MongoDB .local San Francisco 2020: Powering the new age data demands [Infosys]](https://cdn.slidesharecdn.com/ss_thumbnails/315pminfosysfinalsfoversionvocalpart1-200120221508-thumbnail.jpg?width=640&height=640&fit=bounds)