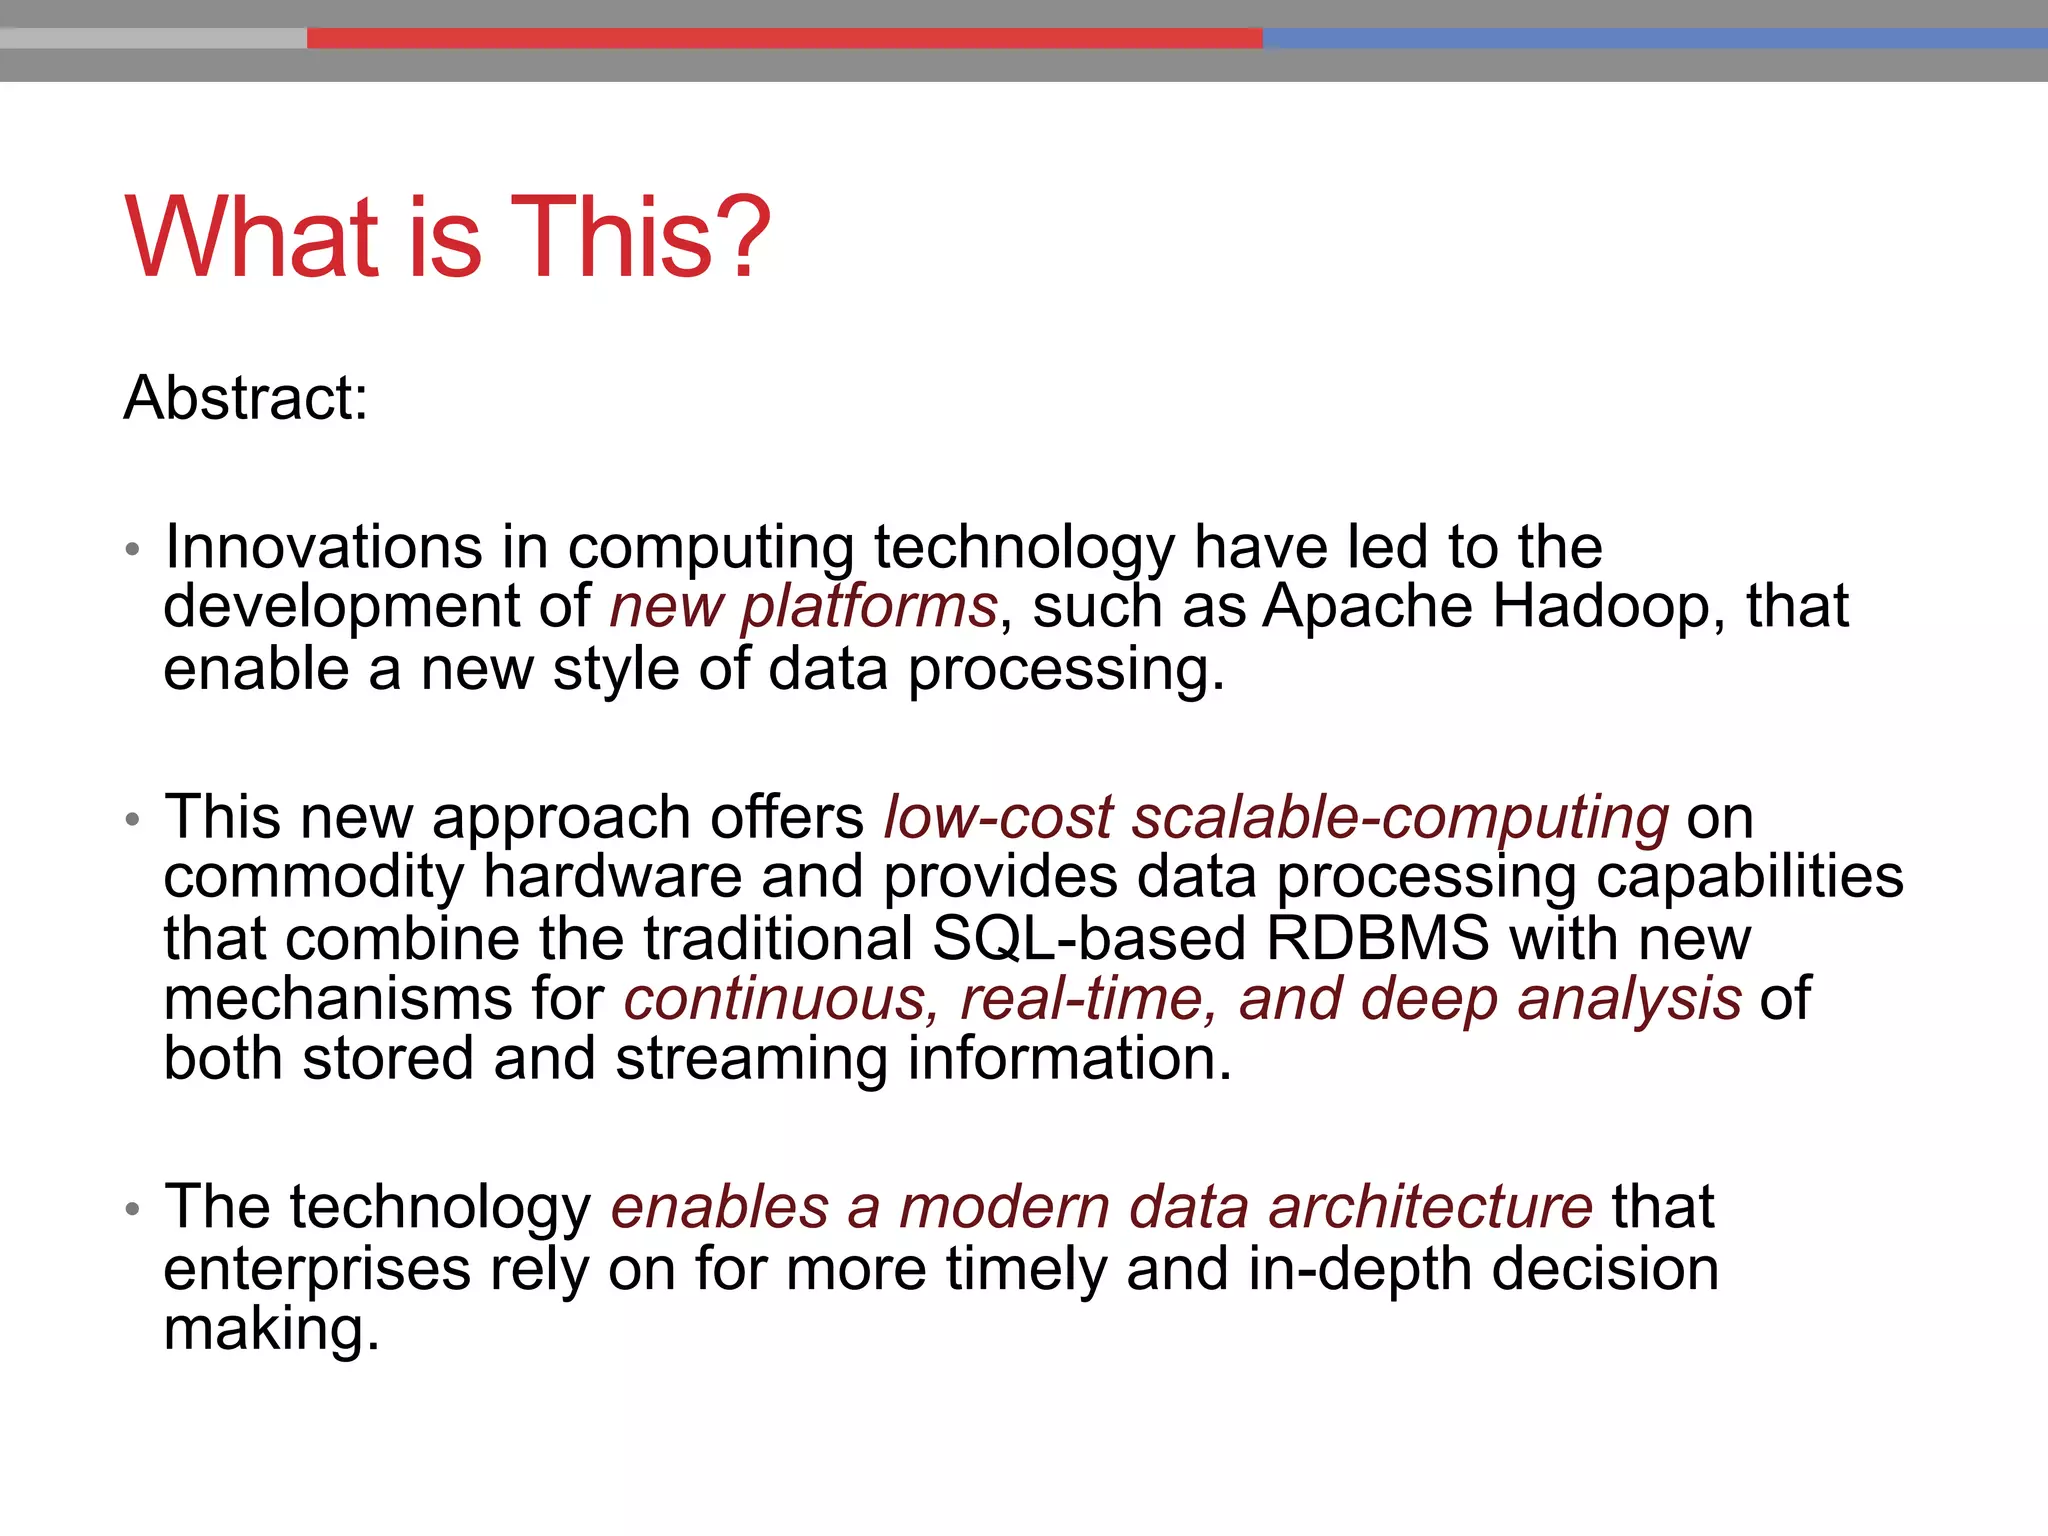
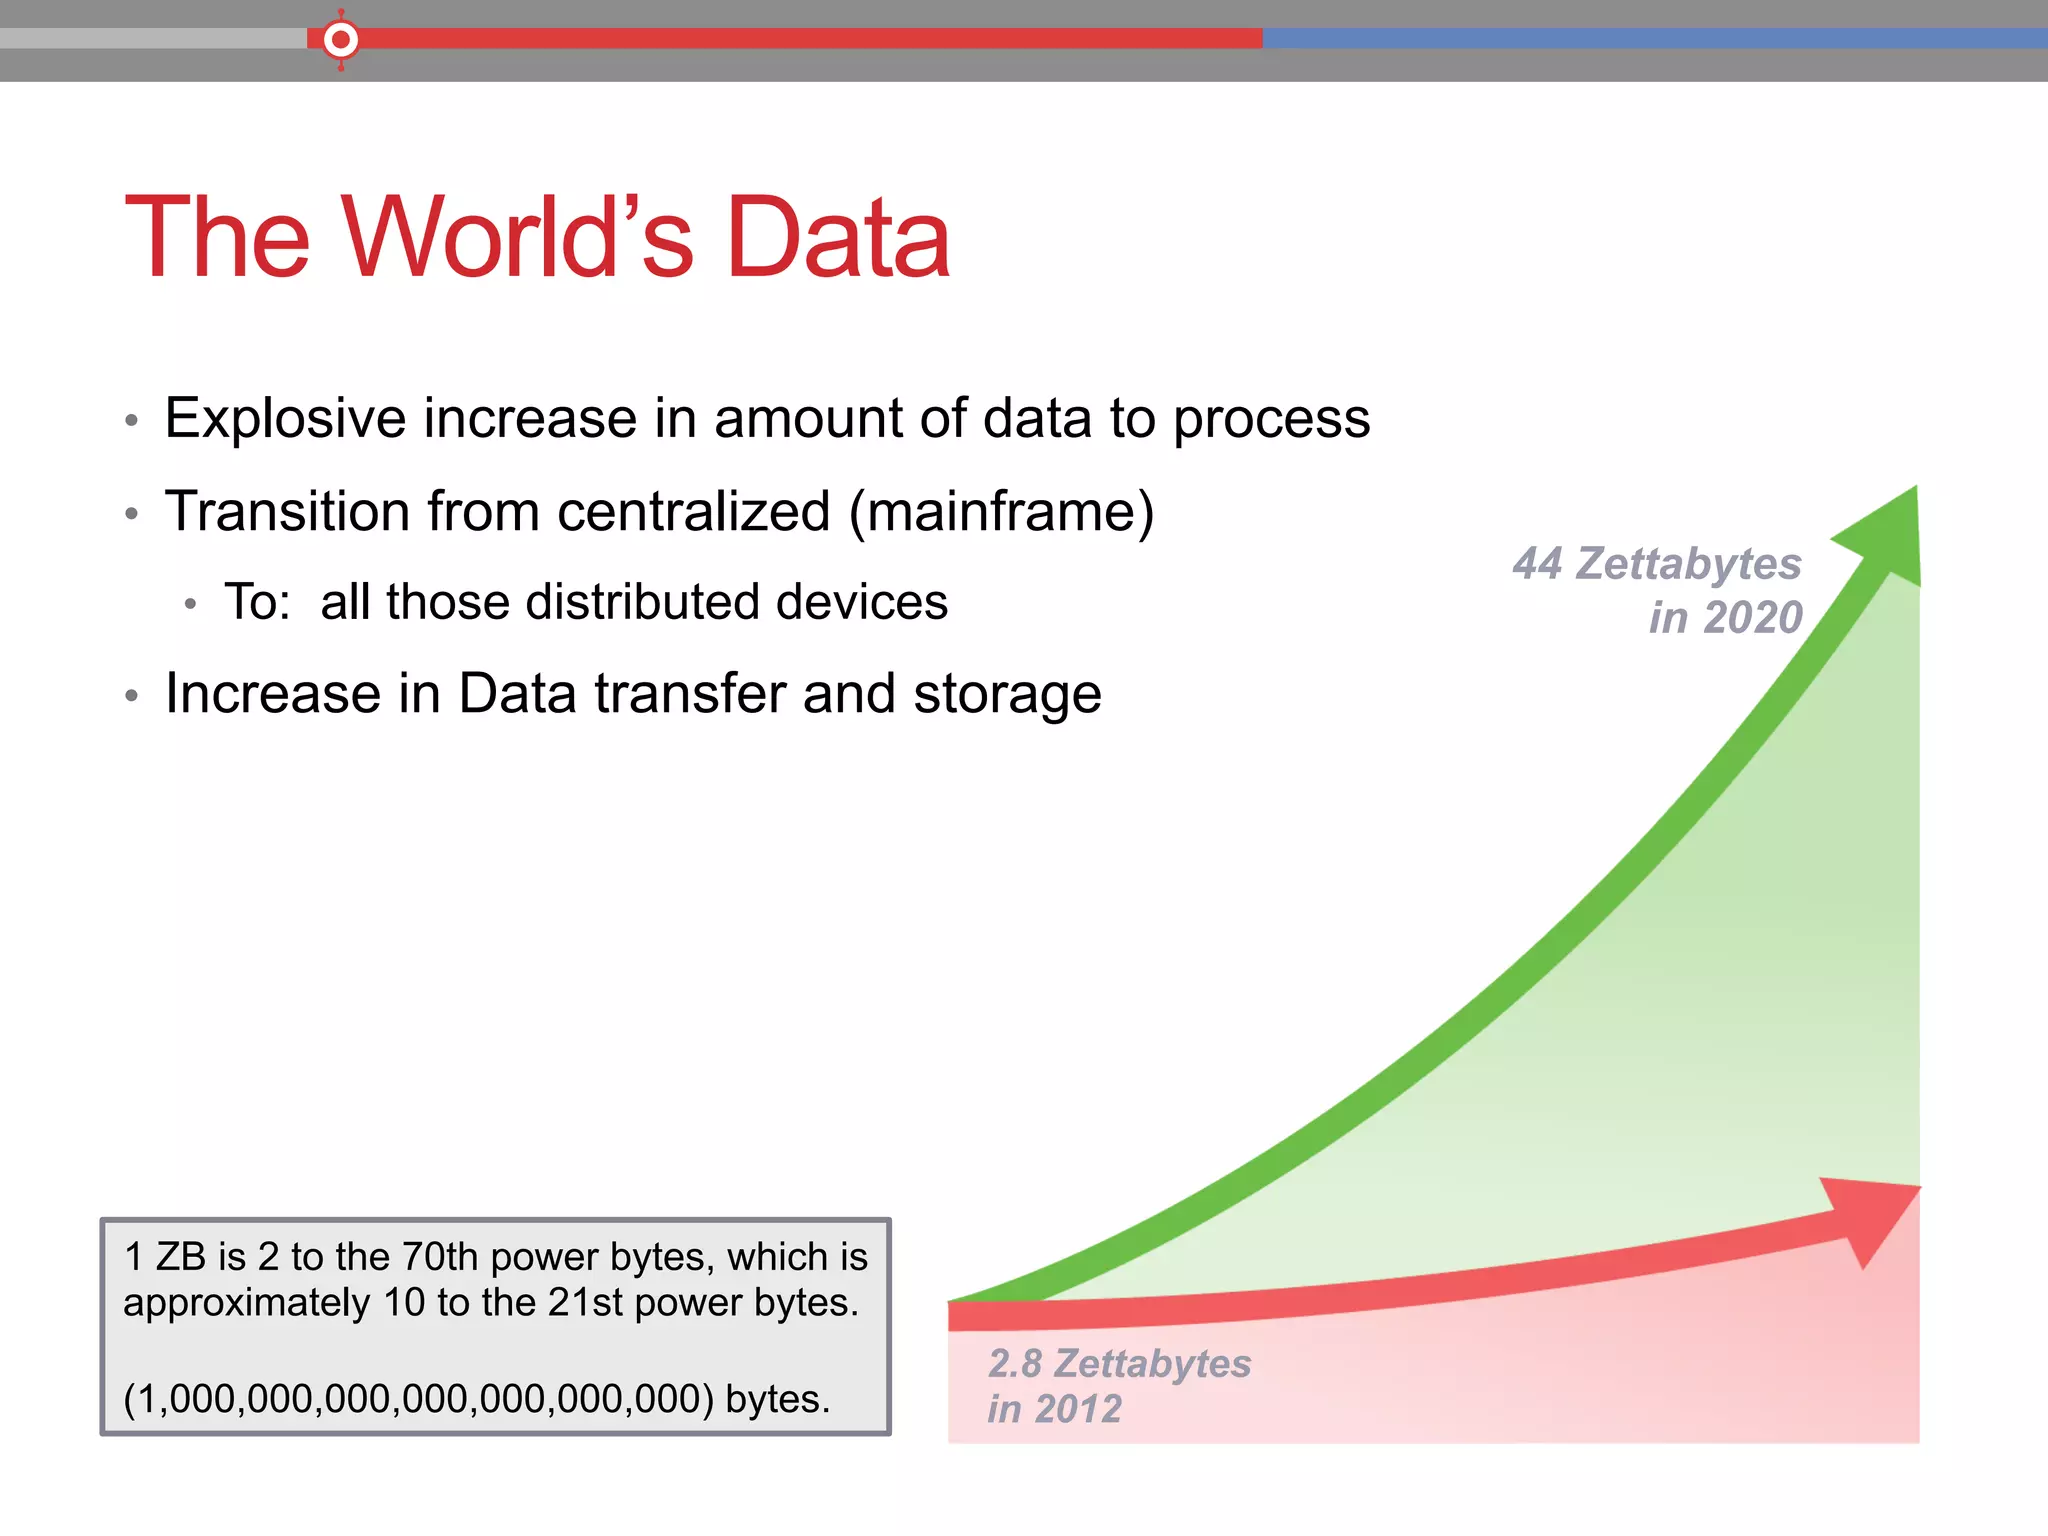
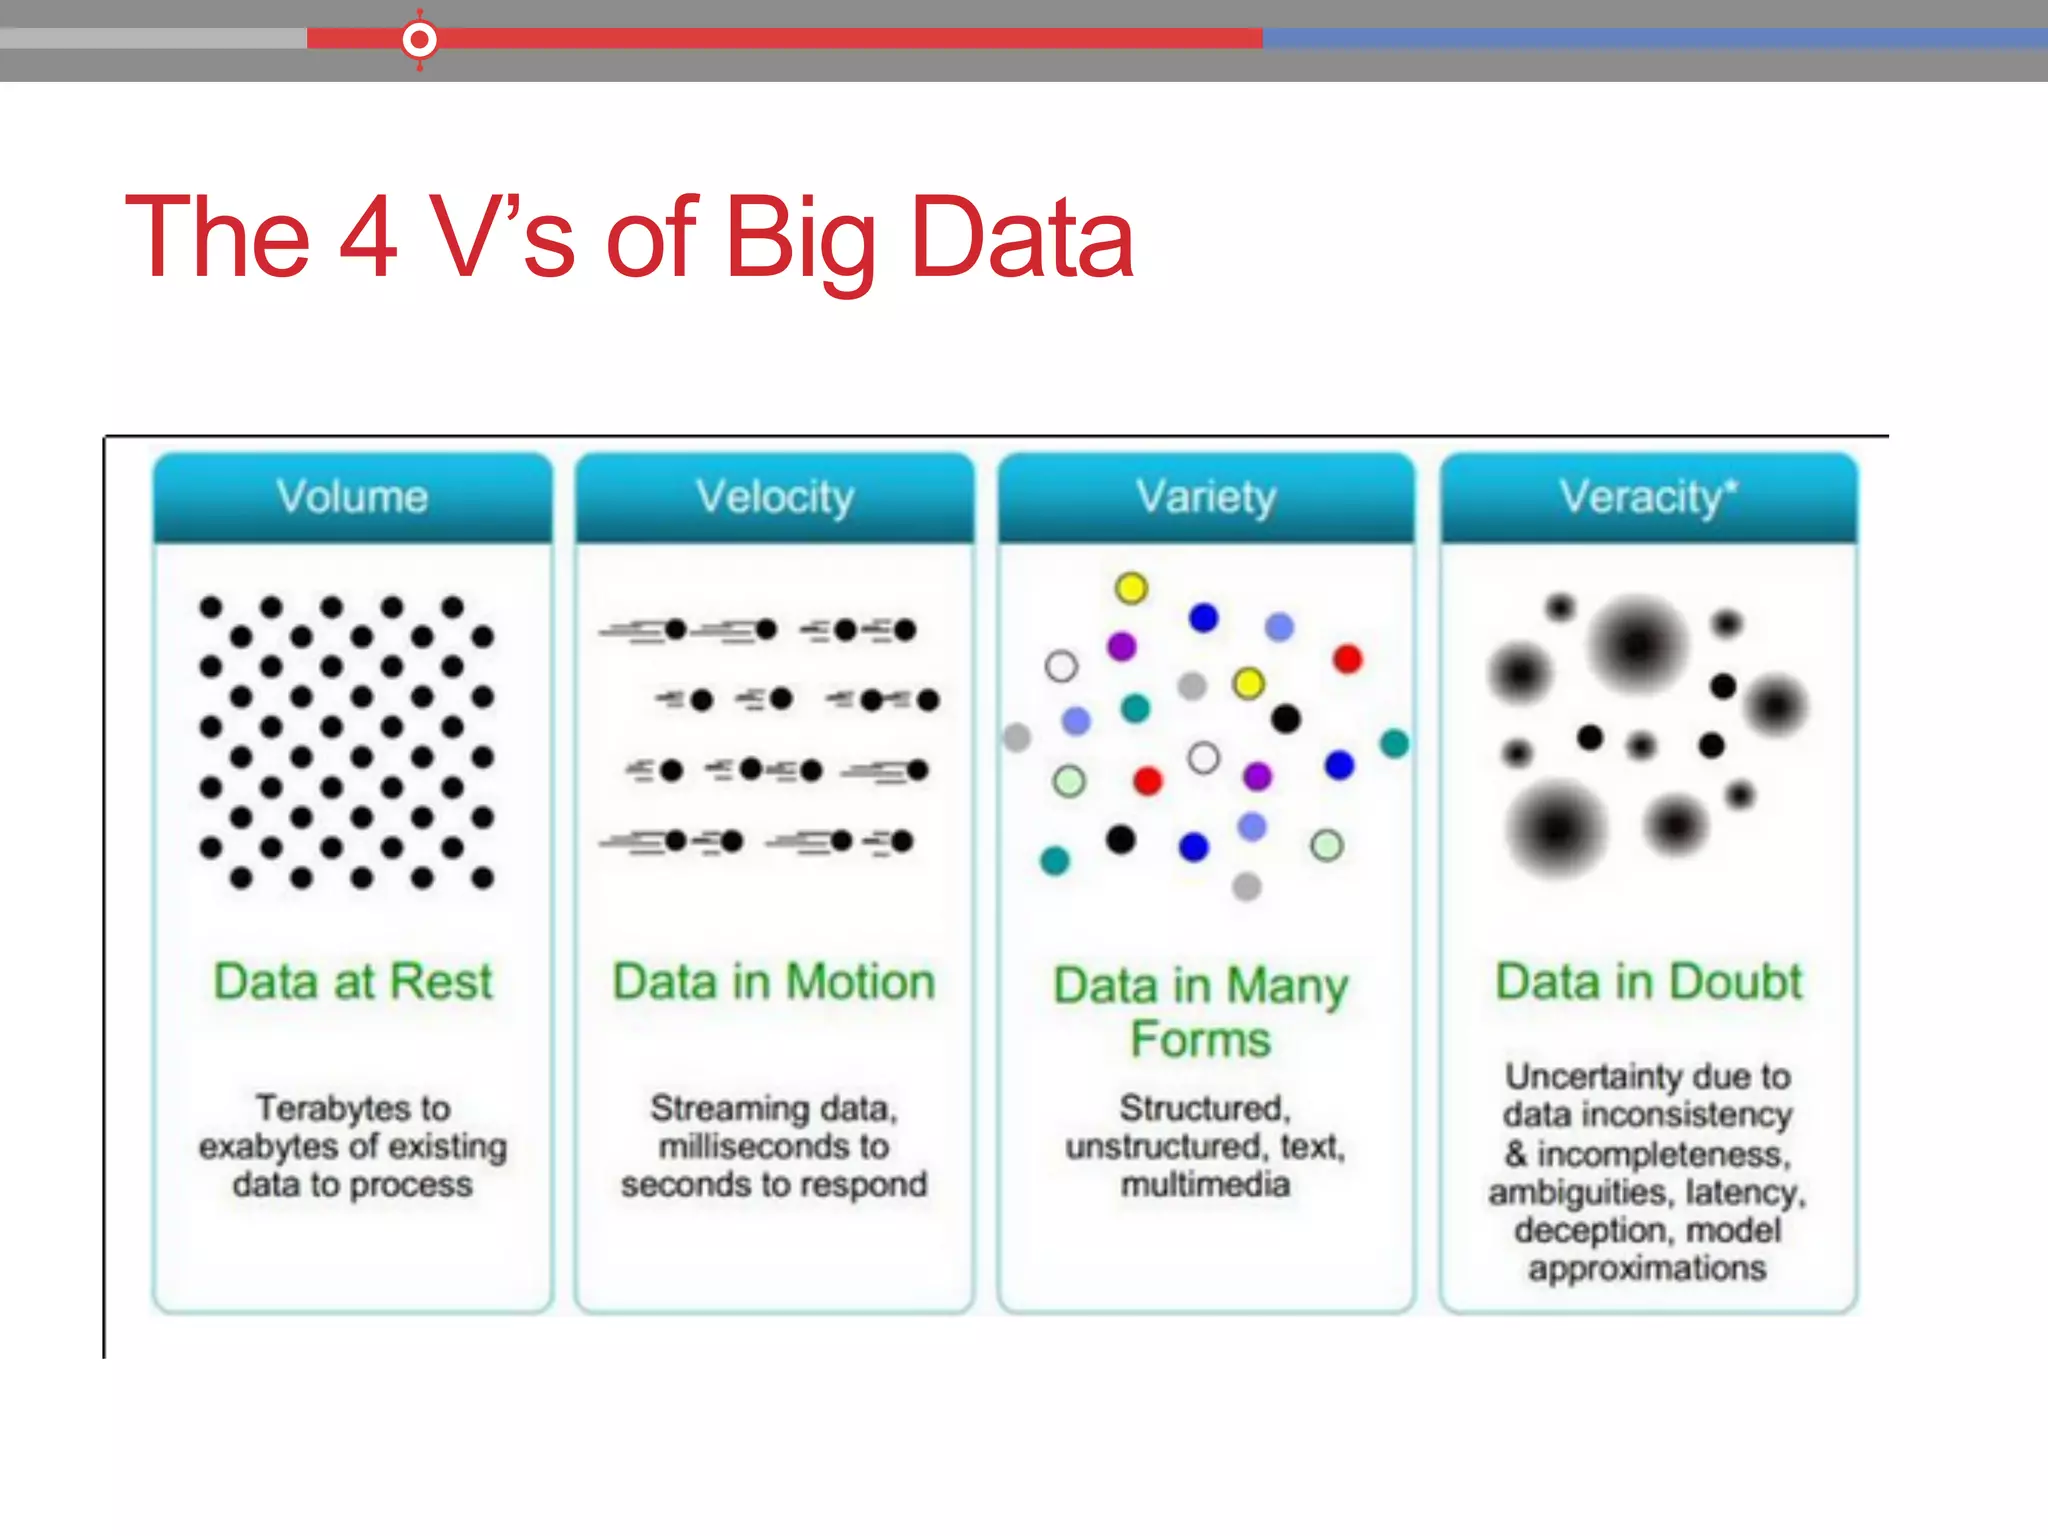
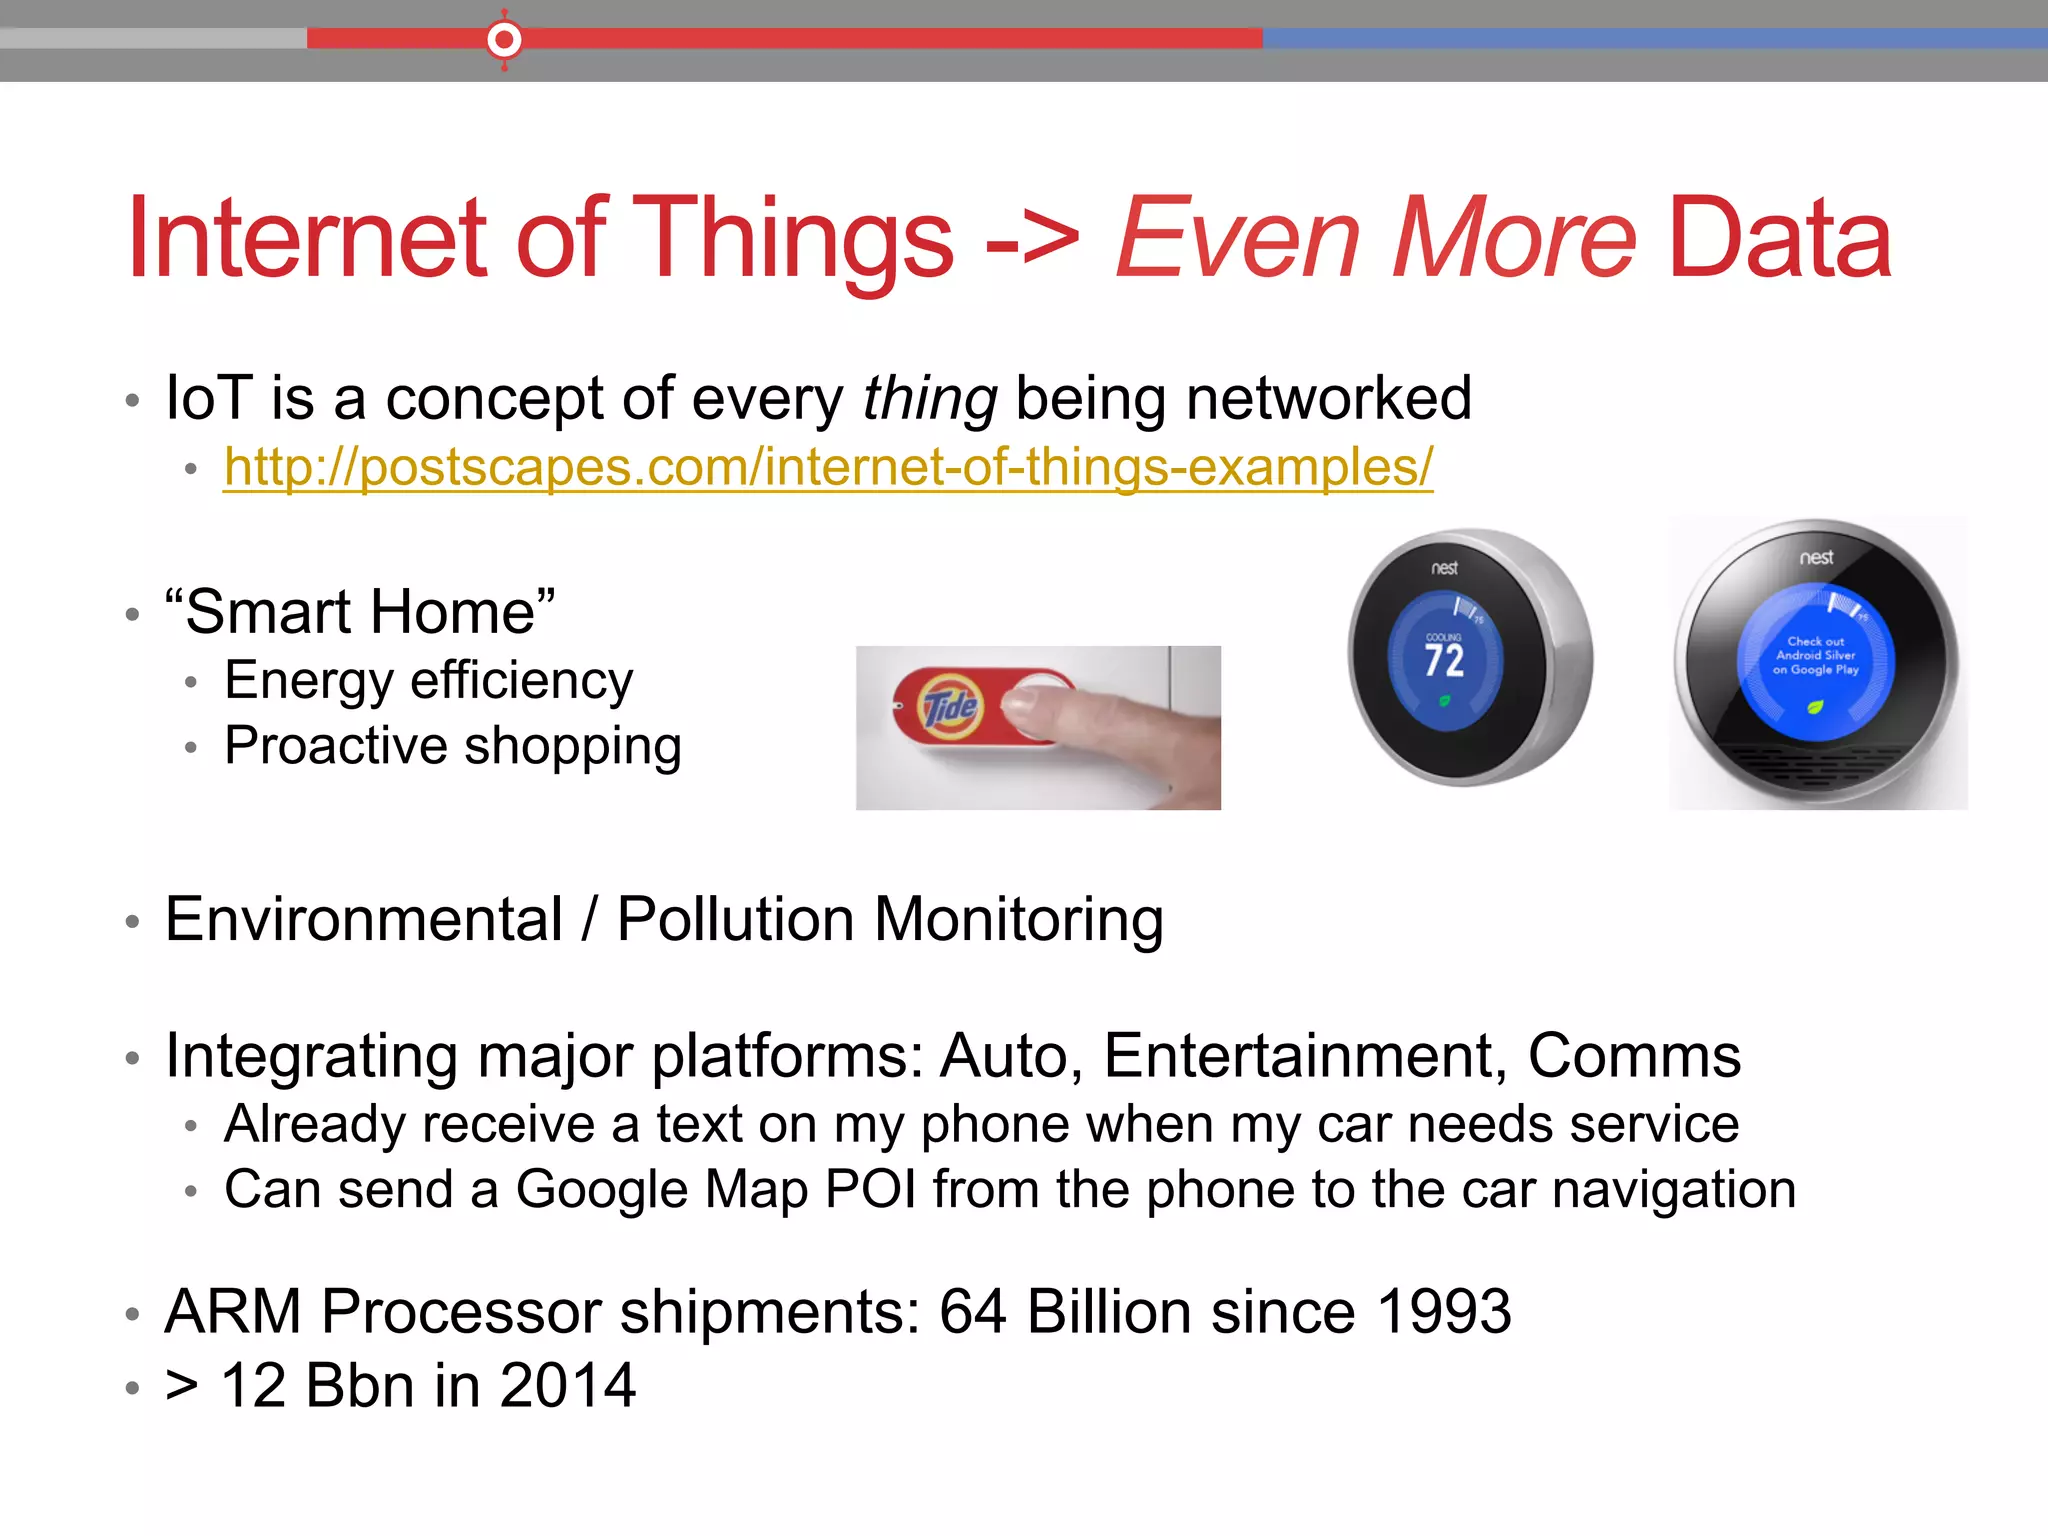
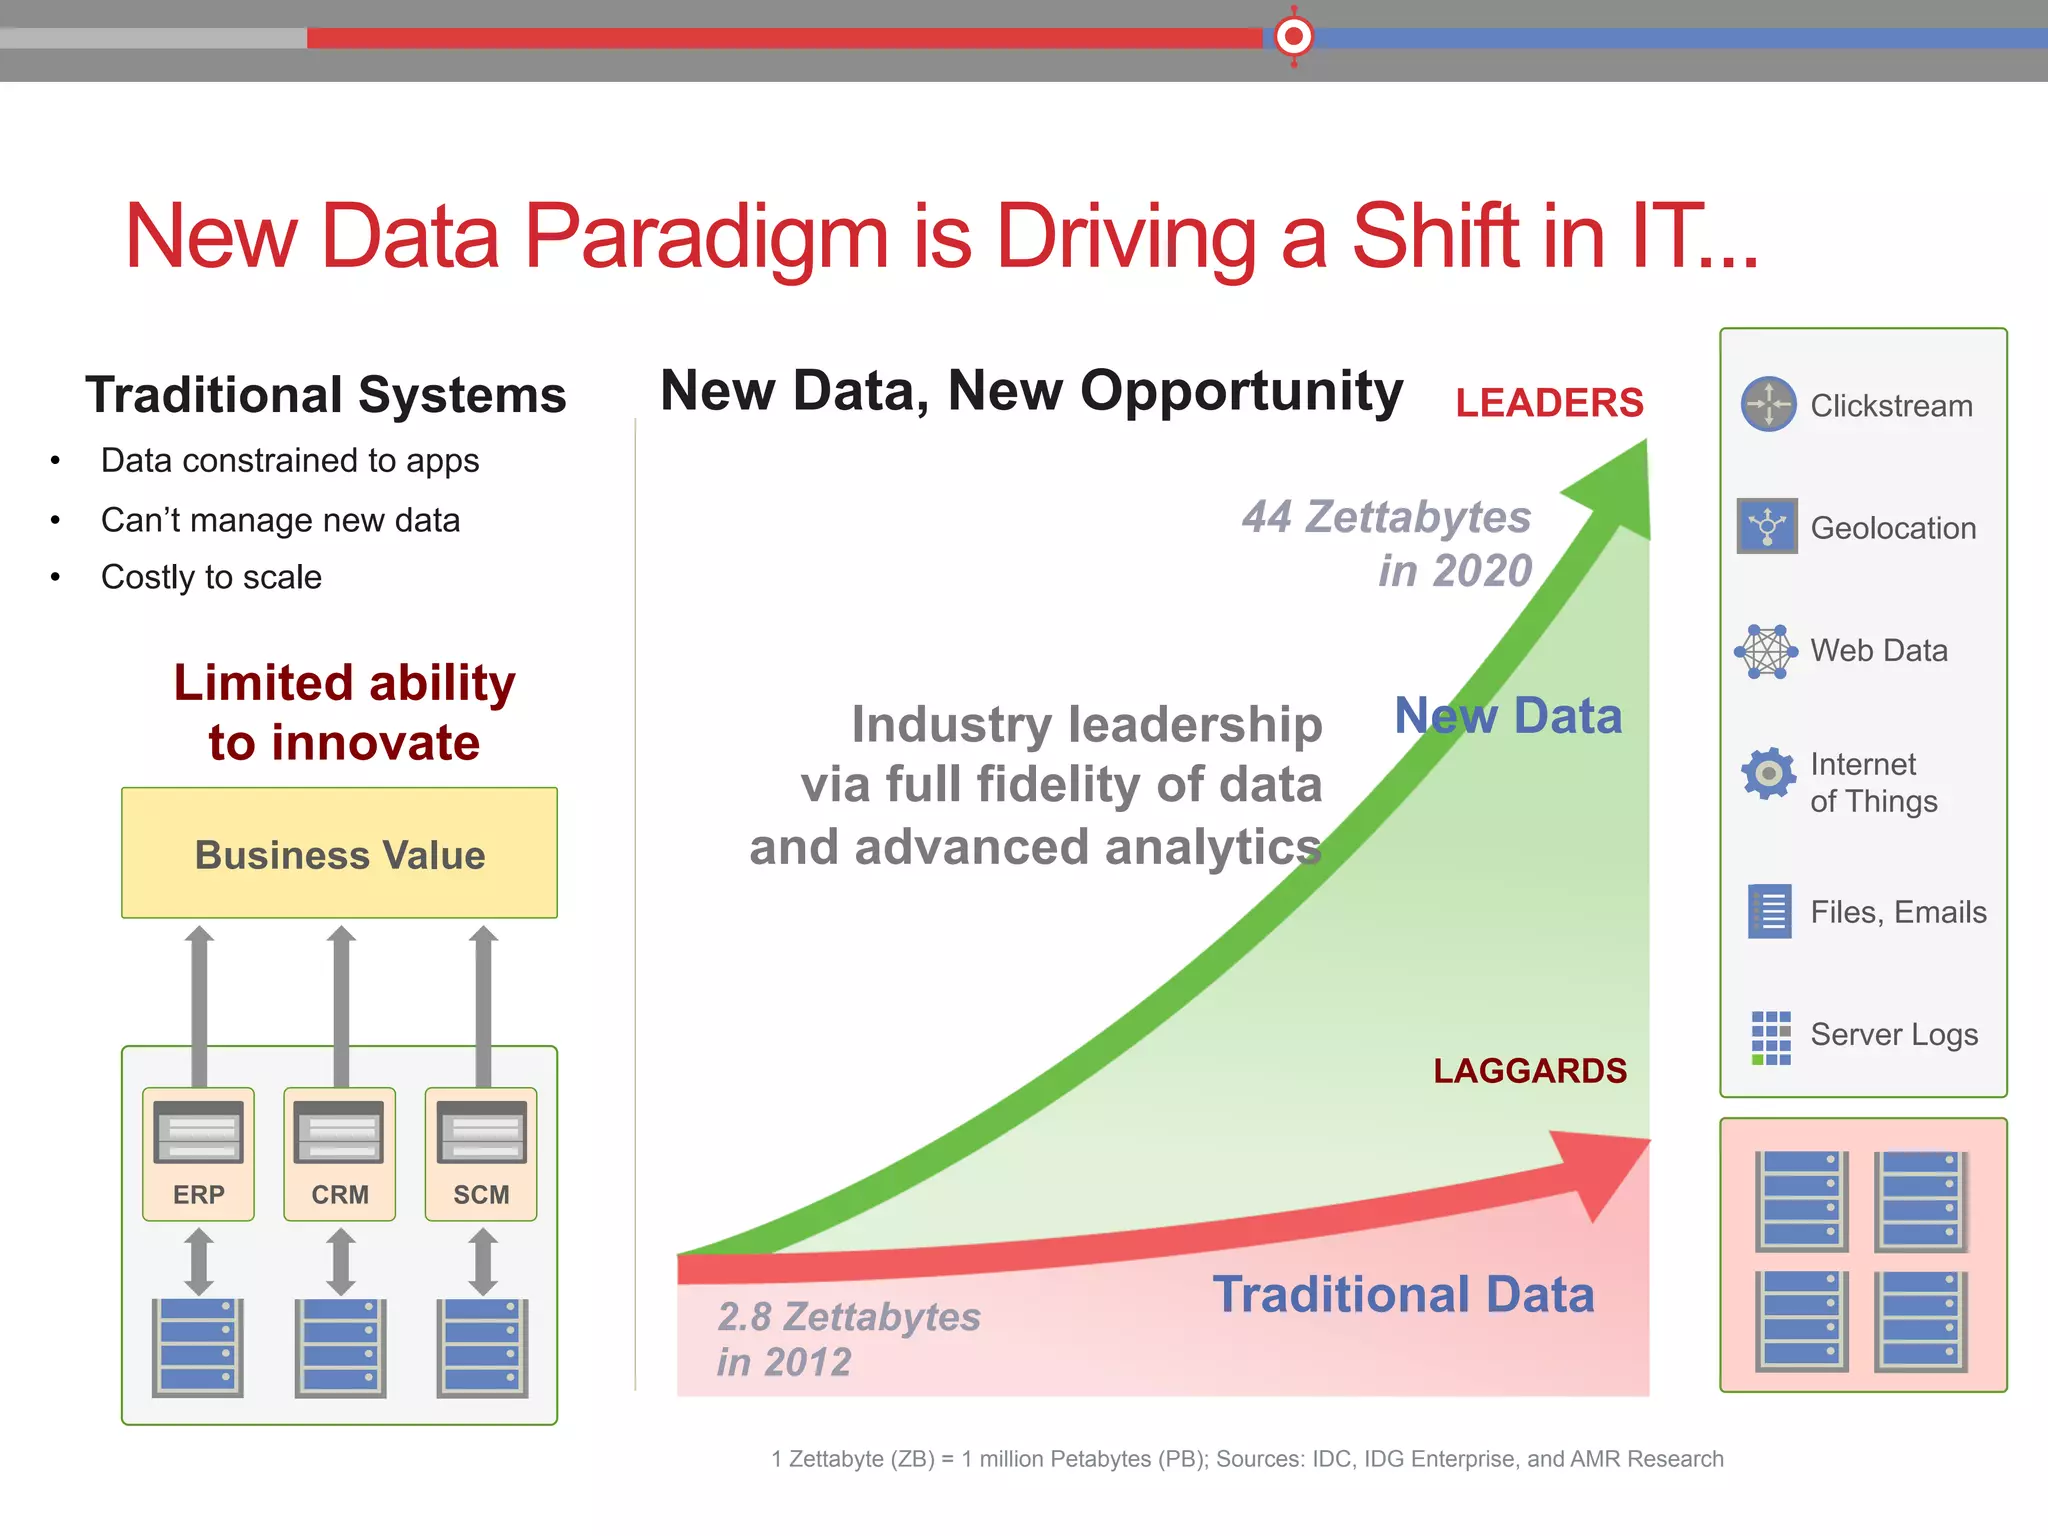
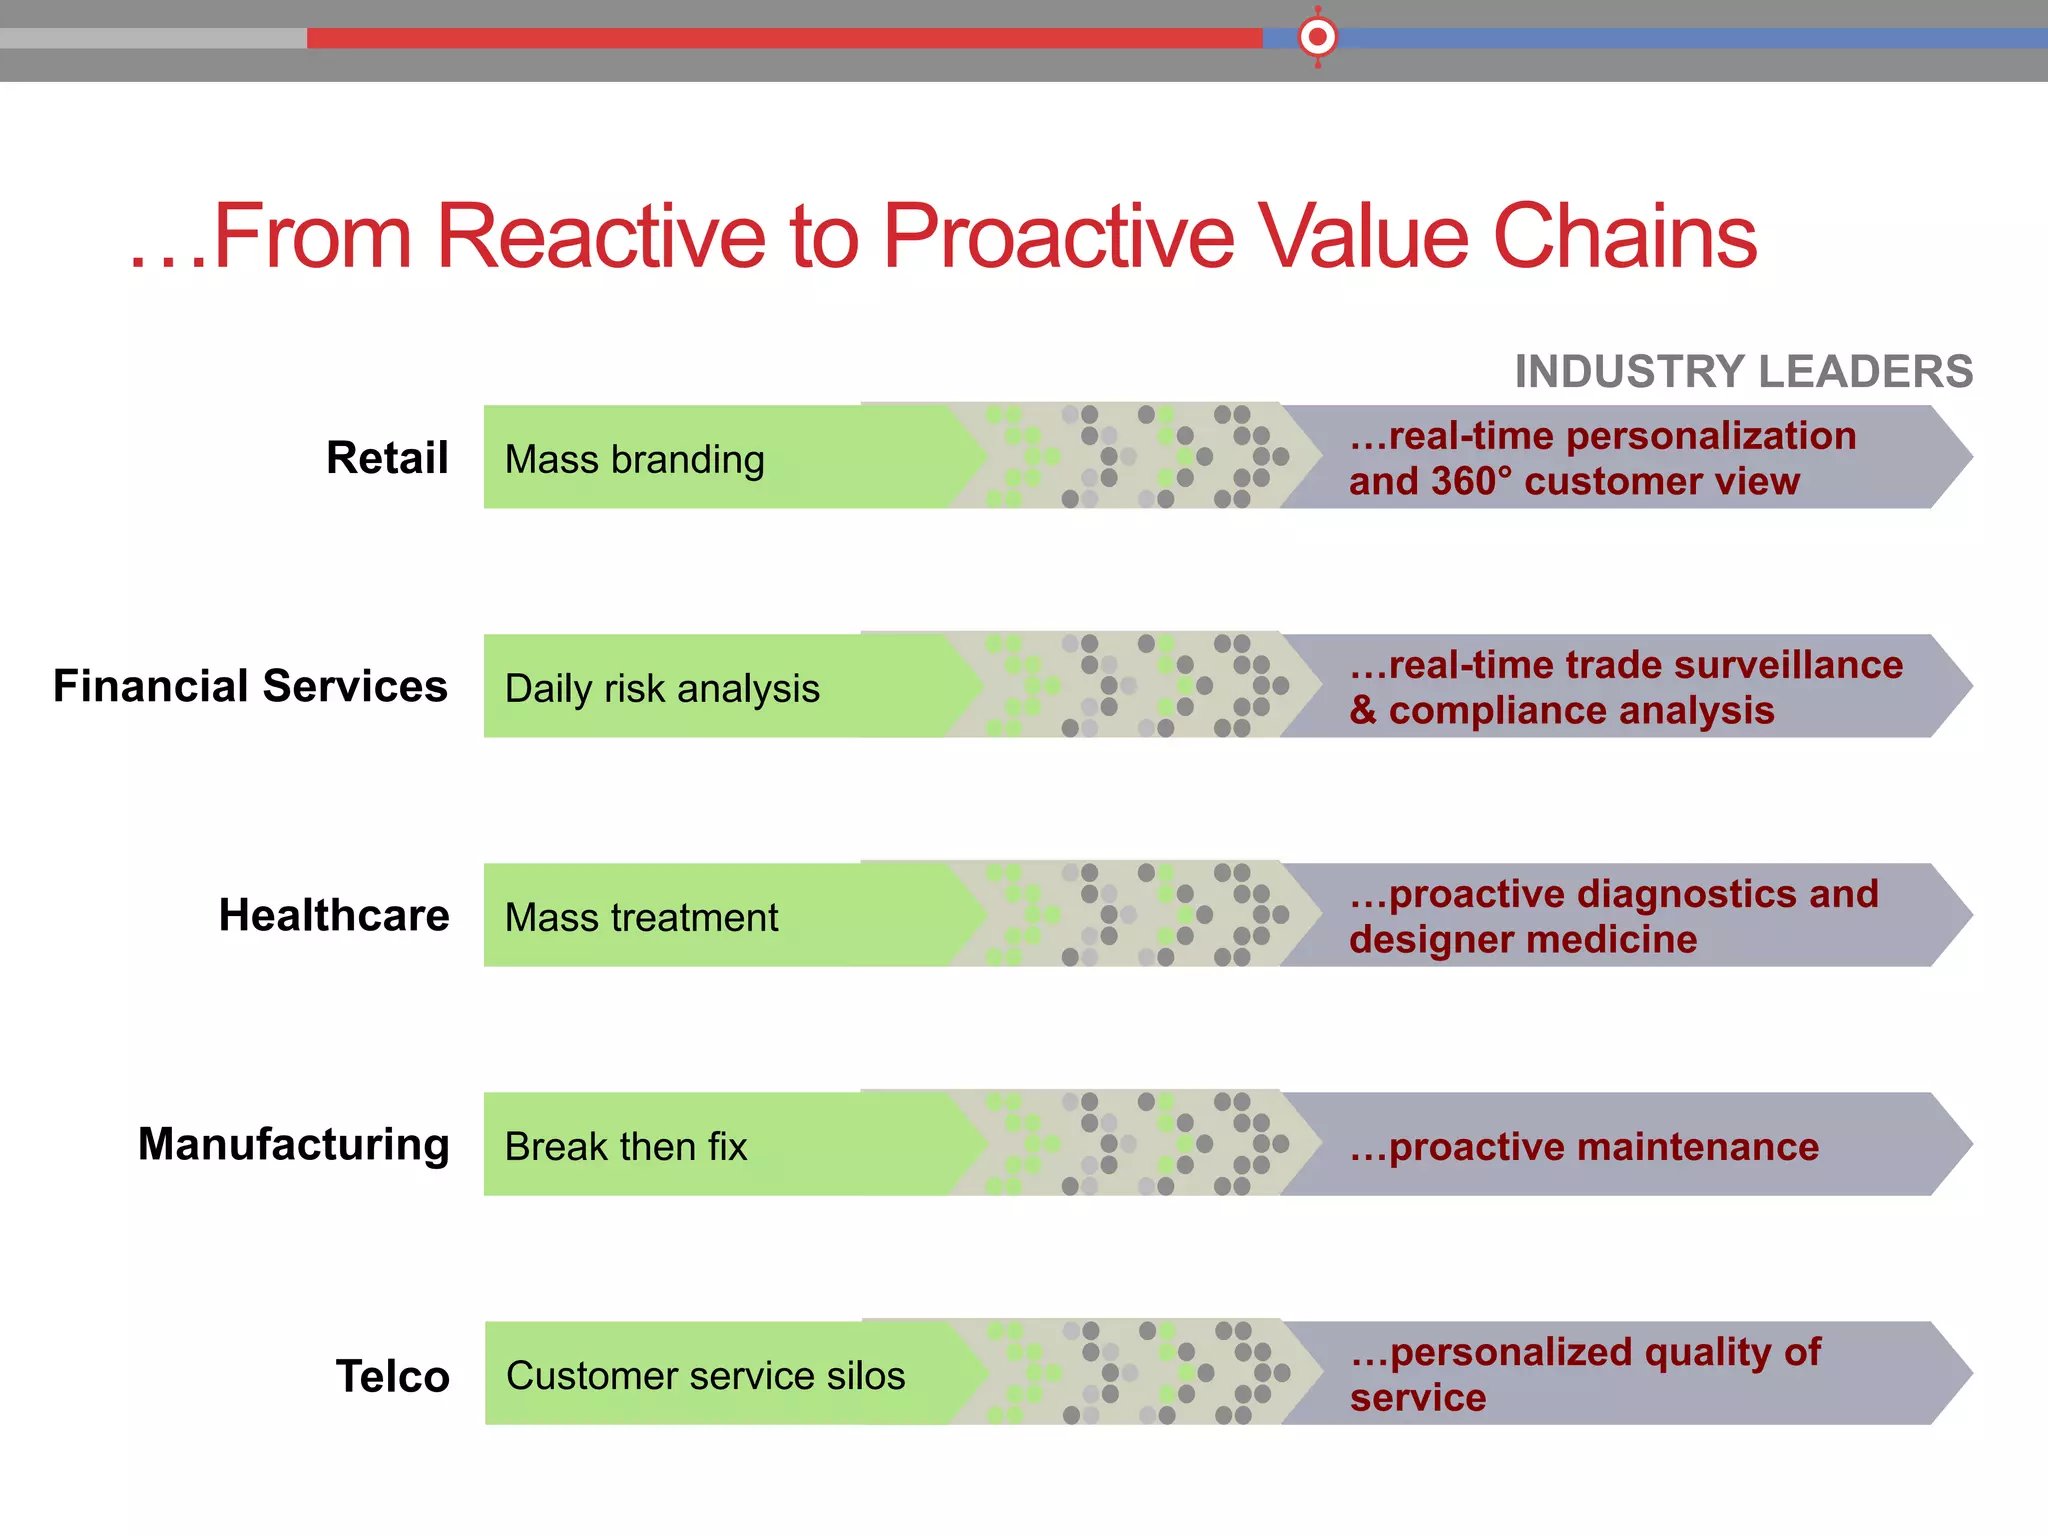
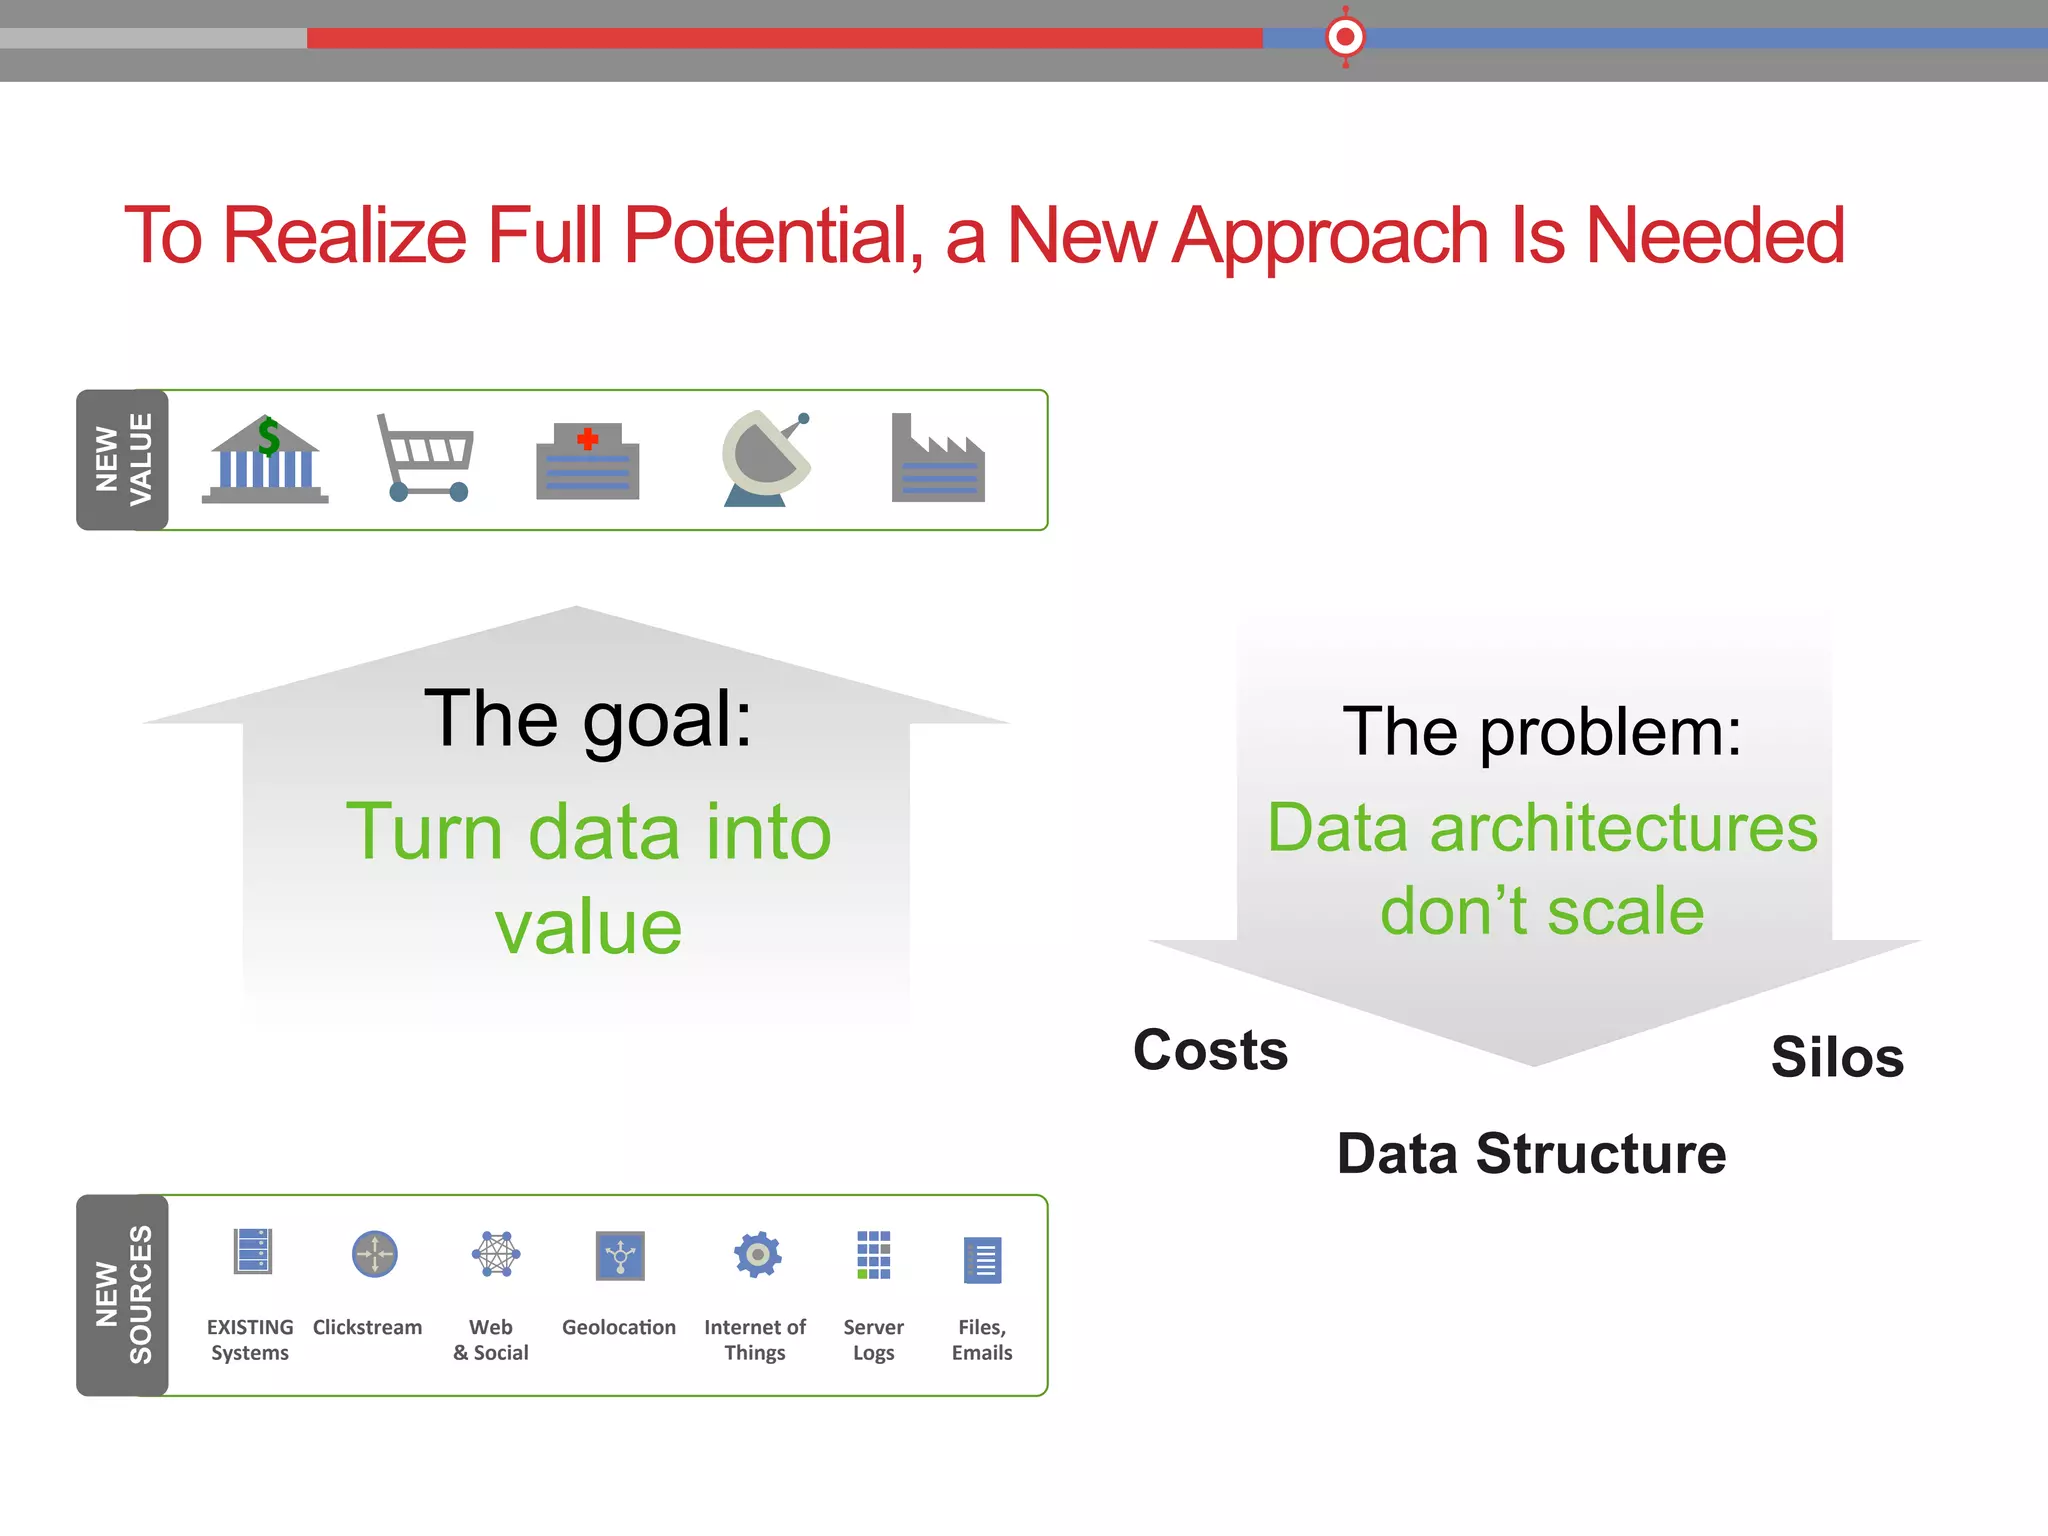
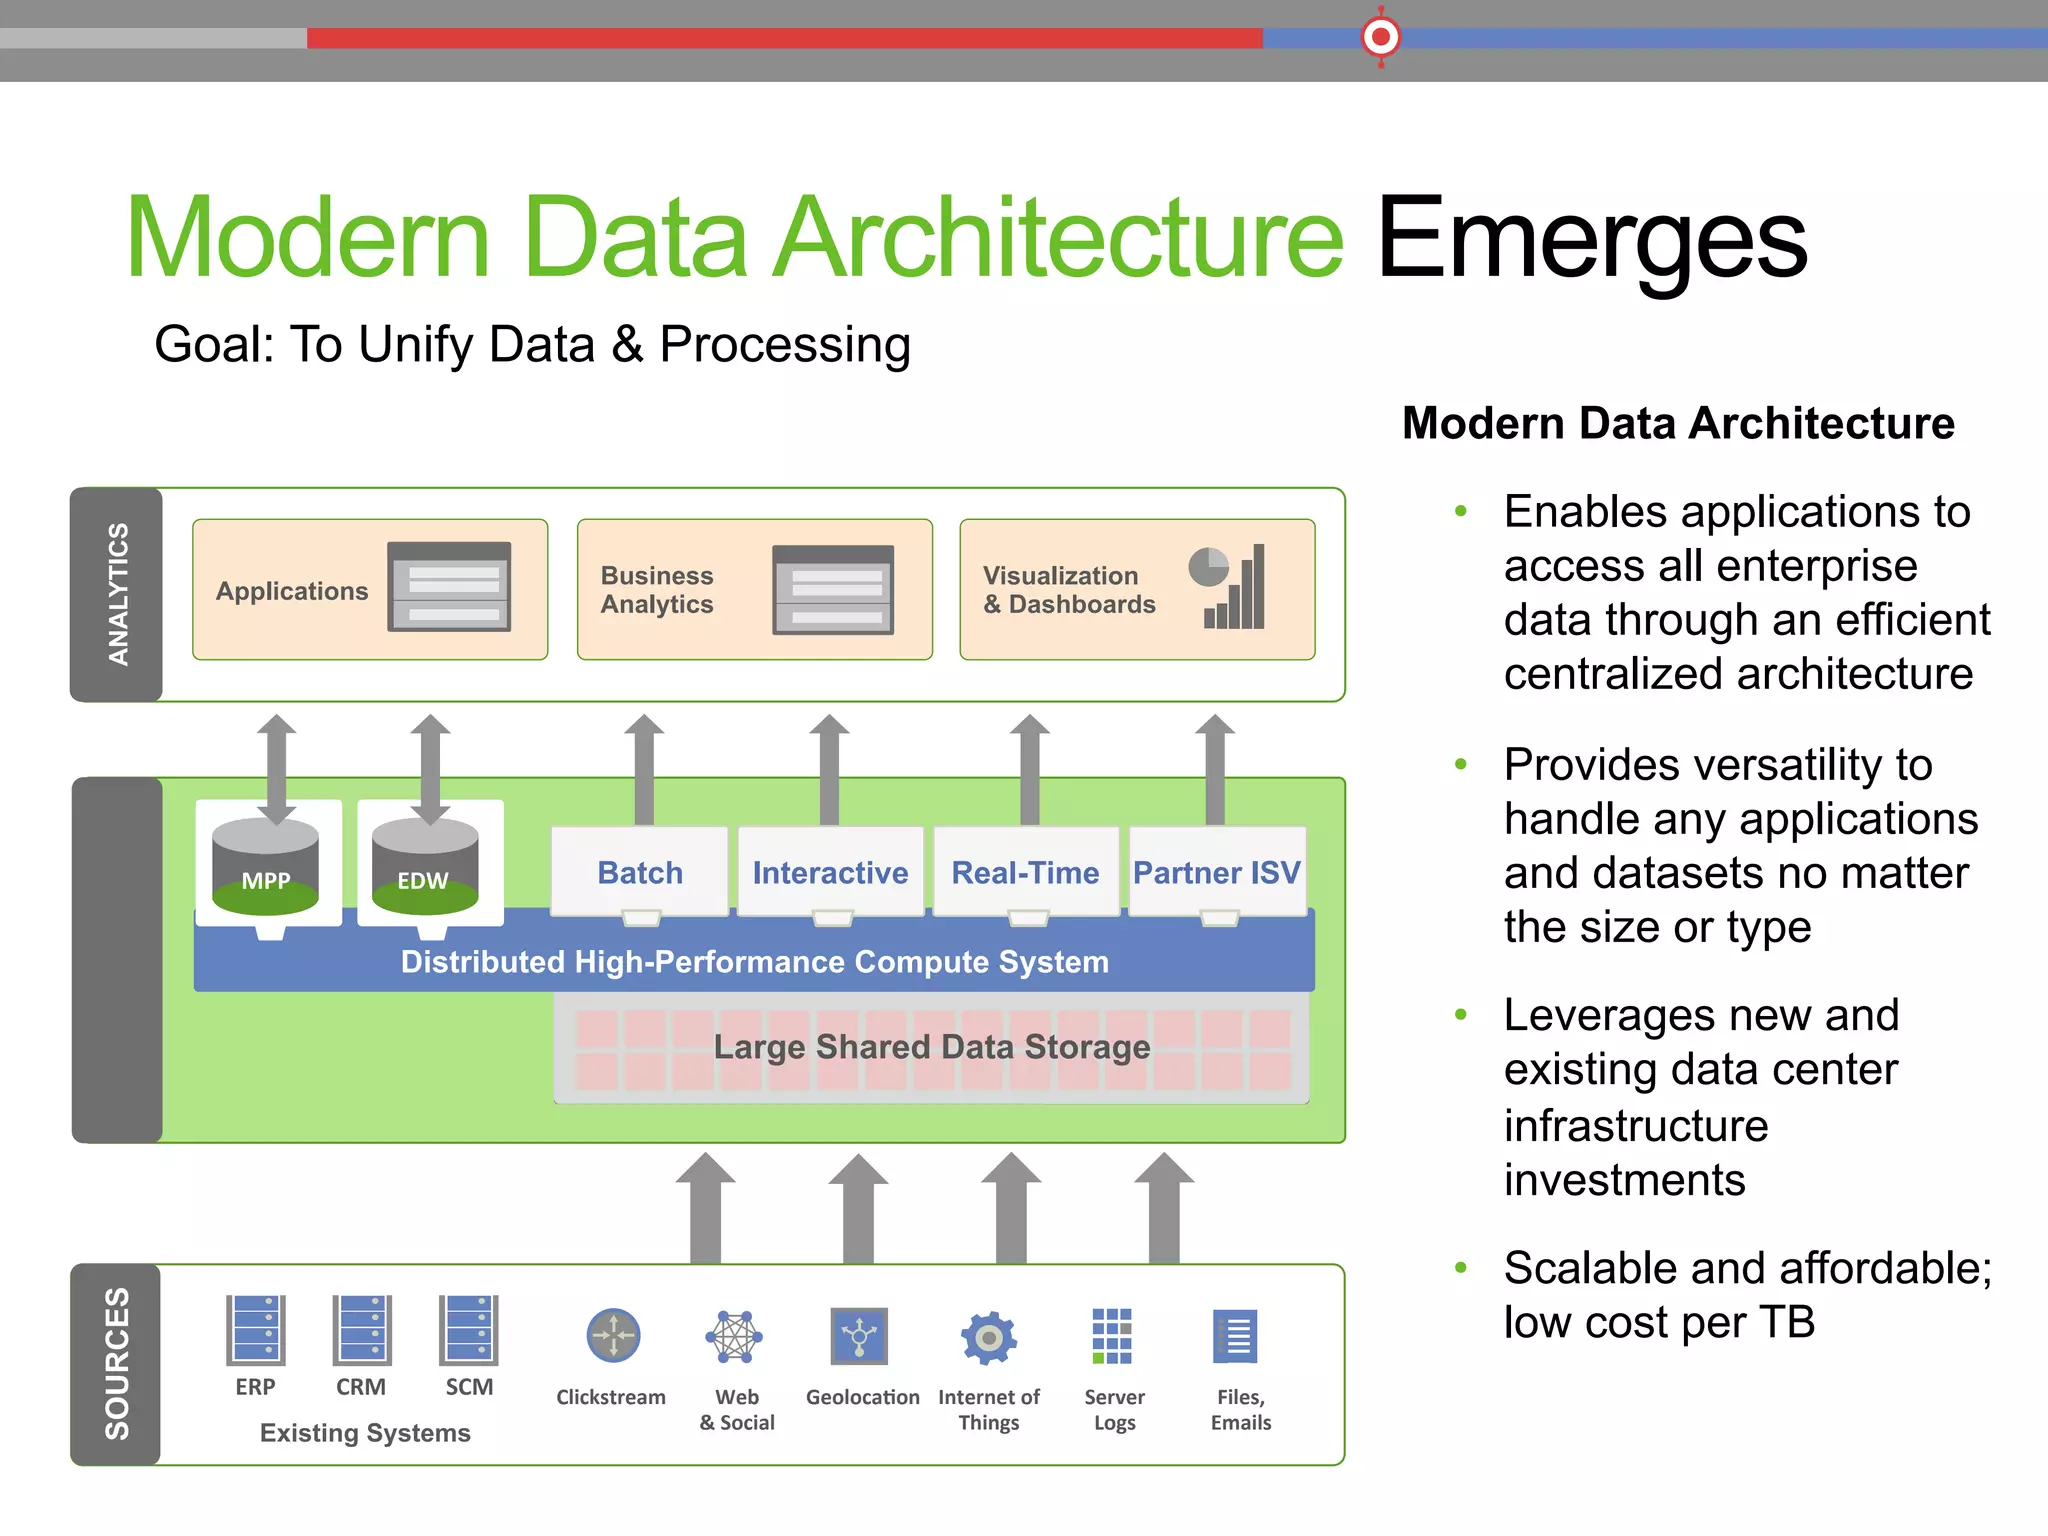
(Big) Data Processing for Next Generation Business Value. Presented at the Leaders Buildings Leaders Conference, held at Union College on April 3, 2015.
https://www.ucollege.edu/academics/business-and-computer-science/leaders-building-leaders
This presentation is a semi-technical overview of big data and related use-cases, the Apache Hadoop software stack, and some example data-science / analysis models.
1. Slideshare Copy
• Presented at the Leaders Building Leaders summit
• April 3, 2015 @ Union College
https://www.ucollege.edu/academics/business-and-
computer-science/leaders-building-leaders
2. THE NEW MODEL
(Big) Data Processing for Next Generation Business Value
Leaders Building Leaders Friday, 2015-04-03
3. What is This?
Abstract:
• Innovations in computing technology have led to the
development of new platforms, such as Apache Hadoop, that
enable a new style of data processing.
• This new approach offers low-cost scalable-computing on
commodity hardware and provides data processing capabilities
that combine the traditional SQL-based RDBMS with new
mechanisms for continuous, real-time, and deep analysis of
both stored and streaming information.
• The technology enables a modern data architecture that
enterprises rely on for more timely and in-depth decision
making.
4. Who Am I? David
Kaiser
@ddkaiser
linkedin.com/in/dkaiser
facebook.com/dkaiser
dkaiser@dkaiser.org
dkaiser@hortonworks.com
1995 Union College – B.S. Computer Information Systems
23 years experience with Linux & Open-Source Software
Career Emphases:
• Data Warehousing, Enterprise Data Modeling
• High Performance Computing (HPC)
• Geospatial & Multi-dimensional Analytics
• Open-Source Solutions and Architecture
5 years experience with Apache Hadoop
Employed at Hortonworks as a Senior Solutions Engineer
5. Who Are You?
• Computer Scientists?
• Business Advocates?
• Data Scientists?
• Industry Practitioners?
• Consumers?
6. Timeline View
• In my field, time is often the most-important dimension
• Timelines provide context, realization through visualization
• Watch the top border for the next 45 minutes
Historical/ Contextual
Business Use-Cases
Technology Brief
Scalable Computing
Data Science
Q Q
Q Questions
(‘Timeline View’ Slide)
7. 25 Years – Technology Evolution
• Classroom Technology Then and Now:
• Chalkboards è Whiteboards
• Homework Collection Box è Moodle
• “Overhead” Projectors è Digital Projectors
Technology has helped evolve
the education process to a
more interactive, socially
connected, media-driven and
real-time stream of events.
10. HP 3000 Mainframe @ Union
1978 – HP 3000 Model II
1986 – HP 3000 Series 70
• Every terminal on the Union College
campus was wired to the mainframe.
Campus Life depended on the HP 3000:
• Checking out a library book
• Purchasing food in the cafeteria or deli
• Checking-in at the Lifestyle Center
• Receiving your semester grades
• Testing your code (Database Design &
COBOL Programming class)
A very centralized topology – one system
stored every: application, file, record
1986: base machine with 8MB RAM, $150,000
Configured w/13GB disk, 16MB RAM, $250,000
11.
12. 25 Years – Networking Evolves
1990 2015 2015 Advantage
Media Copper Wire Fiber-Optic
Strands 500 2
Weight 10+ pounds per foot 5 grams per foot 900x Lighter
Voice Capacity 250 Voice Calls 8000 Voice Calls (1997) 32x More
Data Capacity 7 MB/s 1 GB/s (in 1997) 145x More
13.
14.
15. 25 Years – Storage Innovation
1988 2015 2015 Advantage
Media Spinning
Magnetic Plates
Solid-State(SSD)
NAND (Flash) RAM
Shock Resistant
Weight 6.8 Pounds 0.4 Grams 7700x Lighter
Power 4 Amps 40 mA 100x Less Energy
Cost $394 $399 none
Capacity 80MB 200GB 2500X Larger
18. Cloud – The New Datastore
• What is a CDN? Cache Delivery Network
• High speed content from the cloud
• Social shares (your Facebook photos)
• Spotify Songs
• Hulu Video Clips
• Delivery of online games, online ads,
• etc.
• Just One Example
• http://www.edgecast.com/network/
• Analyzing CDN usage logs provides great insight
20. Degrees @ Union Kept Pace
1970’s, 1980’s 1990 2000 2010 Now
Tabulating? (1960’s)
Data Processing (70’s)
Computer Information Systems
Computer Science
Mainframe -> Personal -> Client/Server -> Internet -> Cloud Computing
Serial -> Ethernet Network -> Fiber-Optic -> Wi-FI
Hard Disk -> SSD / Flash -> Online Storage
22. The World’s Data
• Explosive increase in amount of data to process
• Transition from centralized (mainframe)
• To: all those distributed devices
• Increase in Data transfer and storage
2.8 Zettabytes
in 2012
44 Zettabytes
in 2020
1 ZB is 2 to the 70th power bytes, which is
approximately 10 to the 21st power bytes.
(1,000,000,000,000,000,000,000) bytes.
26. Internet of Things -> Even More Data
• IoT is a concept of every thing being networked
• http://postscapes.com/internet-of-things-examples/
• “Smart Home”
• Energy efficiency
• Proactive shopping
• Environmental / Pollution Monitoring
• Integrating major platforms: Auto, Entertainment, Comms
• Already receive a text on my phone when my car needs service
• Can send a Google Map POI from the phone to the car navigation
• ARM Processor shipments: 64 Billion since 1993
• > 12 Bbn in 2014
28. Traditional Data – an Incomplete Picture
12 data points per home, per year
29. Smart Meter Data – 100,000x More Info
5 different data measurements * 4/hr * 24 * 365 = 175,200 data points
San Diego County, 1.8M meters. LA County, 7.1M meters.
1.5 Trillion data points per year for 2 counties
è
30. Providing New Analytics
Challenge: Power outages cost the US economy
$80 billion annually
• Utilities must match supply with demand
• Slow response to peak demand requires
expensive “peaker plants” or can cause blackouts
• Understanding voltages at edge-points is key
Solution: Managing voltage levels saves energy, reduces peak-
driven strains on the grid
• Smart meters provide greater monitoring and control
• Companies can pro-actively manage the grid to avoid outages
• Analyze transmission repair needs and dispatch crews more effectively
33. Traditional Auto Insurance Data Collection
Historical collection of driving behavior data: tickets and accidents
34. Collecting New Driving Data with Sensors
New Applications: Save lives, avoid tickets, reduce premiums
35. Longer Data Retention & Faster Analysis
Challenge: Risk analysis lagged because of
architecture gaps
• Volume, velocity and variety of data taxed
existing storage platform
• ETL process captured only 25% of the data,
took 5-7 days to complete
Solution: More data improves assessment of actual risk
• Vastly improved interactive analysis with Apache Hive
• ETL acceleration: now process 100% of the data in three days or less
37. Manufacturing Data for Defect Analysis
Test data determines overall product quality, enables failure analysis
(such as yield rate) for manufacturing performance
Note: Images are not of the client’s operations (for discussion purposes only)
38. Data for Real-Time Decisions and
Historical Analysis
Challenge: Data scarcity made root cause
analysis difficult for returned products
• 200 million units manufactured annually
• Despite world-leading manufacturing process,
more than 10,000 units returned monthly
• Subset (selected fields) of manufacturing data
retained for only 3 months
Solution: Longer data retention for better root cause analysis
• All manufacturing data retained for 24 months
• 10x improvement in speed to insight
• Searchable data for >1,000 employees
40. 360-Degree View of LCV* for Home
Supply Retailer
Customer behavior data stored in silos, difficult to join for 360-view
Note: Images are not of the client’s operations (for discussion purposes only)
LCV: Lifetime Customer Value
41. Targeted Marketing, Data Storage Savings
Challenge: Lack of unified customer records
• Global distribution: home, online and 1000s of stores
• No “golden record” of customer across all channels
(web traffic, POS and in-home services in silos)
• Limited ability to do targeted marketing
• Data storage costs increasing
Solution: Storage savings & a golden record for targeted marketing
• Golden record enables targeted, personalized marketing
• Data warehouse offload saves millions in recurring annual expense
• New use case: price optimization versus competitors
à millions in top-line growth
42. Recommendation Engines
Machine Learning in Action
• As you order items from Amazon
• Your Netflix video viewing choices
influence your suggested videos
• Your Spotify listening list
influences your suggested artists
• Even Google Maps adjusts what
you see depending on your
history; for example, I often
search for meeting places and
now Google Maps shows this by
default.
43. Behavior, Co-occurrence, and Text
Retrieval
Making Predictions
• Behavior of users is the best clue
to what they want.
• Co-occurrence is a simple basis
to compute significant indicators
of what should be recommended.
• There are similarities between
the weighting of indicator scores
in output of such a model and the
mathematics that underlie text
retrieval engines.
• This mathematical similarity
makes it possible to exploit text
based search to deploy a
recommender using Apache Solr/
Lucene.
51. New Data Paradigm is Driving a Shift in IT...
Traditional Systems
• Data constrained to apps
• Can’t manage new data
• Costly to scale
Business Value
Clickstream
Geolocation
Web Data
Internet
of Things
Files, Emails
Server Logs
2.8 Zettabytes
in 2012
44 Zettabytes
in 2020
LAGGARDS
New Data, New Opportunity
ERP CRM SCM
New Data
Traditional Data
LEADERS
1 Zettabyte (ZB) = 1 million Petabytes (PB); Sources: IDC, IDG Enterprise, and AMR Research
Limited ability
to innovate Industry leadership
via full fidelity of data
and advanced analytics
52. …From Reactive to Proactive Value Chains
…proactive maintenanceBreak then fix
…personalized quality of
service
Customer service silos
…proactive diagnostics and
designer medicine
Mass treatment
…real-time trade surveillance
& compliance analysis
Daily risk analysis
…real-time personalization
and 360° customer view
Mass brandingRetail
Financial Services
Healthcare
Manufacturing
Telco
INDUSTRY LEADERS
53. To Realize Full Potential, a New Approach Is Needed
EXISTING
Systems
Clickstream
Web
&
Social
Geoloca9on
Internet
of
Things
Server
Logs
Files,
Emails
NEW
SOURCES
The goal:
Turn data into
value
$
NEW
VALUE
The problem:
Data architectures
don’t scale
Costs
Data Structure
Silos
54. Modern Data Architecture Emerges
Clickstream
Web
&
Social
Geoloca9on
Internet
of
Things
Server
Logs
Files,
Emails
SOURCES
Existing Systems
ERP
CRM
SCM
ANALYTICS
Data
Marts
Business
Analytics
Visualization
& Dashboards
ANALYTICS
Applications
Business
Analytics
Visualization
& Dashboards
°
°
°
°
°
°
°
°
°
°
°
°
°
°
°
°
°
°
°
°
°
°
°
°
°
°
°
°
°
°
Large Shared Data Storage
Distributed High-Performance Compute System
Interactive Real-TimeBatch Partner ISVBatch BatchMPP
EDW
Goal: To Unify Data & Processing
Modern Data Architecture
• Enables applications to
access all enterprise
data through an efficient
centralized architecture
• Provides versatility to
handle any applications
and datasets no matter
the size or type
• Leverages new and
existing data center
infrastructure
investments
• Scalable and affordable;
low cost per TB
55. Modern Data Architecture Emerges
Clickstream
Web
&
Social
Geoloca9on
Internet
of
Things
Server
Logs
Files,
Emails
SOURCES
Existing Systems
ERP
CRM
SCM
ANALYTICS
Data
Marts
Business
Analytics
Visualization
& Dashboards
ANALYTICS
Applications
Business
Analytics
Visualization
& Dashboards
°
°
°
°
°
°
°
°
°
°
°
°
°
°
°
°
°
°
°
°
°
°
°
°
°
°
°
°
°
°
Hadoop HDFS (Distributed File System)
Hadoop YARN: Data Operating System
Interactive Real-TimeBatch Partner ISVBatch BatchMPP
EDW
Goal: To Unify Data & Processing
Modern Data Architecture
• Apache Hadoop
• HDFS provides the
replicated, distributed
data storage
• YARN provides the
scalable compute grid
• Standardized platform
provides base to host all
big-data applications
57. • To first understand Hadoop, let’s first take a look at:
• High-Performance-Computing
• Distributed Processing
58. History of Super-Computing: Cray 1
“Unified Memory”
All cores accessible
Intricate hand-wired
Backplane
Expensive liquid
cooling system
59. Cray Jaguar XT
Move to distributed /
multi-node
Still uses
expensive liquid
cooling system
60. Apache Hadoop
• Partitioned
• Distributed
• High Performance
• Flexible, Supports Many Types of Apps and Workloads
• Runs on Commodity Hardware : Affordability
61. Apache Hadoop: Big Data Platform
Store ALL DATA in one place…
Interact with that data in MULTIPLE WAYS
with Predictable Performance and Quality of Service
Applica9ons
Run
Na9vely
in
Hadoop
HDFS2
(Redundant,
Reliable
Storage)
YARN
(Cluster
Opera7ng
System)
BATCH
(MapReduce)
INTERACTIVE
(Tez)
STREAMING
(Storm,
S4,…)
GRAPH
(Giraph)
IN-‐MEMORY
(Spark)
HPC
MPI
(OpenMPI)
ONLINE
(HBase)
OTHER
(Search)
(Weave…)
62. Hadoop + Linux
Provides a 100% Open-Source framework for efficient
scalable data processing on commodity hardware
Commodity
Hardware
Linux – The
Open-source
Operating System
Hadoop – The
Open-source
Data Operating
System
63. Hive – MR Hive – Tez
MapReduce, Tez Dataflows
SELECT a.x, AVERAGE(b.y) AS avg
FROM a JOIN b ON (a.id = b.id) GROUP BY a
UNION SELECT x, AVERAGE(y) AS AVG
FROM c GROUP BY x
ORDER BY AVG;
SELECT a.state
JOIN (a, c)
SELECT c.price
SELECT b.id
JOIN(a, b)
GROUP BY a.state
COUNT(*)
AVERAGE(c.price)
M M M
R R
M M
R
M M
R
M M
R
HDFS
HDFS
HDFS
M M M
R R
R
M M
R
R
SELECT a.state,
c.itemId
JOIN (a, c)
JOIN(a, b)
GROUP BY a.state
COUNT(*)
AVERAGE(c.price)
SELECT b.id
69. What is Data Science?
• The scientific exploration of data to extract meaning or
insight, and the construction of software systems to utilize
such insight in a business context
70. What is Data Science?
• The scientific exploration of data to extract meaning or
insight, and the construction of software systems to utilize
such insight in a business context
• …the art of discovery
…and the science
of operations
71. What is Data Science?
• The scientific exploration of data to extract meaning or
insight, and the construction of software systems to utilize
such insight in a business context
• …the art of discovery
…and the science
of operations
What is a Data Scientist?
… A person who explores and discovers
interesting and valuable facts within data
and builds systems to deliver value
72. Driver: Advanced Analytic Applications
Single View: Improve
acquisition & retention
• Enables a single view of
each customer, allowing
organizations to provide
targeted, personalized
customer experiences.
• Single view reduces
attrition, improves cross-sell
and improves customer
satisfaction.
Predictive Analytics:
Identify next best action
• Capture, store and process
large volumes of data
streaming from connected
devices.
• Stream processing and data
science help introduce new
analytics for real-time and
batch analysis.
Data Discovery:
Uncover new findings
• Allows exploration of new
data types and large data
sets that were previously
too big to capture, store &
process.
• Unlocks insights from data
such as clickstream, geo-
location, sensor, server log,
social, text and video data.
73. Single View
Improve acquisition and
retention
Data Discovery
Uncover new findings
Predictive
Analytics
Identify your next best
action
Financial
Services
New Account Risk Screens Insurance Underwriting Trading Risk
Improved Customer Service Aggregate Banking Data as a Service Insurance Underwriting
Cross-sell & Upsell of Financial Products Identify Claims Errors for Reimbursement
Risk Analysis for Usage-Based Car
Insurance
Telecom
Unified Household View of the Customer
Protect Customer Data from Employee
Misuse
Searchable Data for NPTB
Recommendations
Analyze Call Center Contacts Records Call Detail Records (CDR) Analysis Network Infrastructure Capacity Planning
Inferred Demographics for Improved
Targeting
Tiered Service for High-Value Customers
Proactive Maintenance on Transmission
Equipment
Retail
360° View of the Customer Website Optimization for Path to Purchase Supply Chain Optimization
Localized, Personalized Promotions
Data-Driven Pricing, improved loyalty
programs
A/B Testing for Online Advertisements
Customer Segmentation In-Store Shopper Behavior Personalized, Real-time Offers
Healthcare
Electronic Medical Records Use Genomic Data in Medical Trials Monitor Patient Vitals in Real-Time
Improving Lifelong Care for Epilepsy
Monitor Medical Supply Chain to Reduce
Waste
Rapid Stroke Detection and Intervention
Reduce Patient Re-Admittance Rates Healthcare Analytics as a Service Video Analysis for Surgical Decision Support
Oil & Gas
Unify Exploration & Production Data Geographic exploration Monitor Rig Safety in Real-Time
DCA to Slow Well Declines Curves Define Operational Set Points for Wells
Proactive Maintenance for Oil Field
Equipment
Government
Single View of Entity
Sentiment Analysis on Program
Effectiveness
CBM & Autonomic Logistic Analysis
Prevent Fraud, Waste and Abuse Meet Deadlines for Government Reporting
Proactive Maintenance for Public
Infrastructure
Driver: Advanced Analytic Applications
74. Ex: Predictive Analytics Case Studies
Preventative
Maintenance
Oil and Gas Co. analyzes
streaming sensor data to
predict issues and fix
equipment before pumps
break and jeopardize oil
production.
Resource
Optimization
Energy Co. analyzes
smart meter data and grid
metrics to predict future
consumption patterns and
identify substations where
voltage can be reduced to
drive cost savings.
Behavioral
Insight
Insurance Co. collects
sensor data from cars
and analyzes it in hours
to maintain up-to-date risk
profiles, predict the
likelihood of future claims,
and adjust pricing and
products accordingly.
75. Ex: Predictive Analytics Case Studies
Truck
Sensors
Distributed Storage: HDFS
Many Workloads: YARN
Stream Processing
(Storm)
Inbound Messaging
(Kafka)
Microsoft
Excel
Interactive Query
(Hive)
Alerts & Events
(ActiveMQ)
Real-Time
User Interface
Real-time Serving
(HBase)
76. Data Science is iterative in nature…
Visualize,
Grok
Hypothesize;
Model
Measure/
Evaluate
Acquire Data
Clean Data
Formulate
Question
Deploy
77. Data
Exploration
Feature
Engineering
Pre
Processing
Data Science combines proficiencies…
• Practical data science
is comprised of four
main groups with key
supporting functions
• A data scientist needs
to be proficient in all
these functions that
range from technical to
analytical
Signal
Processing
OCR
Transform
Normalize
Aggregate
Simple
Statistics
Data
Modeling
Frequent
Itemset
Anomaly
Detection
Clustering
Collaborative
Filter
Regression
Classification
Supervised
Learning
Unsupervised
Learning
ReportingVisualizationData Quality
technical analytical
Dimension
Reduction
Feature
Selection
Information
Theory
Natural
Language
Processing
78. Areas of expertise in data science
Data Engineer
• Data engineering
(quality, ETL, pipelines etc…)
• Computer science
• Coding (Java, Scala, Python, etc…)
Applied Scientist
• Research scientist focusing on solving
real-world problems
• Machine learning, advanced statistics,
applied math, NLP, visualization.
Business Analyst
• Business/domain expertise
• SQL, Excel, Visualization
tools
Big data engineer
• Hadoop, PIG, HIVE,
Cascading, SOLR, etc
• Statistics and machine
learning over large datasets
79.
80. What is Machine Learning?
WALL-E was a machine that learned how to
feel emotions after 700 years of experiences
on Earth collecting human artifacts.
Machine learning is the science of getting
computers to learn from data and act without
being explicitly programmed.
• Machine learning is about the
construction and study of systems that
can learn from data.
• The core of machine learning deals with
representation and generalization so that
the system will perform well on unseen
data instances and predict unknown
events.
• There is a wide variety of machine
learning tasks and successful
applications.
82. Supervised Learning
• Supervised
learning:
the training data
(i.e. the data being
presented to the
machine learning
algorithm) is labeled.
• In this case, the
machine is tasked
with classifying new
data based on the
provided labels.
84. Detecting Outliers – Fraud Detection
Identity Thief is a comedy about a
woman in Florida stealing the
identity of a man named Sandy
Bigelow from Colorado
Local outlier factor compares the
local density of a point's
neighborhood with the local density of
its neighbors. Points that have a
substantially lower density than
neighbors are outliers.
The k-nearest neighbor-based
(KNN-based) algorithms use the
average distance from the closest K
neighborhood to a point as the outlier
factor.
One-class SVM (one-class Support
Vector Machines) is a variation of
regular SVM suitable for outlier
detection.
86. Some Recommended Books – Pt. 1
• I own these / use for reference or ideas
• Recommended Books on Data Analysis
• Visualizing Data, O'Reilly / Fry
• Data Analysis with Open Source Tools, O'Reilly / Janert
• Books on Apache Hadoop / MapReduce, Computation
• Hadoop: The Definitive Guide, O'Reilly / White
• MapReduce Design Patterns, O'Reilly / Miner, Shook
• Apache Hadoop YARN, Pearson / Murthy et. al.
• Data-Intensive Text Processing with MapReduce
• High Performance Computing, O'Reilly / Dowd, Severance
• Business Centric Titles
• The Art of Scalability, Addison-Wesley / Abbott, Fisher
87. • General Advice
• Books on developer language areas related to Data Science:
• Spark - Learning Spark
• Python
• R
• Books on data science
• Machine Learning: The Art and Science of Algorithms that Make Sense
of Data
Some Recommended Books – Pt. 2