SlideShare a Scribd company logo
The Missing
    Piece
                                                               Image credit Shel Silverstein


                           of America’s Clean Local
                              Energy Transformation

                                                       John Farrell, Senior Researcher


Presentation to Biocycle Conference on Oct. 29, 2012
How Much of Missouri’s Power
    from Rooftop Solar?


                                ?%


       Residential and Commercial roofs
How Much of Missouri’s Power
    from Rooftop Solar?


                               21%


       Residential and Commercial roofs
How Much Power from Local, Rooftop Solar?
      23%                                                                                          21%
                                                                                                 18%     24%
                    19%                19%
  21%                                              24%
                                                                                                          21%
            23%                        25%                   22%
                                                                                                 15%
                        14%                                                23%
                                                                                                          23%
                                                     20%                                    12% 18% 24%
      51%                              21%
                                                                       18% 20%                   26%
             38%
52%                      41%                                    17%                                      19%
                                                                                     11% 24%
                                          25%            21%                19%
                                                                                            28%
                                                                        23%
            49%                             28%          19%
                        26%                                                                24%
                                                                22% 20% 31%
                                                         23%
                                       35%

                                                        Potential Percent of Electricity
      23%                                                 from Rooftop Solar PV             42%
                                                               0 to 10%
                                                               10 to 25%
                                                               25 to 50%
                  49%
                        Residential and Commercial roofs       50 to 100%
How Much Power from Local Wind?
      116%                                                                                           109%
                                                                                                297%        780%
                    27,000%          28,000%
  311%                                            3200%
             543%                                             912%                                           12%
                                     35,000%                                                    116%
                     14,000%                                                 478%
                                                                                                           3%
                                                    5200%                                      14%    1% 2%
      97%                            14,000%
                                                        541% 223%    11%
              269%
52%                       2900%                     726%                                                     2%
                                                                25% 9%
                                         9700%  1500%      2%
                                                                    3%
                                                         2%
             95%                          4100% 300%
                         8900%                                    4%
                                                                    0%       2%        1%
                                                            10%
                                      2500%
                                                            Potential Percent of Electricity
                                                             from Onshore Wind Power
      0%                                                            0 to 10%                   0%
                                                                    10 to 25%
                                                                    25 to 50%
                                                                    50 to 100%
                    0%
                           100 meters, 30% c.f. or better           100% or more
How Much Power from Local Renewables?


      32 states - 100%+

        9 states - 50%+

                    Potential Percent of Electricity
                         from Renewables
                            0 to 10%
                            10 to 25%
                            25 to 50%
                            50 to 100%
                            100% or more
Transformation
  Yesterday                                         Tomorrow
 Centralized Power                                  Clean, local power
                                                                                 Solar PV
                                                                                power plant


                                                                   Storage   Storage
          Transmission network


                                                         Storage

                                                                               Storage
  House
                                       Local CHP plant

          Distribution network                                                                 House with
                                                                                              domestic CHP


                                                                             Wind
                                                                             power
Factory                   Commercial                                         plant
                           building
10¢
                                •prevent blackouts
   5¢                           •reduce pollution
                                •create jobs
 0¢
  0¢
          $4/Watt               •on-site/near demand
                                •lower transmission losses
  -5¢
                                •reduce dist. system stress
                                •hedge against fuel prices
                                •avoided cost
 -10¢


 -15¢                                           4¢
                                                                             How the utility
                                                                            values distributed
-20¢
 -20¢
        Cost of solar                    Energy value
                                                                                generation
                                                                              Grid benefits                       Social benefits
            Distributed Solar Power Worth Far More Than Electrons | Energy Self-Reliant States - http://tinyurl.com/3tqmerh
10¢
                                •prevent blackouts
   5¢                           •reduce pollution
                                •create jobs
 0¢
  0¢
                                •on-site/near demand
                                •lower transmission losses
  -5¢
                                •reduce dist. system stress
                                •hedge against fuel prices
                                •avoided cost
 -10¢

                                                                                  8.5¢                   But it’s
 -15¢                                           4¢                                                       worth
-20¢
 -20¢
                                                                                                          more
        Cost of solar                    Energy value                         Grid benefits                       Social benefits
            Distributed Solar Power Worth Far More Than Electrons | Energy Self-Reliant States - http://tinyurl.com/3tqmerh
10¢
                                                                                                              and more
                                •prevent blackouts
   5¢                           •reduce pollution
                                •create jobs
 0¢                             •on-site/near demand
  0¢
                                •lower transmission losses  12.4¢
  -5¢
                                •reduce dist. system stress
                                •hedge against fuel prices
                                •avoided cost
 -10¢

                                                                                  8.5¢
 -15¢                                           4¢

-20¢
 -20¢
        Cost of solar                    Energy value                         Grid benefits                       Social benefits
            Distributed Solar Power Worth Far More Than Electrons | Energy Self-Reliant States - http://tinyurl.com/3tqmerh
It’s Real
$0.15


$0.12


$0.09


$0.06
                                                                                 Local capacity value
$0.03             7¢                                                             Avoided transmission access
                                                                                 Environmental
                                                                                 Avoided transmission losses
  $0                                                                             Brown energy replacement


        Palo Alto, CA, municipal utility
          Feed-In Tariff for PV in Palo Alto, Calif. Imminent: http://tinyurl.com/72sxgsb
It’s Real
$0.15


                                                  }
$0.12                                                                  6¢ per kWh
$0.09
                                                                      in addition to
                                                                        electricity
$0.06
                                                                                 Local capacity value
$0.03             7¢                                                             Avoided transmission access
                                                                                 Environmental
                                                                                 Avoided transmission losses
  $0                                                                             Brown energy replacement


        Palo Alto, CA, municipal utility
          Feed-In Tariff for PV in Palo Alto, Calif. Imminent: http://tinyurl.com/72sxgsb
Jobs per Megawatt
  Solar PV


      Wind


      Coal


Natural Gas


              0                2                  4              6              8               10
                                                       Construction, manufacturing, and installation
                                                       Ongoing maintenance and fuel


          Putting Renewables to Work: How Many Jobs Can the Clean Energy Industry Create? (UC Berkeley)
Local Economic Impact

          Not local
                                     Up to 3.4x higher

               Local ownership


 Economic Development Impacts of Community Wind Projects: A Review and Empirical Evaluation (NREL)
Not local            -44%


              +77% net approval
  Local
Ownership
                                                     +33%


                 0            25      50        75          100
       very negative      negative   neutral   positive     very positive


Attitude towards increased use of local wind energy
Jobs


                             Clean, Local Energy

                    Votes                                                                                               Money


Photo credits: (wind) Flickr user ali_pk, (solar, above) Ian-S, (solar, below) MN CERTS, (money) Flickr user epSos.de
Image credit Shel Silverstein
http://www.abc.net.au/science/articles/2010/12/02/3081889.htm
Biogas or
                                                                Biomass CHP


http://www.abc.net.au/science/articles/2010/12/02/3081889.htm
What’s Missing?
Renewable energy policy
                                             17%
                    Solar/wind electricity   10%
Current RE policy
                                             17%
                    Solar/wind electricity   10%
               Geothermal electricity
               Micro hydropower
Current RE policy
                                             17%
                    Solar/wind electricity   10%
               Geothermal electricity
               Micro hydropower


               Ground-source geothermal
               Solar heat (e.g. hot water)
Current RE policy
                                             17%
                    Solar/wind electricity   10%
               Geothermal electricity
               Micro hydropower


               Ground-source geothermal
               Solar heat (e.g. hot water)


                    Biomass CHP
                    Biogas Heat
Current RE policy
                                             17%
                    Solar/wind electricity   10%
               Geothermal electricity
               Micro hydropower


               Ground-source geothermal      100%
               Solar heat (e.g. hot water)
                                             100%
                    Biomass CHP
                    Biogas Heat


                    Biogas Fuel Cells
                    Renewable NG
States with Renewable Heat Policies


    An Overview of Renewable Heating in the United States: Policy and Market Trends
States with Renewable Heat Policies
     (that offset non-electricity)


    An Overview of Renewable Heating in the United States: Policy and Market Trends
Biogas Policies          Biogas Energy


  CLEAN Contracts
   (Feed-In Tariffs)     Electricity, Heat, and
                            Cogeneration

Enhanced Renewable
 Electricity Standards

                         Pipeline Renewable
 Renewable Natural           Natural Gas
  Gas Standards
                                Biogas: Rethinking the Midwest’s Potential
What’s Missing?

Biogas and Biomass for:
    Flexible electricity
    Renewable heat
    Look for success: Germany, Denmark

More Related Content

What's hot

Canada digital review
Canada digital reviewCanada digital review
Canada digital review
Veronika Orlovskaya
 
What Are Our Prospects Are Thinking Right Now Michael Starke, Vp Of Research
What Are Our Prospects Are Thinking Right Now   Michael Starke, Vp Of ResearchWhat Are Our Prospects Are Thinking Right Now   Michael Starke, Vp Of Research
What Are Our Prospects Are Thinking Right Now Michael Starke, Vp Of Research
michaelstarke
 
Passion,persistence,partnerships secrets for earning more online
Passion,persistence,partnerships   secrets for earning more onlinePassion,persistence,partnerships   secrets for earning more online
Passion,persistence,partnerships secrets for earning more onlinenfpSynergy
 
2nd half of 2010 market anaylsis v6.0
2nd half of 2010 market anaylsis v6.02nd half of 2010 market anaylsis v6.0
2nd half of 2010 market anaylsis v6.0dpshieh
 
Barb vankerkhove 2012 presentation
Barb vankerkhove 2012 presentationBarb vankerkhove 2012 presentation
Barb vankerkhove 2012 presentation
Elyk Venture Management
 
Distributing Video To The Masses
Distributing Video To The MassesDistributing Video To The Masses
Distributing Video To The Masses
Richard Harrington
 
2010 Brand Z Top100 Report+
2010 Brand Z Top100 Report+2010 Brand Z Top100 Report+
2010 Brand Z Top100 Report+
Diminished Value of Georgia
 
NJ Future population changes in built out municipalities 7-2012
NJ Future population changes in built out municipalities 7-2012NJ Future population changes in built out municipalities 7-2012
NJ Future population changes in built out municipalities 7-2012
New Jersey Future
 

What's hot (10)

Axp 2011 csbar_market
Axp 2011 csbar_marketAxp 2011 csbar_market
Axp 2011 csbar_market
 
Canada digital review
Canada digital reviewCanada digital review
Canada digital review
 
What Are Our Prospects Are Thinking Right Now Michael Starke, Vp Of Research
What Are Our Prospects Are Thinking Right Now   Michael Starke, Vp Of ResearchWhat Are Our Prospects Are Thinking Right Now   Michael Starke, Vp Of Research
What Are Our Prospects Are Thinking Right Now Michael Starke, Vp Of Research
 
Passion,persistence,partnerships secrets for earning more online
Passion,persistence,partnerships   secrets for earning more onlinePassion,persistence,partnerships   secrets for earning more online
Passion,persistence,partnerships secrets for earning more online
 
2nd half of 2010 market anaylsis v6.0
2nd half of 2010 market anaylsis v6.02nd half of 2010 market anaylsis v6.0
2nd half of 2010 market anaylsis v6.0
 
Barb vankerkhove 2012 presentation
Barb vankerkhove 2012 presentationBarb vankerkhove 2012 presentation
Barb vankerkhove 2012 presentation
 
Distributing Video To The Masses
Distributing Video To The MassesDistributing Video To The Masses
Distributing Video To The Masses
 
Conneu 2011-myths
Conneu 2011-mythsConneu 2011-myths
Conneu 2011-myths
 
2010 Brand Z Top100 Report+
2010 Brand Z Top100 Report+2010 Brand Z Top100 Report+
2010 Brand Z Top100 Report+
 
NJ Future population changes in built out municipalities 7-2012
NJ Future population changes in built out municipalities 7-2012NJ Future population changes in built out municipalities 7-2012
NJ Future population changes in built out municipalities 7-2012
 

Similar to The Missing Piece in Clean Local Energy

Raddon Chart of the Day, December 20, 2011
Raddon Chart of the Day, December 20, 2011Raddon Chart of the Day, December 20, 2011
Raddon Chart of the Day, December 20, 2011Raddon Financial Group
 
ING-International Surveys- Savings Attitude
ING-International Surveys- Savings AttitudeING-International Surveys- Savings Attitude
ING-International Surveys- Savings Attitude
INGVysyaBank
 
Raddon Chart of the Day, December 22, 2011
Raddon Chart of the Day, December 22, 2011Raddon Chart of the Day, December 22, 2011
Raddon Chart of the Day, December 22, 2011Raddon Financial Group
 
NVAR Spring Forecast - TJ Doyle
NVAR Spring Forecast - TJ DoyleNVAR Spring Forecast - TJ Doyle
NVAR Spring Forecast - TJ Doyle
NVAR .com
 
Assessing and monitoring water services in ghana findings for the ghana baseline
Assessing and monitoring water services in ghana findings for the ghana baselineAssessing and monitoring water services in ghana findings for the ghana baseline
Assessing and monitoring water services in ghana findings for the ghana baseline
IRC
 
The Arab Region in the New Internet World
The Arab Region in the New Internet World The Arab Region in the New Internet World
The Arab Region in the New Internet World
OneWebDay, Inc.
 
The Arab Region in the New Internet World
The Arab Region in the New Internet WorldThe Arab Region in the New Internet World
BMW – A Future Vision for Sustainable Electric Mobility (http://bit.ly/Join-E...
BMW – A Future Vision for Sustainable Electric Mobility (http://bit.ly/Join-E...BMW – A Future Vision for Sustainable Electric Mobility (http://bit.ly/Join-E...
BMW – A Future Vision for Sustainable Electric Mobility (http://bit.ly/Join-E...
Paul Stith
 
Eduventures
EduventuresEduventures
Monarch E-Cycler Results
Monarch E-Cycler ResultsMonarch E-Cycler Results
Monarch E-Cycler Results
smallwhiteflower
 
Genome Olympics viewing habits
Genome Olympics viewing habitsGenome Olympics viewing habits
Genome Olympics viewing habitsMaria Pousa
 
Asean connectivity marketbyvivekvaidya
Asean connectivity marketbyvivekvaidyaAsean connectivity marketbyvivekvaidya
Asean connectivity marketbyvivekvaidyaTsuguo Nobe
 
Transition Network Conference 2012 - Community Energy Workshop - Ovesco
Transition Network Conference 2012 - Community Energy Workshop - OvescoTransition Network Conference 2012 - Community Energy Workshop - Ovesco
Transition Network Conference 2012 - Community Energy Workshop - Ovesco
Transition Network
 
Cisco Candidate Survey Report Winter 2012
Cisco Candidate Survey Report Winter 2012Cisco Candidate Survey Report Winter 2012
Cisco Candidate Survey Report Winter 2012
georgeleobarnes
 
1.the economist online may 2012
1.the economist online may 20121.the economist online may 2012
1.the economist online may 2012Ajay Chavan
 
11 trends for 2011-phd
11 trends for 2011-phd 11 trends for 2011-phd
11 trends for 2011-phd mali_svet
 
Amd product launch event oem presentation
Amd product launch event oem presentationAmd product launch event oem presentation
Amd product launch event oem presentationArno Hegemann van Loo
 
2005 - 5th Us Analyst Investors Meeting Commercial Airline Market
2005 - 5th Us Analyst Investors Meeting   Commercial Airline Market2005 - 5th Us Analyst Investors Meeting   Commercial Airline Market
2005 - 5th Us Analyst Investors Meeting Commercial Airline MarketEmbraer RI
 

Similar to The Missing Piece in Clean Local Energy (20)

Raddon Chart of the Day, December 20, 2011
Raddon Chart of the Day, December 20, 2011Raddon Chart of the Day, December 20, 2011
Raddon Chart of the Day, December 20, 2011
 
ING-International Surveys- Savings Attitude
ING-International Surveys- Savings AttitudeING-International Surveys- Savings Attitude
ING-International Surveys- Savings Attitude
 
Raddon Chart of the Day, December 22, 2011
Raddon Chart of the Day, December 22, 2011Raddon Chart of the Day, December 22, 2011
Raddon Chart of the Day, December 22, 2011
 
NVAR Spring Forecast - TJ Doyle
NVAR Spring Forecast - TJ DoyleNVAR Spring Forecast - TJ Doyle
NVAR Spring Forecast - TJ Doyle
 
Assessing and monitoring water services in ghana findings for the ghana baseline
Assessing and monitoring water services in ghana findings for the ghana baselineAssessing and monitoring water services in ghana findings for the ghana baseline
Assessing and monitoring water services in ghana findings for the ghana baseline
 
The Arab Region in the New Internet World
The Arab Region in the New Internet World The Arab Region in the New Internet World
The Arab Region in the New Internet World
 
The Arab Region in the New Internet World
The Arab Region in the New Internet WorldThe Arab Region in the New Internet World
The Arab Region in the New Internet World
 
BMW – A Future Vision for Sustainable Electric Mobility (http://bit.ly/Join-E...
BMW – A Future Vision for Sustainable Electric Mobility (http://bit.ly/Join-E...BMW – A Future Vision for Sustainable Electric Mobility (http://bit.ly/Join-E...
BMW – A Future Vision for Sustainable Electric Mobility (http://bit.ly/Join-E...
 
Eduventures
EduventuresEduventures
Eduventures
 
Monarch E-Cycler Results
Monarch E-Cycler ResultsMonarch E-Cycler Results
Monarch E-Cycler Results
 
Genome Olympics viewing habits
Genome Olympics viewing habitsGenome Olympics viewing habits
Genome Olympics viewing habits
 
Asean connectivity marketbyvivekvaidya
Asean connectivity marketbyvivekvaidyaAsean connectivity marketbyvivekvaidya
Asean connectivity marketbyvivekvaidya
 
Excel
ExcelExcel
Excel
 
Transition Network Conference 2012 - Community Energy Workshop - Ovesco
Transition Network Conference 2012 - Community Energy Workshop - OvescoTransition Network Conference 2012 - Community Energy Workshop - Ovesco
Transition Network Conference 2012 - Community Energy Workshop - Ovesco
 
Cisco Candidate Survey Report Winter 2012
Cisco Candidate Survey Report Winter 2012Cisco Candidate Survey Report Winter 2012
Cisco Candidate Survey Report Winter 2012
 
1.the economist online may 2012
1.the economist online may 20121.the economist online may 2012
1.the economist online may 2012
 
11 trends for 2011-phd
11 trends for 2011-phd 11 trends for 2011-phd
11 trends for 2011-phd
 
Amd product launch event oem presentation
Amd product launch event oem presentationAmd product launch event oem presentation
Amd product launch event oem presentation
 
2005 - 5th Us Analyst Investors Meeting Commercial Airline Market
2005 - 5th Us Analyst Investors Meeting   Commercial Airline Market2005 - 5th Us Analyst Investors Meeting   Commercial Airline Market
2005 - 5th Us Analyst Investors Meeting Commercial Airline Market
 
Raddon Chart of the Day May 17, 2012
Raddon Chart of the Day May 17, 2012Raddon Chart of the Day May 17, 2012
Raddon Chart of the Day May 17, 2012
 

More from John Farrell

Which Costs Less? A Surprising Comparison of Utility-Scale, Community, and Ro...
Which Costs Less? A Surprising Comparison of Utility-Scale, Community, and Ro...Which Costs Less? A Surprising Comparison of Utility-Scale, Community, and Ro...
Which Costs Less? A Surprising Comparison of Utility-Scale, Community, and Ro...
John Farrell
 
Which Costs Less? A Surprising Comparison of Utility-Scale, Community, and Ro...
Which Costs Less? A Surprising Comparison of Utility-Scale, Community, and Ro...Which Costs Less? A Surprising Comparison of Utility-Scale, Community, and Ro...
Which Costs Less? A Surprising Comparison of Utility-Scale, Community, and Ro...
John Farrell
 
Community Power Opportunities
Community Power OpportunitiesCommunity Power Opportunities
Community Power Opportunities
John Farrell
 
Energy Self-Reliant States - 3rd edition
Energy Self-Reliant States - 3rd editionEnergy Self-Reliant States - 3rd edition
Energy Self-Reliant States - 3rd edition
John Farrell
 
Energy Democracy: How the deciders in the energy system are changing
Energy Democracy: How the deciders in the energy system are changingEnergy Democracy: How the deciders in the energy system are changing
Energy Democracy: How the deciders in the energy system are changing
John Farrell
 
Energy Democracy for Puerto Rico
Energy Democracy for Puerto RicoEnergy Democracy for Puerto Rico
Energy Democracy for Puerto Rico
John Farrell
 
Choosing the Electric Avenue: Unlocking Savings, Emissions Reductions, and Co...
Choosing the Electric Avenue: Unlocking Savings, Emissions Reductions, and Co...Choosing the Electric Avenue: Unlocking Savings, Emissions Reductions, and Co...
Choosing the Electric Avenue: Unlocking Savings, Emissions Reductions, and Co...
John Farrell
 
Reverse Power Flow: How solar+batteries shift electric grid decision making f...
Reverse Power Flow: How solar+batteries shift electric grid decision making f...Reverse Power Flow: How solar+batteries shift electric grid decision making f...
Reverse Power Flow: How solar+batteries shift electric grid decision making f...
John Farrell
 
Local Power for Decorah, Iowa
Local Power for Decorah, IowaLocal Power for Decorah, Iowa
Local Power for Decorah, Iowa
John Farrell
 
Local Power for the Local Economy
Local Power for the Local EconomyLocal Power for the Local Economy
Local Power for the Local Economy
John Farrell
 
A Vision for Minnesota Solar: Lessons and Barriers from the North Star State
A Vision for Minnesota Solar: Lessons and Barriers from the North Star StateA Vision for Minnesota Solar: Lessons and Barriers from the North Star State
A Vision for Minnesota Solar: Lessons and Barriers from the North Star State
John Farrell
 
ILSR's Energy Democracy Initiative Overview
ILSR's Energy Democracy Initiative OverviewILSR's Energy Democracy Initiative Overview
ILSR's Energy Democracy Initiative Overview
John Farrell
 
AERO Presentation: How Communities Use Clean Energy to Build Local Power
AERO Presentation: How Communities Use Clean Energy to Build Local PowerAERO Presentation: How Communities Use Clean Energy to Build Local Power
AERO Presentation: How Communities Use Clean Energy to Build Local Power
John Farrell
 
Will the Feds Preserve Electricity Market Competition?
Will the Feds Preserve Electricity Market Competition?Will the Feds Preserve Electricity Market Competition?
Will the Feds Preserve Electricity Market Competition?
John Farrell
 
Choosing the Electric Avenue - Webinar Presentation
Choosing the Electric Avenue - Webinar PresentationChoosing the Electric Avenue - Webinar Presentation
Choosing the Electric Avenue - Webinar Presentation
John Farrell
 
Choosing the Electric Avenue - Webinar Presentation
Choosing the Electric Avenue - Webinar PresentationChoosing the Electric Avenue - Webinar Presentation
Choosing the Electric Avenue - Webinar Presentation
John Farrell
 
February 2017 - NARUC Debate on Distributed Generation
February 2017 - NARUC Debate on Distributed GenerationFebruary 2017 - NARUC Debate on Distributed Generation
February 2017 - NARUC Debate on Distributed Generation
John Farrell
 
Is Bigger Best in Renewable Energy? Webinar Presentation
Is Bigger Best in Renewable Energy? Webinar PresentationIs Bigger Best in Renewable Energy? Webinar Presentation
Is Bigger Best in Renewable Energy? Webinar Presentation
John Farrell
 
Mighty Microgrids - BioCycle REFOR16 Presentation
Mighty Microgrids - BioCycle REFOR16 PresentationMighty Microgrids - BioCycle REFOR16 Presentation
Mighty Microgrids - BioCycle REFOR16 Presentation
John Farrell
 
Mighty Microgrids: How Small Grids Could Become a Big Deal
Mighty Microgrids: How Small Grids Could Become a Big DealMighty Microgrids: How Small Grids Could Become a Big Deal
Mighty Microgrids: How Small Grids Could Become a Big Deal
John Farrell
 

More from John Farrell (20)

Which Costs Less? A Surprising Comparison of Utility-Scale, Community, and Ro...
Which Costs Less? A Surprising Comparison of Utility-Scale, Community, and Ro...Which Costs Less? A Surprising Comparison of Utility-Scale, Community, and Ro...
Which Costs Less? A Surprising Comparison of Utility-Scale, Community, and Ro...
 
Which Costs Less? A Surprising Comparison of Utility-Scale, Community, and Ro...
Which Costs Less? A Surprising Comparison of Utility-Scale, Community, and Ro...Which Costs Less? A Surprising Comparison of Utility-Scale, Community, and Ro...
Which Costs Less? A Surprising Comparison of Utility-Scale, Community, and Ro...
 
Community Power Opportunities
Community Power OpportunitiesCommunity Power Opportunities
Community Power Opportunities
 
Energy Self-Reliant States - 3rd edition
Energy Self-Reliant States - 3rd editionEnergy Self-Reliant States - 3rd edition
Energy Self-Reliant States - 3rd edition
 
Energy Democracy: How the deciders in the energy system are changing
Energy Democracy: How the deciders in the energy system are changingEnergy Democracy: How the deciders in the energy system are changing
Energy Democracy: How the deciders in the energy system are changing
 
Energy Democracy for Puerto Rico
Energy Democracy for Puerto RicoEnergy Democracy for Puerto Rico
Energy Democracy for Puerto Rico
 
Choosing the Electric Avenue: Unlocking Savings, Emissions Reductions, and Co...
Choosing the Electric Avenue: Unlocking Savings, Emissions Reductions, and Co...Choosing the Electric Avenue: Unlocking Savings, Emissions Reductions, and Co...
Choosing the Electric Avenue: Unlocking Savings, Emissions Reductions, and Co...
 
Reverse Power Flow: How solar+batteries shift electric grid decision making f...
Reverse Power Flow: How solar+batteries shift electric grid decision making f...Reverse Power Flow: How solar+batteries shift electric grid decision making f...
Reverse Power Flow: How solar+batteries shift electric grid decision making f...
 
Local Power for Decorah, Iowa
Local Power for Decorah, IowaLocal Power for Decorah, Iowa
Local Power for Decorah, Iowa
 
Local Power for the Local Economy
Local Power for the Local EconomyLocal Power for the Local Economy
Local Power for the Local Economy
 
A Vision for Minnesota Solar: Lessons and Barriers from the North Star State
A Vision for Minnesota Solar: Lessons and Barriers from the North Star StateA Vision for Minnesota Solar: Lessons and Barriers from the North Star State
A Vision for Minnesota Solar: Lessons and Barriers from the North Star State
 
ILSR's Energy Democracy Initiative Overview
ILSR's Energy Democracy Initiative OverviewILSR's Energy Democracy Initiative Overview
ILSR's Energy Democracy Initiative Overview
 
AERO Presentation: How Communities Use Clean Energy to Build Local Power
AERO Presentation: How Communities Use Clean Energy to Build Local PowerAERO Presentation: How Communities Use Clean Energy to Build Local Power
AERO Presentation: How Communities Use Clean Energy to Build Local Power
 
Will the Feds Preserve Electricity Market Competition?
Will the Feds Preserve Electricity Market Competition?Will the Feds Preserve Electricity Market Competition?
Will the Feds Preserve Electricity Market Competition?
 
Choosing the Electric Avenue - Webinar Presentation
Choosing the Electric Avenue - Webinar PresentationChoosing the Electric Avenue - Webinar Presentation
Choosing the Electric Avenue - Webinar Presentation
 
Choosing the Electric Avenue - Webinar Presentation
Choosing the Electric Avenue - Webinar PresentationChoosing the Electric Avenue - Webinar Presentation
Choosing the Electric Avenue - Webinar Presentation
 
February 2017 - NARUC Debate on Distributed Generation
February 2017 - NARUC Debate on Distributed GenerationFebruary 2017 - NARUC Debate on Distributed Generation
February 2017 - NARUC Debate on Distributed Generation
 
Is Bigger Best in Renewable Energy? Webinar Presentation
Is Bigger Best in Renewable Energy? Webinar PresentationIs Bigger Best in Renewable Energy? Webinar Presentation
Is Bigger Best in Renewable Energy? Webinar Presentation
 
Mighty Microgrids - BioCycle REFOR16 Presentation
Mighty Microgrids - BioCycle REFOR16 PresentationMighty Microgrids - BioCycle REFOR16 Presentation
Mighty Microgrids - BioCycle REFOR16 Presentation
 
Mighty Microgrids: How Small Grids Could Become a Big Deal
Mighty Microgrids: How Small Grids Could Become a Big DealMighty Microgrids: How Small Grids Could Become a Big Deal
Mighty Microgrids: How Small Grids Could Become a Big Deal
 

The Missing Piece in Clean Local Energy

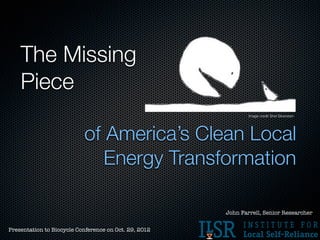
  • 1. The Missing Piece Image credit Shel Silverstein of America’s Clean Local Energy Transformation John Farrell, Senior Researcher Presentation to Biocycle Conference on Oct. 29, 2012
  • 2. How Much of Missouri’s Power from Rooftop Solar? ?% Residential and Commercial roofs
  • 3. How Much of Missouri’s Power from Rooftop Solar? 21% Residential and Commercial roofs
  • 4. How Much Power from Local, Rooftop Solar? 23% 21% 18% 24% 19% 19% 21% 24% 21% 23% 25% 22% 15% 14% 23% 23% 20% 12% 18% 24% 51% 21% 18% 20% 26% 38% 52% 41% 17% 19% 11% 24% 25% 21% 19% 28% 23% 49% 28% 19% 26% 24% 22% 20% 31% 23% 35% Potential Percent of Electricity 23% from Rooftop Solar PV 42% 0 to 10% 10 to 25% 25 to 50% 49% Residential and Commercial roofs 50 to 100%
  • 5. How Much Power from Local Wind? 116% 109% 297% 780% 27,000% 28,000% 311% 3200% 543% 912% 12% 35,000% 116% 14,000% 478% 3% 5200% 14% 1% 2% 97% 14,000% 541% 223% 11% 269% 52% 2900% 726% 2% 25% 9% 9700% 1500% 2% 3% 2% 95% 4100% 300% 8900% 4% 0% 2% 1% 10% 2500% Potential Percent of Electricity from Onshore Wind Power 0% 0 to 10% 0% 10 to 25% 25 to 50% 50 to 100% 0% 100 meters, 30% c.f. or better 100% or more
  • 6. How Much Power from Local Renewables? 32 states - 100%+ 9 states - 50%+ Potential Percent of Electricity from Renewables 0 to 10% 10 to 25% 25 to 50% 50 to 100% 100% or more
  • 7. Transformation Yesterday Tomorrow Centralized Power Clean, local power Solar PV power plant Storage Storage Transmission network Storage Storage House Local CHP plant Distribution network House with domestic CHP Wind power Factory Commercial plant building
  • 8. 10¢ •prevent blackouts 5¢ •reduce pollution •create jobs 0¢ 0¢ $4/Watt •on-site/near demand •lower transmission losses -5¢ •reduce dist. system stress •hedge against fuel prices •avoided cost -10¢ -15¢ 4¢ How the utility values distributed -20¢ -20¢ Cost of solar Energy value generation Grid benefits Social benefits Distributed Solar Power Worth Far More Than Electrons | Energy Self-Reliant States - http://tinyurl.com/3tqmerh
  • 9. 10¢ •prevent blackouts 5¢ •reduce pollution •create jobs 0¢ 0¢ •on-site/near demand •lower transmission losses -5¢ •reduce dist. system stress •hedge against fuel prices •avoided cost -10¢ 8.5¢ But it’s -15¢ 4¢ worth -20¢ -20¢ more Cost of solar Energy value Grid benefits Social benefits Distributed Solar Power Worth Far More Than Electrons | Energy Self-Reliant States - http://tinyurl.com/3tqmerh
  • 10. 10¢ and more •prevent blackouts 5¢ •reduce pollution •create jobs 0¢ •on-site/near demand 0¢ •lower transmission losses 12.4¢ -5¢ •reduce dist. system stress •hedge against fuel prices •avoided cost -10¢ 8.5¢ -15¢ 4¢ -20¢ -20¢ Cost of solar Energy value Grid benefits Social benefits Distributed Solar Power Worth Far More Than Electrons | Energy Self-Reliant States - http://tinyurl.com/3tqmerh
  • 11. It’s Real $0.15 $0.12 $0.09 $0.06 Local capacity value $0.03 7¢ Avoided transmission access Environmental Avoided transmission losses $0 Brown energy replacement Palo Alto, CA, municipal utility Feed-In Tariff for PV in Palo Alto, Calif. Imminent: http://tinyurl.com/72sxgsb
  • 12. It’s Real $0.15 } $0.12 6¢ per kWh $0.09 in addition to electricity $0.06 Local capacity value $0.03 7¢ Avoided transmission access Environmental Avoided transmission losses $0 Brown energy replacement Palo Alto, CA, municipal utility Feed-In Tariff for PV in Palo Alto, Calif. Imminent: http://tinyurl.com/72sxgsb
  • 13. Jobs per Megawatt Solar PV Wind Coal Natural Gas 0 2 4 6 8 10 Construction, manufacturing, and installation Ongoing maintenance and fuel Putting Renewables to Work: How Many Jobs Can the Clean Energy Industry Create? (UC Berkeley)
  • 14. Local Economic Impact Not local Up to 3.4x higher Local ownership Economic Development Impacts of Community Wind Projects: A Review and Empirical Evaluation (NREL)
  • 15. Not local -44% +77% net approval Local Ownership +33% 0 25 50 75 100 very negative negative neutral positive very positive Attitude towards increased use of local wind energy
  • 16. Jobs Clean, Local Energy Votes Money Photo credits: (wind) Flickr user ali_pk, (solar, above) Ian-S, (solar, below) MN CERTS, (money) Flickr user epSos.de
  • 17. Image credit Shel Silverstein
  • 19. Biogas or Biomass CHP http://www.abc.net.au/science/articles/2010/12/02/3081889.htm
  • 20.
  • 21. What’s Missing? Renewable energy policy 17% Solar/wind electricity 10%
  • 22. Current RE policy 17% Solar/wind electricity 10% Geothermal electricity Micro hydropower
  • 23. Current RE policy 17% Solar/wind electricity 10% Geothermal electricity Micro hydropower Ground-source geothermal Solar heat (e.g. hot water)
  • 24. Current RE policy 17% Solar/wind electricity 10% Geothermal electricity Micro hydropower Ground-source geothermal Solar heat (e.g. hot water) Biomass CHP Biogas Heat
  • 25. Current RE policy 17% Solar/wind electricity 10% Geothermal electricity Micro hydropower Ground-source geothermal 100% Solar heat (e.g. hot water) 100% Biomass CHP Biogas Heat Biogas Fuel Cells Renewable NG
  • 26.
  • 27. States with Renewable Heat Policies An Overview of Renewable Heating in the United States: Policy and Market Trends
  • 28. States with Renewable Heat Policies (that offset non-electricity) An Overview of Renewable Heating in the United States: Policy and Market Trends
  • 29. Biogas Policies Biogas Energy CLEAN Contracts (Feed-In Tariffs) Electricity, Heat, and Cogeneration Enhanced Renewable Electricity Standards Pipeline Renewable Renewable Natural Natural Gas Gas Standards Biogas: Rethinking the Midwest’s Potential
  • 30. What’s Missing? Biogas and Biomass for: Flexible electricity Renewable heat Look for success: Germany, Denmark