The Importance of Visualisation – Mapping the Way Forward

Maps are more than just diagrams of the route from A to B – to draw one is to bring together the whole view of our surrounding world so that we can gain a better understanding of it. Even a single, simple example has the ability to delight, unsettle and reveal truths. In politically-charged environments an objective visual map can reinforce, influence or challenge held perceptions and beliefs, making them a vital tool in designing pliable, people-focused content systems that are fit for purpose. Their proactive and reactive qualities force ourselves and others to see things as they really are; to contemplate the relationship between them and how they vary together. Presented at the Content Strategy Forum 2013 in Helsinki, Finland on 13th September 2013.

Recommended
Recommended
More Related Content
Similar to The Importance of Visualisation – Mapping the Way Forward
Similar to The Importance of Visualisation – Mapping the Way Forward (19)
Recently uploaded
Recently uploaded (20)
The Importance of Visualisation – Mapping the Way Forward
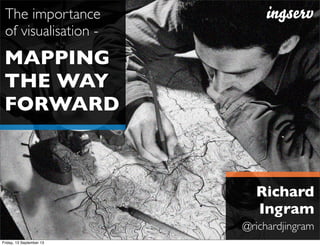
- 1. MAPPING THE WAY FORWARD The importance of visualisation - Richard Ingram @richardjingram Friday, 13 September 13
- 2. ©TrusteesoftheBritish Museum Babylonian map of the world Clay tablet, probably from Sippar, southern Iraq (c.700-500 BC) Babylon Friday, 13 September 13
- 3. ©TrusteesoftheBritish Museum Hereford Mappa Mundi (‘Sheet of the World’) Inked parchment, the largest medieval map known to still exist (c.1300) London Edinburgh Friday, 13 September 13
- 4. Friday, 13 September 13
- 6. Administrative Social Friday, 13 September 13
- 7. Administrative Social Military Friday, 13 September 13
- 8. Administrative Social Military Political Friday, 13 September 13
- 9. Walt Disney’s business map,1957 Depicts a central film asset and its supporting entertainment assets Friday, 13 September 13
- 10. Growth of Las Vegas, NV 1984–2012 Google Earth timelapse constructed from satellite imagery Friday, 13 September 13
- 11. Radial hierarchical organisation structure About as complex and contradictory as its name suggests Friday, 13 September 13
- 12. John Rocque's map of London, 1746 Rocque deliberately left out the city’s unsavoury elements Friday, 13 September 13
- 13. John Rocque's map of London, 1746 Rocque deliberately left out the city’s unsavoury elements Friday, 13 September 13
- 14. John Rocque's map of London, 1746 Rocque deliberately left out the city’s unsavoury elements Friday, 13 September 13
- 15. Map of organisation-wide content distribution Or that giant hairball the cat coughed up yesterday. Equally yucky. Friday, 13 September 13
- 16. MAPPING OUT A STORY Beyond physical geography - Friday, 13 September 13
- 17. Wabash river Ohio river Mississippi river ©TrusteesoftheBritish Museum Native North American buckskin map Possibly used in land negotiations with the British (c.1744) Friday, 13 September 13
- 18. Distribution Distance Overlap Direction N A B C A B Friday, 13 September 13
- 19. LIGHT HEAT SUN gives gives Exploded view Concept map Different maps, same basic building blocks Friday, 13 September 13
- 20. Topological map Star map Different maps, same basic building blocks Friday, 13 September 13
- 21. North South EastWest Find your coordinate system Anything can be mapped using pairs of opposites Friday, 13 September 13
- 22. Expensive Cheap Slow Fast Find your coordinate system Anything can be mapped using pairs of opposites Friday, 13 September 13
- 23. High Low Small Large Find your coordinate system Anything can be mapped using pairs of opposites Friday, 13 September 13
- 24. N Plot your landmarks Start with the most prominent feature, then move outward Friday, 13 September 13
- 25. N Plot your landmarks Start with the most prominent feature, then move outward Friday, 13 September 13
- 26. N Plot your landmarks Start with the most prominent feature, then move outward Friday, 13 September 13
- 27. FINDING OUR WAY The unfamiliar environment - Friday, 13 September 13
- 28. Content ProcessesPeople Tackling that complex trinity Content governance is an important tool for this end Friday, 13 September 13
- 29. web
- 30. site? We
- 31. use
- 32. ‘website’ Oh
- 33. well
- 34. ... ✓ ✗ Maintaining content consistency is hard Particularly when many contributors have other responsibilities Style
- 35. query Content
- 36. Control
- 37. filter Publish
- 38. to
- 40. Regional English Council Approx. 15,000 staff 7 departments Serving approx. 700,000 people Scenario: Design a new content workflow Friday, 13 September 13
- 41. Digital Services department (Our heroes) Our varied, siloed environment Some departments are responsible for 100s of pages, while others only a few Friday, 13 September 13
- 42. Follow
- 43. me! Map Expert guide (Mandy) Our varied, siloed environment How to find our bearings in unfamiliar surroundings Friday, 13 September 13
- 44. Our varied, siloed environment To discover how content decisions are made and how they could be improved, we need to figure out who best to talk to Mandy ? ?? ? ? Friday, 13 September 13
- 45. Let’s map our environment Digital Services Chief Executive's Corporate
- 50. and
- 52. Planning We’ll begin by marking out each of the seven departments Friday, 13 September 13
- 53. LargeSmall Fast Slow Let’s devise our coordinate system Digital Services Chief Executive's Corporate
- 58. and
- 61. LargeSmall Fast Slow We’re on the move! What can we see? Digital Services Chief Executive's Corporate
- 66. and
- 69. LargeSmall Fast Slow We’re on the move! What can we see? Digital Services Chief Executive's Corporate
- 74. and
- 79. Planning Adults
- 82. Resources Let’s map those pathways Environment
- 83. and
- 87. Planning Adults
- 90. Resources What can our marked pathways tell us? Environment
- 91. and
- 95. Planning Adults
- 98. Resources Where are the opportunities for improvement? Environment
- 99. and
- 100. Transport Friday, 13 September 13
- 103. Planning Adults
- 106. Resources Our map: Simple, but effective Environment
- 107. and
- 108. Transport Friday, 13 September 13
- 109. MAPPING OUT A PROCESS The unfamiliar environment - Friday, 13 September 13
- 110. Requirements for an effective CMS workflow Meet the needs of the organisation and your content players Friday, 13 September 13
- 111. Conducting content player interviews Ask them to walk you through several different content creation and publishing scenarios Digital Services Mandy Content Officer Friday, 13 September 13
- 112. The ensuing conversation Mandy talks us through the typical process for publishing a press release on the council website On
- 113. Monday
- 114. I
- 115. received
- 116. a
- 117. request
- 118. from
- 119. John,
- 120. Highways
- 121. Manager
- 122. at
- 123. the
- 124. Environment
- 125. and
- 126. Transport
- 127. department,
- 128. to
- 129. publish
- 130. a
- 131. press
- 132. release
- 133. to
- 134. inform
- 135. the
- 136. community
- 137. of
- 138. the
- 139. start
- 140. of
- 141. major
- 142. road
- 143. improvement
- 144. work. I
- 145. first
- 146. called
- 147. Helen,
- 148. Technical
- 149. Services
- 150. Manager
- 151. at
- 152. the
- 153. Environment
- 154. and
- 155. Transport
- 156. department,
- 157. who
- 158. emailed
- 159. through
- 160. the
- 161. source
- 162. material
- 163. and
- 164. directed
- 165. me
- 166. on
- 167. the
- 168. technical
- 169. details
- 170. that
- 171. needed
- 172. to
- 173. be
- 174. included. Friday, 13 September 13
- 175. The ensuing conversation cont. Mandy talks us through the typical process for publishing a press release on the council website After
- 176. completing
- 177. the
- 178. draft
- 179. in
- 180. the
- 181. CMS
- 182. environment,
- 183. I
- 184. marked
- 185. the
- 186. press
- 187. release
- 188. as
- 189. 'ready
- 190. for
- 191. review'
- 192. and
- 193. emailed
- 194. Rachael,
- 195. a
- 196. Content
- 197. Manager
- 198. and
- 199. colleague
- 200. in
- 201. the
- 202. Digital
- 203. Services
- 204. team,
- 205. and
- 206. Helen
- 207. again
- 208. for
- 209. their
- 210. feedback.
- 211. After
- 212. one
- 213. or
- 214. two
- 215. line
- 216. edits,
- 217. I
- 218. was
- 219. ready
- 220. to
- 221. mark
- 222. the
- 223. press
- 224. release
- 225. as
- 226. 'ready
- 227. for
- 228. publishing',
- 229. so
- 230. I
- 231. emailed
- 232. David,
- 233. a
- 234. Digital
- 235. Media
- 236. Officer
- 237. to
- 238. prepare
- 239. and
- 240. publish
- 241. the
- 242. press
- 243. release
- 244. to
- 245. the
- 246. test
- 247. server. Friday, 13 September 13
- 248. The ensuing conversation cont. Mandy is still talking us through the typical process for publishing a press release on the council website John,
- 249. Helen
- 250. and
- 251. Rachael
- 252. were
- 253. all
- 254. emailed
- 255. to
- 256. help
- 257. me
- 258. perform
- 259. a
- 260. second
- 261. review
- 262. of
- 263. the
- 264. content,
- 265. where
- 266. they
- 267. duly
- 268. approved
- 269. its
- 270. publishing
- 271. to
- 272. the
- 273. public
- 274. website.
- 275. David
- 276. then
- 277. got
- 278. all
- 279. the
- 280. glory
- 281. as
- 282. usual
- 283. by
- 284. hitting
- 285. the
- 286. button
- 287. marked
- 288. 'publish'. I’m
- 289. completely
- 290. lost.
- 291. Let’s
- 292. make
- 293. a
- 294. map. Friday, 13 September 13
- 295. Who are the players in our story? Mandy Content
- 298. Services
- 301. Media
- 302. Officer Friday, 13 September 13
- 303. Mandy Content
- 306. Services
- 309. Media
- 310. Officer Environment
- 311. and
- 312. TransportDigital
- 313. Services MAKE
- 315. TO
- 316. TEST SERVER REVIEW
- 317. APPROVE REVIEW
- 318. APPROVE REVIEW
- 320. TO
- 321. WEB Friday, 13 September 13
- 322. Mandy Content
- 325. Services
- 328. Media
- 329. Officer Environment
- 330. and
- 331. TransportDigital
- 332. Services MAKE
- 334. TO
- 335. TEST SERVER REVIEW
- 336. APPROVE REVIEW
- 337. APPROVE REVIEW
- 339. TO
- 340. WEB Friday, 13 September 13
- 341. Mandy Content
- 344. Services
- 347. Media
- 348. Officer Environment
- 349. and
- 350. TransportDigital
- 351. Services MAKE
- 353. TO
- 354. TEST SERVER REVIEW
- 355. APPROVE REVIEW
- 356. APPROVE REVIEW
- 358. TO
- 359. WEB Friday, 13 September 13
- 360. Mandy Content
- 363. Services
- 366. Media
- 367. Officer Environment
- 368. and
- 369. TransportDigital
- 370. Services MAKE
- 372. TO
- 373. TEST SERVER REVIEW
- 374. APPROVE REVIEW
- 375. APPROVE REVIEW
- 377. TO
- 378. WEB WHY
- 379. THE
- 380. DELAYS? Friday, 13 September 13
- 381. Mandy Content
- 384. Services
- 387. Media
- 388. Officer Environment
- 389. and
- 390. TransportDigital
- 391. Services MAKE
- 393. TO
- 394. TEST SERVER REVIEW
- 395. APPROVE REVIEW
- 396. APPROVE REVIEW
- 398. TO
- 399. WEB CMS
- 403. Planning Adults
- 406. Resources Breaking down the department Environment
- 407. and
- 409. Services
- 410. Manager Friday, 13 September 13
- 413. Planning Adults
- 416. Resources Why is John’s sub-department failing? Environment
- 417. and
- 419. Services
- 421. Manager I
- 422. have
- 423. no
- 424. access
- 425. to
- 426. the
- 427. central
- 428. CMS! Friday, 13 September 13
- 431. Planning Adults
- 434. Resources CMS workarounds adding unnecessary time and cost Environment
- 435. and
- 437. Services
- 439. Manager I
- 440. have
- 441. no
- 442. access
- 443. to
- 444. the
- 445. central
- 446. CMS! Friday, 13 September 13
- 449. Planning Adults
- 452. Resources Where else could improvements be made? Environment
- 453. and
- 454. Transport Community
- 458. and
- 459. Transport Adults
- 461. Communities SPEED
- 462. UP
- 463. PROCESSES =
- 465. MAPPING THE WAY FORWARD The power of drawing - Friday, 13 September 13
- 466. Remember: We are not completely bound by what has happened before Content ProcessesPeople Balancing that complex trinity Friday, 13 September 13
- 467. Suggestion: let’s not always rely on the old established categories, we can always invent new ones New ideas won’t always fit neatly
- 472. ?!? Friday, 13 September 13
- 473. Suggestion: let’s not always rely on the old established categories, we can always invent new ones New ideas won’t always fit neatly
- 478. Aha! Friday, 13 September 13
- 479. Suggestion: let’s all step away from our screens and draw together. Encourage those innate inventive qualities Friday, 13 September 13
- 480. Make use of basic shapes, arrows, and faces. Find your axis. Above all: Embrace your mistakes. Mapmaking is a basic human instinct Friday, 13 September 13
- 481. KIITOS ! / THANK YOU ! Richard Ingram @richardjingram ringram@ingserv.com www.ingserv.com +44 1424 205 383 Friday, 13 September 13
- 482. Communicating Design: Developing Web Site Documentation for Design and Planning by Dan M. Brown (@brownorama) You Are Here: Personal Geographies and Other Maps of the Imagination by Katharine Harmon Blah Blah Blah: What To Do When Words Don't Work by Dan Roam (@dan_roam) The Back of the Napkin: Solving Problems and Selling Ideas with Pictures by Dan Roam Maps of the Imagination: The Writer as Cartographer by PeterTurchi Recommended reading Friday, 13 September 13
- 483. You have been watching... David Helen John Mandy Me Mr
- 484. Ed Rachael Friday, 13 September 13