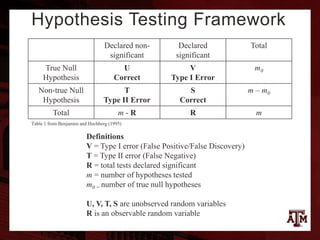
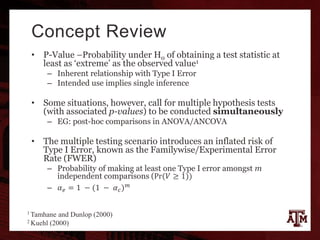
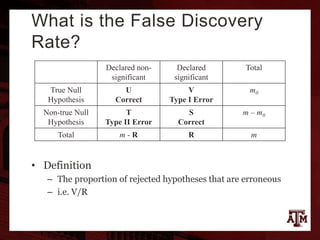
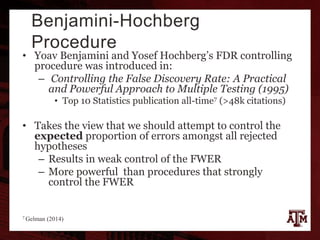
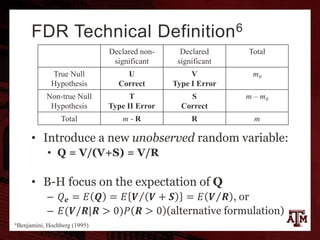
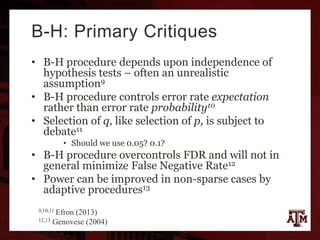
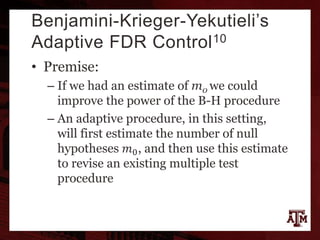
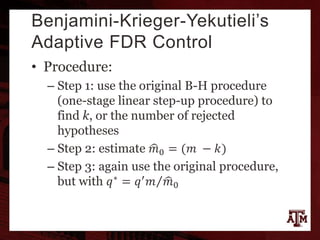
The False Discovery
Rate:
An OverviewPhilip Anderson
Contents
• Context: Multiple Comparisons
• FDR with Benjamini and Hochberg’s Procedure
– FDR Definition
– B-H Procedure Specification
– Examples
– Comparison
• B-H Critiques and Proposed Enhancements
– B-K-Y’s Adaptive Procedure
– Storey’s pFDR
– Efron’s Local FDR
– Genovese-Wasserman’s Exceedance Control
• Appendix
Context:
Multiple Comparisons
Hypothesis Testing Framework
Declared non-
significant
Declared
significant
Total
True Null
Hypothesis
U
Correct
V
Type I Error
m0
Non-true Null
Hypothesis
T
Type II Error
S
Correct
m – m0
Total m - R R m
Table 1 from Benjamini and Hochberg (1995)
Definitions
V = Type I error (False Positive/False Discovery)
T = Type II error (False Negative)
R = total tests declared significant
m = number of hypotheses tested
m0 = number of true null hypotheses
U, V, T, S are unobserved random variables
R is an observable random variable
Concept Review
• P-Value –Probability under H0 of obtaining a test statistic at
least as ‘extreme’ as the observed value1
– Inherent relationship with Type I Error
– Intended use implies single inference
• Some situations, however, call for multiple hypothesis tests
(with associated p-values) to be conducted simultaneously
– EG: post-hoc comparisons in ANOVA/ANCOVA
• The multiple testing scenario introduces an inflated risk of
Type I Error, known as the Familywise/Experimental Error
Rate (FWER)
– Probability of making at least one Type I error amongst m
independent comparisons (Pr(𝑉 ≥ 1))
– 𝛼 𝑒 = 1 − (1 − 𝛼 𝑐) 𝑚
1 Tamhane and Dunlop (2000)
2 Kuehl (2000)
FWER increases monotonically
in m
𝛼 𝑒 = 1 − (1 − 𝛼 𝑐) 𝑚
Familywise error a near-certainty
with large m
𝛼 𝑒 = 1 − (1 − 𝛼 𝑐) 𝑚
Methods of Controlling FWER
• Class 1: Single Step
• Example: Bonferroni Correction3
– Straightforward, popular, overly conservative
– 𝛼 𝐶 = 𝛼 𝐸 𝑚
• Class 2: Sequential (step-up/step-down)
• Example: Holm-Bonferroni method4
– Procedural approach that orders the p-values and finds minimal
index such that
• 𝑃𝑘 > ∝ (𝑚 + 1 − 𝑘)
– Uniformly more powerful than Bonferroni method
• Many more examples exist5:
– Sidak, Scheffe, Hsu’s Best, Dunnet, Tukey’s HSD, etc.
3,5 Tamhane, Dunlop (2000)
4 Holm-Bonferroni (2018)
Methods of Controlling FWER
• Caveat: all of these methods were designed for a
handful of multiple comparisons
• Today’s data collection environment can produce
previously unimaginable situations
• What do we do if we find ourselves with hundreds
(or thousands!) of hypothesis tests?
– Control the False Discovery Rate (FDR)
FDR
with Benjamini and
Hochberg’s Procedure
What is the False Discovery
Rate?
• Definition
– The proportion of rejected hypotheses that are erroneous
– i.e. V/R
Declared non-
significant
Declared
significant
Total
True Null
Hypothesis
U
Correct
V
Type I Error
m0
Non-true Null
Hypothesis
T
Type II Error
S
Correct
m – m0
Total m - R R m
Benjamini-Hochberg
Procedure
• Yoav Benjamini and Yosef Hochberg’s FDR controlling
procedure was introduced in:
– Controlling the False Discovery Rate: A Practical
and Powerful Approach to Multiple Testing (1995)
• Top 10 Statistics publication all-time7 (>48k citations)
• Takes the view that we should attempt to control the
expected proportion of errors amongst all rejected
hypotheses
– Results in weak control of the FWER
– More powerful than procedures that strongly
control the FWER
7 Gelman (2014)
FDR Technical Definition6
• Introduce a new unobserved random variable:
• Q = V/(V+S) = V/R
• B-H focus on the expectation of Q
– 𝑄 𝒆 = 𝐸 𝑸 = 𝐸 𝑽 𝑽 + 𝑺 = 𝐸 𝑽 𝑹 , or
– 𝐸(𝑽/𝑹|𝑹 > 0)𝑃 𝑹 > 0 (alternative formulation)
Declared non-
significant
Declared
significant
Total
True Null
Hypothesis
U
Correct
V
Type I Error
m0
Non-true Null
Hypothesis
T
Type II Error
S
Correct
m – m0
Total m - R R m
6Benjamini, Hochberg (1995)
B-H Procedure Specification
1. Order a given array of m unadjusted
p-values generated from m
hypothesis tests
2. Let k be the largest i for which
𝑃(𝑖) ≤
𝑖
𝑚
𝑞∗
3. Reject all 𝐻𝑖 for 𝑖 ∈ (1, 2, … 𝑘)
Example 1: B-H Procedure
Demonstration
• Full code in:
https://github.com/panders225/final-lecture/blob/master/BH_FDR_Example_one.ipynb
B-H Comparisons with
contemporary methods
• B-H (1995) conducted a power test to evaluate
how their procedure compared to other (at
the time) leading FWER control methods
(Bonferroni and Hochberg (1988)) across a
variety of scenarios
• Conclusions
– The statistical power of the B-H FDR procedure
is uniformly larger than the 2 FWER methods
– The advantage of B-H FDR increases with m
B-H Comparisons with
contemporary methods8
B-H = solid line
B-H uniformly more
powerful than
contemporary methods
across all scenarios
8Benjamini-Hochberg (1995)
B-H Critiques and
Proposed
Enhancements
B-H: Primary Critiques
• B-H procedure depends upon independence of
hypothesis tests – often an unrealistic
assumption9
• B-H procedure controls error rate expectation
rather than error rate probability10
• Selection of q, like selection of p, is subject to
debate11
• Should we use 0.05? 0.1?
• B-H procedure overcontrols FDR and will not in
general minimize False Negative Rate12
• Power can be improved in non-sparse cases by
adaptive procedures13
9,10,11 Efron (2013)
12,13 Genovese (2004)
Benjamini-Krieger-Yekutieli’s
Adaptive FDR Control10
• Premise:
– If we had an estimate of m0 we could
improve the power of the B-H procedure
– An adaptive procedure, in this setting,
will first estimate the number of null
hypotheses 𝑚0, and then use this estimate
to revise an existing multiple test
procedure
Benjamini-Krieger-Yekutieli’s
Adaptive FDR Control
• Procedure:
– Step 1: use the original B-H procedure
(one-stage linear step-up procedure) to
find k, or the number of rejected
hypotheses
– Step 2: estimate 𝑚0 = (𝑚 − 𝑘)
– Step 3: again use the original procedure,
but with 𝑞∗ = 𝑞′ 𝑚 𝑚0
Benjamini-Krieger-Yekutieli’s
Adaptive FDR Control
• Outcome14:
– B-K-Y more powerful than B-H when a
considerable percentage of the
hypotheses under consideration are false
– B-K-Y slightly less powerful than B-H
when there are very few false hypotheses
14Groppe (2012)
Storey’s positive FDR (pFDR)
• B-H procedure fixes 𝛼 and estimates 𝑘 (the
rejection region)
• Storey does the opposite, fixing the rejection
region and then estimating 𝛼 15
– In other words, Storey tries to control the
probability that the null hypothesis is true, given
that the test rejected the null
15 Goldman (2008)
16Storey (2002)
𝐹𝐷𝑅 = 𝐸
𝑉
𝑅
𝑅 > 0 𝑃𝑟 𝑅 > 0
𝑝𝐹𝐷𝑅 = 𝐸
𝑉
𝑅
𝑅 > 0
“positive” derived from conditioning that
positive findings have occurred16
Storey’s positive FDR (pFDR)
• Storey also introduced the pFDR analogue of
the p-value, which he termed the q-value
• The q-value is the expected proportion of
false positives among all features as or more
extreme than the observed one17,18
– e.g.: a q-value of 5% indicates that 5% of
significant results will result in false positives
• With Storey’s notation
– 𝑝 − 𝑣𝑎𝑙𝑢𝑒 𝑡 = {Γ:𝑡∈Γ}
𝑚𝑖𝑛
𝑃𝑟 𝑇 ∈ Γ 𝐻 = 0
– 𝑞 𝑡 = {Γ:𝑡∈Γ}
inf
𝑝𝐹𝐷𝑅(Γ)
17 Mailman (2018)
18 Storey (2010)
Storey’s positive FDR (pFDR)
• Data pulled from Example 1
• 5% of everything above
record 6 is a false positive
• More tangible for larger
examples
• pFDR approach generally
more powerful than B-H
approach
https://github.com/panders225/final-lecture/blob/master/q_value_r_eg.R
Local FDR
• The estimated local FDR of a given test is the
empirical Bayesian posterior probability that
the null hypothesis is true, conditional on the
observed p-value19, 20
• 𝑓𝑑𝑟 𝑧 = 𝑃𝑟 𝑛𝑢𝑙𝑙 𝑧 = 𝜋0 𝑓0(𝑧) 𝑓(𝑧)
– 𝜋0 = 𝑃𝑟 𝑛𝑢𝑙𝑙
– 𝜋1 = 𝑃𝑟 𝑛𝑜𝑛 − 𝑛𝑢𝑙𝑙
– 𝑓0 𝑧 = 𝑛𝑢𝑙𝑙 𝑑𝑒𝑛𝑠𝑖𝑡𝑦
– 𝑓1 𝑧 = 𝑛𝑜𝑛 − 𝑛𝑢𝑙𝑙 𝑑𝑒𝑛𝑠𝑖𝑡𝑦
19 Storey et al. (2015)
20 Efron (2013)
Efron’s Local FDR
• EG: Record 4 has a 11%
chance of being a false
positive
https://github.com/panders225/final-lecture/blob/master/q_value_r_eg.R
Genovese-Wasserman
Exceedance/False Discovery
Control21
• Views FDR as Expected Value of False Discovery
Proportion (FDP)
– i.e. FDR = E(FDP)
• Exceedance control attempts to bound Pr(𝐹𝐷𝑃 >
𝛾), rather than the expectation
• Motivation:
– We have variability of the FDP about its mean
– Controlling FDR permits large deviations in FDP
with high probability
– Through exceedance control, we bound the
probability of these large deviations
– Decrease in power, but stronger constraint on tail
behavior
21 Genovese, Wasserman
FDR Control Methods Pros and
Cons
Method Pro Con
Benjamini-Hochberg Popular, Straightforward
Recent procedures more
powerful
Benjamini-Krieger-
Yekutieli Adaptive
Procedure
More powerful than B-H
when many hypotheses
are false
Less powerful than B-H
when few hypotheses are
false
pFDR More powerful than B-H
Computationally
intensive, fewer software
implementations
Local FDR
Intuitive probabilistic
interpretation
Stakeholders may not
hold Bayesian literacy
Exceedance Control
Constraint on tail
behavior in FDP statistic
Less powerful than B-H
Thank You
Appendix
References
Benjamini, Y. and Hochberg, Y. (1995). Controlling the False Discovery Rate: A Practical and Powerful
Approach to Multiple Testing. Journal of the Royal Statistical Society. Series B (Methodological), Vol. 57,
No. 1 (1995), pp. 289-300
Benjamini, Y., Krieger, A.M., Yekutieli, D. Adaptive Linear Step-Up Procedures that control the False
Discovery Rate (2006). Biometrika, Volume 93, Issue 3, 1 September 2006, Pages 491–507
Efron, B. Large Scale Inference: Empirical Bayes Methods for Estimation, Testing, Prediction (2013).
Cambridge University Press; Reprint Edition
Gelman, A. The most-cited statistics papers ever (2014). https://andrewgelman.com/2014/03/31/cited-
statistics-papers-ever/
Genovese, C.R., Wasserman, L. Exceedance Control of the False Discovery Proportion (2006). Journal of the
American Statistical Association Vol. 101, No. 476 (Dec., 2006), pp. 1408-1417
Genovese, C. R. (2004). A tutorial on false discovery control. Talk at Hannover Workshop.
http://www.stat.cmu.edu/~genovese/talks/hannover1-04.pdf
Goldman, M. (2008) Statistics for Bioinformatics course notes.
https://www.stat.berkeley.edu/~mgoldman/Section0402.pdf
Groppe, D. Two-stage Benjamini, Krieger, & (sic) Yekutieli FDR Procedure (2012). Mathworks File
Exchange. https://www.mathworks.com/matlabcentral/fileexchange/27423-two-stage-benjamini-
krieger-yekutieli-fdr-procedure
References
Holm-Bonferroni Method (accessed 2018). Wikipedia. https://en.wikipedia.org/wiki/Holm–
Bonferroni_method
Keuhl, R.O. Design of Experiments: Statistical Principles of Research Design and Analysis (2ed.). (2000).
Brooks/Cole CA
Mailman School of Public Health, Columbia University. False Discovery Rate (accessed 2018).
https://www.mailman.columbia.edu/research/population-health-methods/false-discovery-rate
Storey, J.D. A Direct Approach to False Disco0very Rates (2002). Journal of the Royal Statistical Society B
(2002) 64, Part 3, pp. 479-498.
Storey, J.D. False Discovery Rates (2010). Working Paper.
http://genomine.org/papers/Storey_FDR_2011.pdf
John D. Storey with contributions from Andrew J. Bass, Alan Dabney and David Robinson (2015). qvalue: Q-
value estimation for false discovery rate control. R package version 2.10.0.
http://github.com/jdstorey/qvalue
Tamhane, A.C. and Dunlop, D.D. (2000). Statistics and Data Analysis from Elementary to Intermediate.
Prentice Hall Upper Saddle River, NJ
Example 2: B-H with Large m
• Full code in:
https://github.com/panders225/final-lecture/blob/master/BH_FDR_Example_Two.ipynb
Notable Software
Implementations of FDR
Control• R
– Numerous: http://strimmerlab.org/notes/fdr.html
– https://bioconductor.org/packages/release/bioc/ht
ml/qvalue.html
• SAS
– PROC MULTTEST
• Python
– statsmodels.stats.multitest.multipletests
– sklearn.feature_selection.SelectFDR
• Stata
– https://www.stata-
journal.com/sjpdf.html?articlenum=st0209

The False Discovery Rate: An Overview

  • 1.
    The False Discovery Rate: AnOverviewPhilip Anderson
  • 2.
    Contents • Context: MultipleComparisons • FDR with Benjamini and Hochberg’s Procedure – FDR Definition – B-H Procedure Specification – Examples – Comparison • B-H Critiques and Proposed Enhancements – B-K-Y’s Adaptive Procedure – Storey’s pFDR – Efron’s Local FDR – Genovese-Wasserman’s Exceedance Control • Appendix
  • 3.
  • 4.
    Hypothesis Testing Framework Declarednon- significant Declared significant Total True Null Hypothesis U Correct V Type I Error m0 Non-true Null Hypothesis T Type II Error S Correct m – m0 Total m - R R m Table 1 from Benjamini and Hochberg (1995) Definitions V = Type I error (False Positive/False Discovery) T = Type II error (False Negative) R = total tests declared significant m = number of hypotheses tested m0 = number of true null hypotheses U, V, T, S are unobserved random variables R is an observable random variable
  • 5.
    Concept Review • P-Value–Probability under H0 of obtaining a test statistic at least as ‘extreme’ as the observed value1 – Inherent relationship with Type I Error – Intended use implies single inference • Some situations, however, call for multiple hypothesis tests (with associated p-values) to be conducted simultaneously – EG: post-hoc comparisons in ANOVA/ANCOVA • The multiple testing scenario introduces an inflated risk of Type I Error, known as the Familywise/Experimental Error Rate (FWER) – Probability of making at least one Type I error amongst m independent comparisons (Pr(𝑉 ≥ 1)) – 𝛼 𝑒 = 1 − (1 − 𝛼 𝑐) 𝑚 1 Tamhane and Dunlop (2000) 2 Kuehl (2000)
  • 6.
    FWER increases monotonically inm 𝛼 𝑒 = 1 − (1 − 𝛼 𝑐) 𝑚
  • 7.
    Familywise error anear-certainty with large m 𝛼 𝑒 = 1 − (1 − 𝛼 𝑐) 𝑚
  • 8.
    Methods of ControllingFWER • Class 1: Single Step • Example: Bonferroni Correction3 – Straightforward, popular, overly conservative – 𝛼 𝐶 = 𝛼 𝐸 𝑚 • Class 2: Sequential (step-up/step-down) • Example: Holm-Bonferroni method4 – Procedural approach that orders the p-values and finds minimal index such that • 𝑃𝑘 > ∝ (𝑚 + 1 − 𝑘) – Uniformly more powerful than Bonferroni method • Many more examples exist5: – Sidak, Scheffe, Hsu’s Best, Dunnet, Tukey’s HSD, etc. 3,5 Tamhane, Dunlop (2000) 4 Holm-Bonferroni (2018)
  • 9.
    Methods of ControllingFWER • Caveat: all of these methods were designed for a handful of multiple comparisons • Today’s data collection environment can produce previously unimaginable situations • What do we do if we find ourselves with hundreds (or thousands!) of hypothesis tests? – Control the False Discovery Rate (FDR)
  • 10.
  • 11.
    What is theFalse Discovery Rate? • Definition – The proportion of rejected hypotheses that are erroneous – i.e. V/R Declared non- significant Declared significant Total True Null Hypothesis U Correct V Type I Error m0 Non-true Null Hypothesis T Type II Error S Correct m – m0 Total m - R R m
  • 12.
    Benjamini-Hochberg Procedure • Yoav Benjaminiand Yosef Hochberg’s FDR controlling procedure was introduced in: – Controlling the False Discovery Rate: A Practical and Powerful Approach to Multiple Testing (1995) • Top 10 Statistics publication all-time7 (>48k citations) • Takes the view that we should attempt to control the expected proportion of errors amongst all rejected hypotheses – Results in weak control of the FWER – More powerful than procedures that strongly control the FWER 7 Gelman (2014)
  • 13.
    FDR Technical Definition6 •Introduce a new unobserved random variable: • Q = V/(V+S) = V/R • B-H focus on the expectation of Q – 𝑄 𝒆 = 𝐸 𝑸 = 𝐸 𝑽 𝑽 + 𝑺 = 𝐸 𝑽 𝑹 , or – 𝐸(𝑽/𝑹|𝑹 > 0)𝑃 𝑹 > 0 (alternative formulation) Declared non- significant Declared significant Total True Null Hypothesis U Correct V Type I Error m0 Non-true Null Hypothesis T Type II Error S Correct m – m0 Total m - R R m 6Benjamini, Hochberg (1995)
  • 14.
    B-H Procedure Specification 1.Order a given array of m unadjusted p-values generated from m hypothesis tests 2. Let k be the largest i for which 𝑃(𝑖) ≤ 𝑖 𝑚 𝑞∗ 3. Reject all 𝐻𝑖 for 𝑖 ∈ (1, 2, … 𝑘)
  • 15.
    Example 1: B-HProcedure Demonstration • Full code in: https://github.com/panders225/final-lecture/blob/master/BH_FDR_Example_one.ipynb
  • 16.
    B-H Comparisons with contemporarymethods • B-H (1995) conducted a power test to evaluate how their procedure compared to other (at the time) leading FWER control methods (Bonferroni and Hochberg (1988)) across a variety of scenarios • Conclusions – The statistical power of the B-H FDR procedure is uniformly larger than the 2 FWER methods – The advantage of B-H FDR increases with m
  • 17.
    B-H Comparisons with contemporarymethods8 B-H = solid line B-H uniformly more powerful than contemporary methods across all scenarios 8Benjamini-Hochberg (1995)
  • 18.
  • 19.
    B-H: Primary Critiques •B-H procedure depends upon independence of hypothesis tests – often an unrealistic assumption9 • B-H procedure controls error rate expectation rather than error rate probability10 • Selection of q, like selection of p, is subject to debate11 • Should we use 0.05? 0.1? • B-H procedure overcontrols FDR and will not in general minimize False Negative Rate12 • Power can be improved in non-sparse cases by adaptive procedures13 9,10,11 Efron (2013) 12,13 Genovese (2004)
  • 20.
    Benjamini-Krieger-Yekutieli’s Adaptive FDR Control10 •Premise: – If we had an estimate of m0 we could improve the power of the B-H procedure – An adaptive procedure, in this setting, will first estimate the number of null hypotheses 𝑚0, and then use this estimate to revise an existing multiple test procedure
  • 21.
    Benjamini-Krieger-Yekutieli’s Adaptive FDR Control •Procedure: – Step 1: use the original B-H procedure (one-stage linear step-up procedure) to find k, or the number of rejected hypotheses – Step 2: estimate 𝑚0 = (𝑚 − 𝑘) – Step 3: again use the original procedure, but with 𝑞∗ = 𝑞′ 𝑚 𝑚0
  • 22.
    Benjamini-Krieger-Yekutieli’s Adaptive FDR Control •Outcome14: – B-K-Y more powerful than B-H when a considerable percentage of the hypotheses under consideration are false – B-K-Y slightly less powerful than B-H when there are very few false hypotheses 14Groppe (2012)
  • 23.
    Storey’s positive FDR(pFDR) • B-H procedure fixes 𝛼 and estimates 𝑘 (the rejection region) • Storey does the opposite, fixing the rejection region and then estimating 𝛼 15 – In other words, Storey tries to control the probability that the null hypothesis is true, given that the test rejected the null 15 Goldman (2008) 16Storey (2002) 𝐹𝐷𝑅 = 𝐸 𝑉 𝑅 𝑅 > 0 𝑃𝑟 𝑅 > 0 𝑝𝐹𝐷𝑅 = 𝐸 𝑉 𝑅 𝑅 > 0 “positive” derived from conditioning that positive findings have occurred16
  • 24.
    Storey’s positive FDR(pFDR) • Storey also introduced the pFDR analogue of the p-value, which he termed the q-value • The q-value is the expected proportion of false positives among all features as or more extreme than the observed one17,18 – e.g.: a q-value of 5% indicates that 5% of significant results will result in false positives • With Storey’s notation – 𝑝 − 𝑣𝑎𝑙𝑢𝑒 𝑡 = {Γ:𝑡∈Γ} 𝑚𝑖𝑛 𝑃𝑟 𝑇 ∈ Γ 𝐻 = 0 – 𝑞 𝑡 = {Γ:𝑡∈Γ} inf 𝑝𝐹𝐷𝑅(Γ) 17 Mailman (2018) 18 Storey (2010)
  • 25.
    Storey’s positive FDR(pFDR) • Data pulled from Example 1 • 5% of everything above record 6 is a false positive • More tangible for larger examples • pFDR approach generally more powerful than B-H approach https://github.com/panders225/final-lecture/blob/master/q_value_r_eg.R
  • 26.
    Local FDR • Theestimated local FDR of a given test is the empirical Bayesian posterior probability that the null hypothesis is true, conditional on the observed p-value19, 20 • 𝑓𝑑𝑟 𝑧 = 𝑃𝑟 𝑛𝑢𝑙𝑙 𝑧 = 𝜋0 𝑓0(𝑧) 𝑓(𝑧) – 𝜋0 = 𝑃𝑟 𝑛𝑢𝑙𝑙 – 𝜋1 = 𝑃𝑟 𝑛𝑜𝑛 − 𝑛𝑢𝑙𝑙 – 𝑓0 𝑧 = 𝑛𝑢𝑙𝑙 𝑑𝑒𝑛𝑠𝑖𝑡𝑦 – 𝑓1 𝑧 = 𝑛𝑜𝑛 − 𝑛𝑢𝑙𝑙 𝑑𝑒𝑛𝑠𝑖𝑡𝑦 19 Storey et al. (2015) 20 Efron (2013)
  • 27.
    Efron’s Local FDR •EG: Record 4 has a 11% chance of being a false positive https://github.com/panders225/final-lecture/blob/master/q_value_r_eg.R
  • 28.
    Genovese-Wasserman Exceedance/False Discovery Control21 • ViewsFDR as Expected Value of False Discovery Proportion (FDP) – i.e. FDR = E(FDP) • Exceedance control attempts to bound Pr(𝐹𝐷𝑃 > 𝛾), rather than the expectation • Motivation: – We have variability of the FDP about its mean – Controlling FDR permits large deviations in FDP with high probability – Through exceedance control, we bound the probability of these large deviations – Decrease in power, but stronger constraint on tail behavior 21 Genovese, Wasserman
  • 29.
    FDR Control MethodsPros and Cons Method Pro Con Benjamini-Hochberg Popular, Straightforward Recent procedures more powerful Benjamini-Krieger- Yekutieli Adaptive Procedure More powerful than B-H when many hypotheses are false Less powerful than B-H when few hypotheses are false pFDR More powerful than B-H Computationally intensive, fewer software implementations Local FDR Intuitive probabilistic interpretation Stakeholders may not hold Bayesian literacy Exceedance Control Constraint on tail behavior in FDP statistic Less powerful than B-H
  • 30.
  • 31.
  • 32.
    References Benjamini, Y. andHochberg, Y. (1995). Controlling the False Discovery Rate: A Practical and Powerful Approach to Multiple Testing. Journal of the Royal Statistical Society. Series B (Methodological), Vol. 57, No. 1 (1995), pp. 289-300 Benjamini, Y., Krieger, A.M., Yekutieli, D. Adaptive Linear Step-Up Procedures that control the False Discovery Rate (2006). Biometrika, Volume 93, Issue 3, 1 September 2006, Pages 491–507 Efron, B. Large Scale Inference: Empirical Bayes Methods for Estimation, Testing, Prediction (2013). Cambridge University Press; Reprint Edition Gelman, A. The most-cited statistics papers ever (2014). https://andrewgelman.com/2014/03/31/cited- statistics-papers-ever/ Genovese, C.R., Wasserman, L. Exceedance Control of the False Discovery Proportion (2006). Journal of the American Statistical Association Vol. 101, No. 476 (Dec., 2006), pp. 1408-1417 Genovese, C. R. (2004). A tutorial on false discovery control. Talk at Hannover Workshop. http://www.stat.cmu.edu/~genovese/talks/hannover1-04.pdf Goldman, M. (2008) Statistics for Bioinformatics course notes. https://www.stat.berkeley.edu/~mgoldman/Section0402.pdf Groppe, D. Two-stage Benjamini, Krieger, & (sic) Yekutieli FDR Procedure (2012). Mathworks File Exchange. https://www.mathworks.com/matlabcentral/fileexchange/27423-two-stage-benjamini- krieger-yekutieli-fdr-procedure
  • 33.
    References Holm-Bonferroni Method (accessed2018). Wikipedia. https://en.wikipedia.org/wiki/Holm– Bonferroni_method Keuhl, R.O. Design of Experiments: Statistical Principles of Research Design and Analysis (2ed.). (2000). Brooks/Cole CA Mailman School of Public Health, Columbia University. False Discovery Rate (accessed 2018). https://www.mailman.columbia.edu/research/population-health-methods/false-discovery-rate Storey, J.D. A Direct Approach to False Disco0very Rates (2002). Journal of the Royal Statistical Society B (2002) 64, Part 3, pp. 479-498. Storey, J.D. False Discovery Rates (2010). Working Paper. http://genomine.org/papers/Storey_FDR_2011.pdf John D. Storey with contributions from Andrew J. Bass, Alan Dabney and David Robinson (2015). qvalue: Q- value estimation for false discovery rate control. R package version 2.10.0. http://github.com/jdstorey/qvalue Tamhane, A.C. and Dunlop, D.D. (2000). Statistics and Data Analysis from Elementary to Intermediate. Prentice Hall Upper Saddle River, NJ
  • 34.
    Example 2: B-Hwith Large m • Full code in: https://github.com/panders225/final-lecture/blob/master/BH_FDR_Example_Two.ipynb
  • 35.
    Notable Software Implementations ofFDR Control• R – Numerous: http://strimmerlab.org/notes/fdr.html – https://bioconductor.org/packages/release/bioc/ht ml/qvalue.html • SAS – PROC MULTTEST • Python – statsmodels.stats.multitest.multipletests – sklearn.feature_selection.SelectFDR • Stata – https://www.stata- journal.com/sjpdf.html?articlenum=st0209

Editor's Notes

  • #15 Q* is the acceptable proportion of false discoveries
  • #24 Storey’s big issue with FDR is that fixing alpha is appropriate for FWER control, but might be too restrictive when performing the exploratory type of work that someone would do with FDR.
  • #25 A q-value of 5% means that 5% of significant results will result in false positives. The q-value doesn’t take into account all the tests; they only take into account the tests that are below a threshold that you choose (i.e. tests reporting a q-value of 5% or less).