THE ENGINEERING ECONOMIST
, VOL. , NO. , –
http://dx.doi.org/./X..
Using mean-Gini and stochastic dominance to choose project
portfolios with parameter uncertainty
Guilherme Augusto Barucke Marcondesa,b, Rafael Coradi Lemeb, Marcela da
Silveira Lemeb, and Carlos Eduardo Sanches da Silvab
aNational Institute of Telecommunications, Santa Rita do Sapucaí, Brazil; bInstitute of Industrial Engineering and
Management, Federal University of Itajubá, Itajubá, Brazil
ABSTRACT
Although a variety of models have been studied for project portfo-
lio selection, many organizations still struggle to choose a potentially
diverse range of projects while ensuring the most beneficial results. The
use of the mean-Gini framework and stochastic dominance to select
portfolios of research and development (R&D) projects has been gaining
attention in the literature despite the fact that such approaches do not
consider uncertainty regarding the projects’parameters. This article dis-
cusses, with relation to project portfolio selection through a mean-Gini
approach and stochastic dominance, the impact of uncertainty on
project parameters. In the process, Monte Carlo simulation is consid-
eredinevaluatingtheimpactofparametricuncertaintyonprojectselec-
tion. The results show that the influence of uncertainty is significant
enough to mislead managers. A more robust selection policy using the
mean-Gini approach and Monte Carlo simulation is proposed.
Introduction
Managers select projects by prioritizing some options over others and by excluding options
that are not aligned with their company strategy or that may lead to a loss; the choices about
which the manager makes decisions are usually treated as a portfolio. Portfolio theory seeks
to manage risk in a group of assets to determine a combination that offers the lowest risk
and the highest expected return. Such a group is called an optimal portfolio. As with a finan-
cial portfolio, portfolio management focuses primarily on select projects to ensure that risks,
complexity, potential returns, and resource allocation are aligned to the organization’s strat-
egy to provide optimal benefits (Petit 2012). Thus, if a project’s expected return and its associ-
ated risk can be estimated, portfolio theory can be used to select the most attractive options.
The concept of portfolio selection, which was introduced by the seminal work of Markowitz
(1952), established the optimal strategy for maximizing return and minimizing the associated
variance. When this strategy is followed, the efficient frontier is reached, where for a given
variance level, there exists no other portfolio with a greater expected return. Similarly, for a
given expected return level, there exists no other portfolio with smaller variance.
CONTACT Guilherme Augusto Barucke Marcondes [email protected] National Institute of Telecommunications,
Department of Computing Engineering, Av. João de Camargo, , Santa Rita do Sapucaí .
This paper examines the "variance premium", which is the difference between the squared VIX index and expected realized variance. The authors show that the variance premium captures attitudes toward economic uncertainty and predicts future stock returns over short horizons. They develop a generalized long-run risks model that generates a time-varying variance premium consistent with market return and risk-free rate levels. The model requires extensions to match the large size, volatility and skewness of the variance premium and its short-term return predictability. Calibrating the model to cash flow and asset pricing targets allows it to generate the variance premium and its return predictability features.
- The document discusses various techniques for analyzing risk in capital budgeting decisions such as payback period, certainty equivalent, risk-adjusted discount rate, sensitivity analysis, scenario analysis, and simulation analysis.
- It also covers using decision trees for sequential investment decisions and incorporating utility theory to explicitly include a decision-maker's risk preferences in the capital budgeting analysis.
Evaluation method for strategic investmentsazhar901
1) The document discusses challenges with existing real options analysis valuation methods for strategic investments, such as constraints based on assumptions from stock market option pricing models.
2) It aims to develop a new valuation model that is unconstrained by stock market assumptions, robustly represents the underlying asset, and is easy for users to adopt.
3) The objectives are to create and test a new model, compare it to an existing method, and apply it in a case study to demonstrate its usefulness for valuing strategic investments in industry.
Exchange rate volatility implied from option pricesSrdjan Begovic
This document is a dissertation submitted by Srdjan Begovic in partial fulfillment of a Master's degree in finance and investments from Aston University. The dissertation focuses on forecasting exchange rate volatility using three models: GARCH(1,1), Black-Scholes implied volatility, and model-free implied volatility. Forecasts from these three models are generated for the out-of-sample period from January 2002 to December 2006 using weekly data on seven exchange rates. The forecasts are then evaluated and compared based on accuracy measures to determine the most reliable model for predicting realized volatility.
Superior performance by combining Rsik Parity with Momentum?Wilhelm Fritsche
This document examines different strategies for global asset allocation between equities, bonds, commodities and real estate. It finds that applying trend following rules substantially improves risk-adjusted performance compared to traditional buy-and-hold portfolios. It also finds trend following to be superior to risk parity approaches. Combining momentum strategies with trend following further improves returns while reducing volatility and drawdowns. A flexible approach that allocates capital based on volatility-weighted momentum rankings of 95 markets produces attractive, consistent risk-adjusted returns.
This document presents an estimated arbitrage-free model that jointly models nominal and real US Treasury yields. It estimates separate arbitrage-free Nelson-Siegel models for nominal and real yields, finding a three-factor model fits nominal yields well and a two-factor model fits real yields. It then estimates a four-factor joint model that fits both yield curves. The joint model is used to decompose breakeven inflation rates into inflation expectations and inflation risk premium components.
MODELING THE AUTOREGRESSIVE CAPITAL ASSET PRICING MODEL FOR TOP 10 SELECTED...IAEME Publication
Systematic risk is the uncertainty inherent to the entire market or entire market segment and Unsystematic risk is the type of uncertainty that comes with the company or industry we invest. It can be reduced through diversification. The study generalized for selecting of non -linear capital asset pricing model for top securities in BSE and made an attempt to identify the marketable and non-marketable risk of investors of top companies. The analysis was conducted at different stages. They are Vector auto regression of systematic and unsystematic risk.
Retirement saving with contribution payments and labor income as a benchmark ...Nicha Tatsaneeyapan
This document summarizes a research paper about modeling retirement savings when contributions are made and labor income is used as a benchmark for investments. The key points are:
1) A retirement savings model is presented where a plan sponsor makes contributions to finance an employee's retirement. The goal is to ensure the employee can maintain their consumption after retiring based on their labor income.
2) Dynamic programming is used to derive optimal investment and contribution strategies as functions of the wealth-to-income ratio and wage growth rate.
3) The analysis finds that contribution payments significantly increase risk-taking at low wealth levels. It also finds that considering downside risk can paradoxically increase risky investing at low wealth levels due to increasing relative risk
11.do conditional and unconditional conservatism impactAlexander Decker
This document summarizes a research study that examined the impact of conditional and unconditional conservatism on earnings quality and stock prices in Egypt. The study used data from the largest 30 Egyptian listed firms from 2005 to 2009. The results suggest that (1) conditional conservatism negatively affects both earnings quality and stock prices, and (2) unconditional conservatism does not affect earnings quality but has a negative association with stock prices. This was the first study to test the impact of both types of conservatism on earnings quality and stock prices in the Egyptian context.
Do conditional and unconditional conservatism impactAlexander Decker
This document summarizes a research paper that examines the impact of conditional and unconditional conservatism on earnings quality and stock prices in Egypt. The study uses data from the largest 30 Egyptian listed firms from 2005 to 2009. The results suggest that (1) conditional conservatism negatively affects both earnings quality and stock prices, and (2) unconditional conservatism does not affect earnings quality but has a negative association with stock prices. This is the first study to test the impact of both types of conservatism on earnings quality and stock prices in the Egyptian context.
This document discusses an integrated model for sensitivity analysis and scenario analysis using breakeven analysis for operational and investment risk analysis. It was developed by Prof. Sreedhara Ramesh Chandra and Dr. Krishna Banana. The model aims to address limitations in existing sensitivity, scenario, and breakeven analysis models by integrating the three approaches. It introduces proportions and percentages to more precisely determine variable values. It also establishes relationships between scenario values and measures sensitivity through changes from a predetermined relational constant value (sales revenue). The model allows consideration of all cash flow determinants and provides a direct link between operational and investment risk measurements to improve investment decisions.
Forecasting is the process of making predictions about events that have not yet occurred based on past data and other information. There are many different forecasting methods that can be qualitative or quantitative, including time series analysis, causal modeling, judgmental approaches, and more recently artificial intelligence techniques. Accuracy is important in forecasting and is typically measured using values like mean absolute error or mean squared error. Forecasting has wide applications in domains like business, economics, weather, earthquakes, and more. Limitations to forecasting accuracy exist, such as the chaotic nature of systems like the weather beyond two weeks.
This document discusses methods for clustering time series data in a way that allows the cluster structure to change over time. It begins by introducing the problem and defining relevant terms. It then provides spectral clustering as a preliminary benchmark approach before exploring an alternative method using triangular potentials within a graphical model framework. The document presents the proposed method and provides illustrative examples and discussion of extensions.
This document summarizes a paper that explores how actuaries can apply techniques from financial economics in their work. It presents several case studies using concepts like risk discount rates, locking-in adjustments, and risk neutral methodologies. The case studies value a personal equity plan and examine asset-liability studies and capital adequacy from the perspective of financial economics. It includes computer code with examples to demonstrate stochastic modeling and valuation. The paper aims to bring these new techniques into the actuarial profession for discussion and potential wider application.
1) The document presents a new approach for constructing retirement income portfolios using a combination of decision matrices.
2) The decision matrices incorporate relevant variables like age, expenses, assets, risks in a systematic way to determine an appropriate asset allocation and income strategy.
3) The approach allows for flexibility to suit individual client needs while also providing consistency across financial planners at a firm.
Investment portfolio optimization with garch modelsEvans Tee
Since the introduction of the Markowitz mean-variance optimization model, several extensions have been made to improve optimality. This study examines the application of two models - the ARMA-GARCH model and the ARMA- DCC GARCH model - for the Mean-VaR optimization of funds managed by HFC Investment Limited. Weekly prices of the above mentioned funds from 2009 to 2012 were examined. The funds analyzed were the Equity Trust Fund, the Future Plan Fund and the Unit Trust Fund. The returns of the funds are modelled with the Autoregressive Moving Average (ARMA) whiles volatility was modelled with the univariate Generalized Autoregressive Conditional Heteroskedasti city (GARCH) as well as the multivariate Dynamic Conditional Correlation GARCH (DCC GARCH). This was based on the assumption of non-constant mean and volatility of fund returns. In this study the risk of a portfolio is measured using the value-at-risk. A single constrained Mean-VaR optimization problem was obtained based on the assumption that investors’ preference is solely based on risk and return. The optimization process was performed using the Lagrange Multiplier approach and the solution was obtained by the Kuhn-Tucker theorems. Conclusions which were drawn based on the results pointed to the fact that a more efficient portfolio is obtained when the value-at-risk (VaR) is modelled with a multivariate GARCH.
This document introduces the Two Sigma Factor Lens, which is a framework for constructing a parsimonious set of risk factors that individually describe independent risks across many asset classes yet collectively explain much of the risk in typical institutional investor portfolios. The lens is intended to capture the majority of risk in a holistic yet concise manner so that changes to factor exposures can easily translate to asset allocation changes. The document discusses how analyzing portfolios through a risk factor lens allows investors to better understand overlapping risk sources across asset classes and more efficiently manage portfolio risk.
The document discusses improving cash flow studies used in property valuations. It focuses on two key areas: [1] increasing consistency in cash flow models by standardizing structure and eliminating incorrect formulas, and [2] improving accuracy of input data, especially for key uncertain variables, through better selection processes drawing on probability distributions, sensitivity analysis, and simulation. The case study examined demonstrates how changes to both model structure and input variables can significantly impact outcomes, highlighting the need for standardized, well-structured models and accurate, carefully selected data inputs.
Fund flow volatility and performance rakowskibfmresearch
This paper analyzes the impact of daily mutual fund flow volatility on fund performance. The author finds that higher daily flow volatility is negatively associated with risk-adjusted fund performance. This relationship is strongest for domestic equity funds, smaller funds, better performing funds, and those that experienced net inflows. The results suggest daily fund flows impose liquidity costs through unnecessary trading that reduces returns.
Regression analysis is a statistical technique used to determine the relationship between variables. It allows one to quantify the strength and character of the association between a dependent variable and one or more independent variables. Regression models are used across various disciplines like finance, economics, and investing to help explain phenomena and predict outcomes.
This paper presents a model to value cash holdings for all-equity financed firms with growth opportunities. The model considers the tradeoff between agency costs of free cash flow and costs of external financing. It derives the optimal dynamic cash retention policy and shows that firms optimally retain only a fraction of cash flows. The model implies that high cash flow volatility decreases the value of cash and that optimal cash retention can delay investment timing. Empirical tests on US firm data from 1980-2010 confirm these implications, finding a negative relationship between cash value and volatility in the context of growth options.
International journal of engineering and mathematical modelling vol1 no1_2015_2IJEMM
This document discusses using the CIR++ model to estimate default risk through simulation. It begins by describing structural and reduced-form approaches to default estimation. It then introduces the CIR and CIR++ processes, which can model the evolution of short-term interest rates and default intensities. The document outlines how the CIR++ model can be calibrated to market data on yield curves and credit default swap prices to estimate default probabilities. It concludes by stating the calibrated CIR++ model will be tested against Deutsche Bank estimates to evaluate its ability to model default risk.
This document discusses estimating stochastic relative risk aversion from interest rates. It first introduces a model for deriving relative risk aversion from interest rates using a time inhomogeneous single factor short rate model. It then details the estimation methodology used, which calibrates the model to US LIBOR data to estimate a time series for the market price of risk and ex-ante bond Sharpe ratio. This allows deducing a stochastic process for relative risk aversion under a power utility function. Estimated mean relative risk aversion is 49.89. The document then introduces modifying a Real Business Cycle model to allow time-varying relative risk aversion, finding it better matches empirical consumption volatility than a baseline model.
This document discusses techniques for evaluating projects under uncertainty, including sensitivity analysis, switching values, and probability distributions of outcomes. Sensitivity analysis systematically tests how changes to estimates impact a project's worth. Probability distributions collapse uncertain outcomes into point estimates but lack variance data. Direct or simulated calculations of probability distributions provide a full picture of outcome likelihoods when events are independent.
The document outlines various techniques for stand-alone risk analysis, including sensitivity analysis, scenario analysis, break-even analysis, simulation analysis, and decision tree analysis. It provides examples and procedures for conducting each type of analysis. Sensitivty analysis and scenario analysis are discussed in detail through examples. Simulation analysis covers defining probability distributions, dealing with correlations, and issues in application. Decision tree analysis is introduced as a tool for sequential decision making under risk.
STRESS TESTING IN BANKING SECTOR FRAMEWORKDinabandhu Bag
This document summarizes a study analyzing default correlation in retail banking portfolios in India. It discusses:
1) Literature on default correlation and factor modeling approaches to estimate correlation. Previous studies found correlation varies over time and across industries/ratings.
2) Analysis of a test portfolio with 4 retail segments showing migration of exposures between segments over 14 months. Segments showed varying default rate trends over time.
3) The study builds a multi-factor linear model to test if external economic factors significantly impact default correlations between segments over time.
Prior performance and risk taking ammannbfmresearch
This document discusses using a dynamic Bayesian network approach to analyze the behavior of mutual fund managers, specifically how prior performance impacts risk-taking. The key findings are:
1) In contrast to some theories and studies, the analysis found that prior performance has a positive impact on the choice of risk level - successful fund managers take on more risk in the following year by increasing measures like volatility, beta, and tracking error.
2) Poor-performing fund managers were found to switch to more passive strategies.
3) Bayesian networks allow capturing nonlinear patterns and assigning probabilities to different outcomes, providing a more robust approach than previous studies on this topic.
The document discusses defining a "Quant Cycle" to capture cyclical behavior in factor returns. The author argues traditional business cycle indicators do not adequately explain factor return variations. Instead, factors seem to follow their own cycle driven by abrupt changes in investor sentiment.
The author proposes a simple 3-stage Quant Cycle model consisting of: 1) a normal stage where factors earn long-term premiums, interrupted by 2) occasional large drawdowns in the value factor due to growth rallies or value crashes, typically lasting 2 years, followed by 3) subsequent reversals where outperforming factors reverse and underperforming factors recover. Empirically, this model captures a large amount of time variation in factor returns compared to traditional frameworks
The employee life cycle is a foundational framework for robust and h.docxtodd701
The employee life cycle is a foundational framework for robust and healthy employee experience and is a major contributor to the success of the organization. It is also a powerful mechanism that can, when well-designed and properly used, make a company a workplace that employees want to be at every day of the week and creativity and innovation show up even when leaders are just hoping for it. Learners are asked to respond to the following question for this last discussion in the course: Which parts of the employment life cycle do you consider most important and why?
Resources
Employee Life Cycle Impact on Engagement
(2018, Feb 28).
Report details how moments that matter & employee value propositions impact worker engagement.
PR Newswire.
"Among the most critical components shaping (the organization's engagement) ecosystem is the employee value proposition, the tangible and intangible deal that organizations provide in exchange for employee effort, commitment and performance."
Bradison, P. (2019).
HR Matters: From recruiting to onboarding the importance of quality new hire work flows.
Alaska Business Monthly,
35
(4), 83.
This article describes how "employees from multiple generations are seeking employment with a consumer’s approach" when they consider more than the pay structure before applying for a position.
Working in HRM
Justin, T. C. (2018).
Addressing the top HR challenges in 2019.
HR Strategy and Planning Excellence Essentials.
This preview to the year in HRM in Canada considers these hot topics: "catering to a multi-generational workforce, employee engagement, increasing feedback, attracting and keeping the right employees, and now marijuana in the workplace."
Sato, Y., Kobayashi, N., & Shirasaka, S. (2020).
An analysis of human resource management for knowledge workers: Using the three axes of target employee, lifecycle stage, and human resource flow.
Review of Integrative Business and Economics Research, 9
(1), 140–156.
This study considers human resource flow management and how to foster that along with two other HRM initiatives with knowledge workers.
Tyler, K. (2019).
10 steps to unlocking innovation at your organization.
HRMagazine, 64
(1), 1.
Innovation is a key component for the longevity of an organization and "HR can't expect to foster an innovative company culture if it does not have an innovative culture within its own function." This resource is inspiring to help HR professionals find a purpose for their efforts to improve all steps in the employee life cycle and embrace the HR platforms and tools that will help them towards this goal.
Case Study
Saurombe, M., Barkhuizen, E. N., & Schutte, N. E. (2017).
Management perceptions of a higher educational brand for the attraction of talented academic staff.
SA Journal of Human Resource Management
, 15.
This study gives a great example of how managers think about branding in higher education and how a.
The economy is driven by data ~ Data sustains an organization’s .docxtodd701
The economy is driven by data ~ Data sustains an organization’s business processes and enables it to deliver products and services. Stop the flow of data, and for many companies, business comes quickly to a halt. Those who understand its value and have the ability to manage related risks will have a competitive advantage. If the loss of data lasts long enough, the viability of an organization to survive may come into question.
What is the significant difference between quality assurance & quality control? Explain
Why is there a relationship between QA/QC and risk management? Explain
Why are policies needed to govern data both in transit and at rest (not being used - accessed)? Explain
.
More Related Content
Similar to THE ENGINEERING ECONOMIST, VOL. , NO. , –http.docx
11.do conditional and unconditional conservatism impactAlexander Decker
This document summarizes a research study that examined the impact of conditional and unconditional conservatism on earnings quality and stock prices in Egypt. The study used data from the largest 30 Egyptian listed firms from 2005 to 2009. The results suggest that (1) conditional conservatism negatively affects both earnings quality and stock prices, and (2) unconditional conservatism does not affect earnings quality but has a negative association with stock prices. This was the first study to test the impact of both types of conservatism on earnings quality and stock prices in the Egyptian context.
Do conditional and unconditional conservatism impactAlexander Decker
This document summarizes a research paper that examines the impact of conditional and unconditional conservatism on earnings quality and stock prices in Egypt. The study uses data from the largest 30 Egyptian listed firms from 2005 to 2009. The results suggest that (1) conditional conservatism negatively affects both earnings quality and stock prices, and (2) unconditional conservatism does not affect earnings quality but has a negative association with stock prices. This is the first study to test the impact of both types of conservatism on earnings quality and stock prices in the Egyptian context.
This document discusses an integrated model for sensitivity analysis and scenario analysis using breakeven analysis for operational and investment risk analysis. It was developed by Prof. Sreedhara Ramesh Chandra and Dr. Krishna Banana. The model aims to address limitations in existing sensitivity, scenario, and breakeven analysis models by integrating the three approaches. It introduces proportions and percentages to more precisely determine variable values. It also establishes relationships between scenario values and measures sensitivity through changes from a predetermined relational constant value (sales revenue). The model allows consideration of all cash flow determinants and provides a direct link between operational and investment risk measurements to improve investment decisions.
Forecasting is the process of making predictions about events that have not yet occurred based on past data and other information. There are many different forecasting methods that can be qualitative or quantitative, including time series analysis, causal modeling, judgmental approaches, and more recently artificial intelligence techniques. Accuracy is important in forecasting and is typically measured using values like mean absolute error or mean squared error. Forecasting has wide applications in domains like business, economics, weather, earthquakes, and more. Limitations to forecasting accuracy exist, such as the chaotic nature of systems like the weather beyond two weeks.
This document discusses methods for clustering time series data in a way that allows the cluster structure to change over time. It begins by introducing the problem and defining relevant terms. It then provides spectral clustering as a preliminary benchmark approach before exploring an alternative method using triangular potentials within a graphical model framework. The document presents the proposed method and provides illustrative examples and discussion of extensions.
This document summarizes a paper that explores how actuaries can apply techniques from financial economics in their work. It presents several case studies using concepts like risk discount rates, locking-in adjustments, and risk neutral methodologies. The case studies value a personal equity plan and examine asset-liability studies and capital adequacy from the perspective of financial economics. It includes computer code with examples to demonstrate stochastic modeling and valuation. The paper aims to bring these new techniques into the actuarial profession for discussion and potential wider application.
1) The document presents a new approach for constructing retirement income portfolios using a combination of decision matrices.
2) The decision matrices incorporate relevant variables like age, expenses, assets, risks in a systematic way to determine an appropriate asset allocation and income strategy.
3) The approach allows for flexibility to suit individual client needs while also providing consistency across financial planners at a firm.
Investment portfolio optimization with garch modelsEvans Tee
Since the introduction of the Markowitz mean-variance optimization model, several extensions have been made to improve optimality. This study examines the application of two models - the ARMA-GARCH model and the ARMA- DCC GARCH model - for the Mean-VaR optimization of funds managed by HFC Investment Limited. Weekly prices of the above mentioned funds from 2009 to 2012 were examined. The funds analyzed were the Equity Trust Fund, the Future Plan Fund and the Unit Trust Fund. The returns of the funds are modelled with the Autoregressive Moving Average (ARMA) whiles volatility was modelled with the univariate Generalized Autoregressive Conditional Heteroskedasti city (GARCH) as well as the multivariate Dynamic Conditional Correlation GARCH (DCC GARCH). This was based on the assumption of non-constant mean and volatility of fund returns. In this study the risk of a portfolio is measured using the value-at-risk. A single constrained Mean-VaR optimization problem was obtained based on the assumption that investors’ preference is solely based on risk and return. The optimization process was performed using the Lagrange Multiplier approach and the solution was obtained by the Kuhn-Tucker theorems. Conclusions which were drawn based on the results pointed to the fact that a more efficient portfolio is obtained when the value-at-risk (VaR) is modelled with a multivariate GARCH.
This document introduces the Two Sigma Factor Lens, which is a framework for constructing a parsimonious set of risk factors that individually describe independent risks across many asset classes yet collectively explain much of the risk in typical institutional investor portfolios. The lens is intended to capture the majority of risk in a holistic yet concise manner so that changes to factor exposures can easily translate to asset allocation changes. The document discusses how analyzing portfolios through a risk factor lens allows investors to better understand overlapping risk sources across asset classes and more efficiently manage portfolio risk.
The document discusses improving cash flow studies used in property valuations. It focuses on two key areas: [1] increasing consistency in cash flow models by standardizing structure and eliminating incorrect formulas, and [2] improving accuracy of input data, especially for key uncertain variables, through better selection processes drawing on probability distributions, sensitivity analysis, and simulation. The case study examined demonstrates how changes to both model structure and input variables can significantly impact outcomes, highlighting the need for standardized, well-structured models and accurate, carefully selected data inputs.
Fund flow volatility and performance rakowskibfmresearch
This paper analyzes the impact of daily mutual fund flow volatility on fund performance. The author finds that higher daily flow volatility is negatively associated with risk-adjusted fund performance. This relationship is strongest for domestic equity funds, smaller funds, better performing funds, and those that experienced net inflows. The results suggest daily fund flows impose liquidity costs through unnecessary trading that reduces returns.
Regression analysis is a statistical technique used to determine the relationship between variables. It allows one to quantify the strength and character of the association between a dependent variable and one or more independent variables. Regression models are used across various disciplines like finance, economics, and investing to help explain phenomena and predict outcomes.
This paper presents a model to value cash holdings for all-equity financed firms with growth opportunities. The model considers the tradeoff between agency costs of free cash flow and costs of external financing. It derives the optimal dynamic cash retention policy and shows that firms optimally retain only a fraction of cash flows. The model implies that high cash flow volatility decreases the value of cash and that optimal cash retention can delay investment timing. Empirical tests on US firm data from 1980-2010 confirm these implications, finding a negative relationship between cash value and volatility in the context of growth options.
International journal of engineering and mathematical modelling vol1 no1_2015_2IJEMM
This document discusses using the CIR++ model to estimate default risk through simulation. It begins by describing structural and reduced-form approaches to default estimation. It then introduces the CIR and CIR++ processes, which can model the evolution of short-term interest rates and default intensities. The document outlines how the CIR++ model can be calibrated to market data on yield curves and credit default swap prices to estimate default probabilities. It concludes by stating the calibrated CIR++ model will be tested against Deutsche Bank estimates to evaluate its ability to model default risk.
This document discusses estimating stochastic relative risk aversion from interest rates. It first introduces a model for deriving relative risk aversion from interest rates using a time inhomogeneous single factor short rate model. It then details the estimation methodology used, which calibrates the model to US LIBOR data to estimate a time series for the market price of risk and ex-ante bond Sharpe ratio. This allows deducing a stochastic process for relative risk aversion under a power utility function. Estimated mean relative risk aversion is 49.89. The document then introduces modifying a Real Business Cycle model to allow time-varying relative risk aversion, finding it better matches empirical consumption volatility than a baseline model.
This document discusses techniques for evaluating projects under uncertainty, including sensitivity analysis, switching values, and probability distributions of outcomes. Sensitivity analysis systematically tests how changes to estimates impact a project's worth. Probability distributions collapse uncertain outcomes into point estimates but lack variance data. Direct or simulated calculations of probability distributions provide a full picture of outcome likelihoods when events are independent.
The document outlines various techniques for stand-alone risk analysis, including sensitivity analysis, scenario analysis, break-even analysis, simulation analysis, and decision tree analysis. It provides examples and procedures for conducting each type of analysis. Sensitivty analysis and scenario analysis are discussed in detail through examples. Simulation analysis covers defining probability distributions, dealing with correlations, and issues in application. Decision tree analysis is introduced as a tool for sequential decision making under risk.
STRESS TESTING IN BANKING SECTOR FRAMEWORKDinabandhu Bag
This document summarizes a study analyzing default correlation in retail banking portfolios in India. It discusses:
1) Literature on default correlation and factor modeling approaches to estimate correlation. Previous studies found correlation varies over time and across industries/ratings.
2) Analysis of a test portfolio with 4 retail segments showing migration of exposures between segments over 14 months. Segments showed varying default rate trends over time.
3) The study builds a multi-factor linear model to test if external economic factors significantly impact default correlations between segments over time.
Prior performance and risk taking ammannbfmresearch
This document discusses using a dynamic Bayesian network approach to analyze the behavior of mutual fund managers, specifically how prior performance impacts risk-taking. The key findings are:
1) In contrast to some theories and studies, the analysis found that prior performance has a positive impact on the choice of risk level - successful fund managers take on more risk in the following year by increasing measures like volatility, beta, and tracking error.
2) Poor-performing fund managers were found to switch to more passive strategies.
3) Bayesian networks allow capturing nonlinear patterns and assigning probabilities to different outcomes, providing a more robust approach than previous studies on this topic.
The document discusses defining a "Quant Cycle" to capture cyclical behavior in factor returns. The author argues traditional business cycle indicators do not adequately explain factor return variations. Instead, factors seem to follow their own cycle driven by abrupt changes in investor sentiment.
The author proposes a simple 3-stage Quant Cycle model consisting of: 1) a normal stage where factors earn long-term premiums, interrupted by 2) occasional large drawdowns in the value factor due to growth rallies or value crashes, typically lasting 2 years, followed by 3) subsequent reversals where outperforming factors reverse and underperforming factors recover. Empirically, this model captures a large amount of time variation in factor returns compared to traditional frameworks
Similar to THE ENGINEERING ECONOMIST, VOL. , NO. , –http.docx (20)
The employee life cycle is a foundational framework for robust and h.docxtodd701
The employee life cycle is a foundational framework for robust and healthy employee experience and is a major contributor to the success of the organization. It is also a powerful mechanism that can, when well-designed and properly used, make a company a workplace that employees want to be at every day of the week and creativity and innovation show up even when leaders are just hoping for it. Learners are asked to respond to the following question for this last discussion in the course: Which parts of the employment life cycle do you consider most important and why?
Resources
Employee Life Cycle Impact on Engagement
(2018, Feb 28).
Report details how moments that matter & employee value propositions impact worker engagement.
PR Newswire.
"Among the most critical components shaping (the organization's engagement) ecosystem is the employee value proposition, the tangible and intangible deal that organizations provide in exchange for employee effort, commitment and performance."
Bradison, P. (2019).
HR Matters: From recruiting to onboarding the importance of quality new hire work flows.
Alaska Business Monthly,
35
(4), 83.
This article describes how "employees from multiple generations are seeking employment with a consumer’s approach" when they consider more than the pay structure before applying for a position.
Working in HRM
Justin, T. C. (2018).
Addressing the top HR challenges in 2019.
HR Strategy and Planning Excellence Essentials.
This preview to the year in HRM in Canada considers these hot topics: "catering to a multi-generational workforce, employee engagement, increasing feedback, attracting and keeping the right employees, and now marijuana in the workplace."
Sato, Y., Kobayashi, N., & Shirasaka, S. (2020).
An analysis of human resource management for knowledge workers: Using the three axes of target employee, lifecycle stage, and human resource flow.
Review of Integrative Business and Economics Research, 9
(1), 140–156.
This study considers human resource flow management and how to foster that along with two other HRM initiatives with knowledge workers.
Tyler, K. (2019).
10 steps to unlocking innovation at your organization.
HRMagazine, 64
(1), 1.
Innovation is a key component for the longevity of an organization and "HR can't expect to foster an innovative company culture if it does not have an innovative culture within its own function." This resource is inspiring to help HR professionals find a purpose for their efforts to improve all steps in the employee life cycle and embrace the HR platforms and tools that will help them towards this goal.
Case Study
Saurombe, M., Barkhuizen, E. N., & Schutte, N. E. (2017).
Management perceptions of a higher educational brand for the attraction of talented academic staff.
SA Journal of Human Resource Management
, 15.
This study gives a great example of how managers think about branding in higher education and how a.
The economy is driven by data ~ Data sustains an organization’s .docxtodd701
The economy is driven by data ~ Data sustains an organization’s business processes and enables it to deliver products and services. Stop the flow of data, and for many companies, business comes quickly to a halt. Those who understand its value and have the ability to manage related risks will have a competitive advantage. If the loss of data lasts long enough, the viability of an organization to survive may come into question.
What is the significant difference between quality assurance & quality control? Explain
Why is there a relationship between QA/QC and risk management? Explain
Why are policies needed to govern data both in transit and at rest (not being used - accessed)? Explain
.
THE EMERGENCY DEPARTMENT AND VICTIMS OF SEXUAL VIOLENCE AN .docxtodd701
THE EMERGENCY DEPARTMENT AND
VICTIMS OF SEXUAL VIOLENCE: AN
ASSESSMENT OF PREPAREDNESS TO HELP
STACEY BETH PLICHTA, SC.D.
TANCY VANDECAR-BURDIN, M.A.
Old Dominion University, Norfolk, VA
REBECCA K ODOR, M.S.W.
Virginia Department of Health, Richmond, VA
SHANI REAMS, A.A.S.
Virginia Sexual and Domestic Violence Action Alliance,
Richmond, VA
YAN ZHANG, M.S.
Old Dominion University, Norfolk, VA
ABSTRACT
The Emergency Department (ED) is a key source of care for
victims of sexual violence but there is little information available about
the extent to which EDs are prepared to provide this care. This study
examines the structural and process factors that the ED has in place to
assist victims. A survey of all 82 publicly accessible EDs in the
Commonwealth of Virginia was conducted (RR 76%). In general, the
EDs provide the recommended medical care to victims. However, at
least half do not have the needed resources in place to effectively assist
victims and most (80%) do not provide regular training to their medical
staff about sexual violence. Further, almost one-quarter do not have a
relationship with a local rape crisis center. It is recommended that each
ED partner with local rape crisis centers to provide training to their
staff and to ensure continuity of support for victims. It is also
suggested that the state government explore ways in which a forensic
(SANE) nurse be made available to every victim of sexual violence that
presents to the ED for medical assistance. Ideally, each ED would
become part of a community-wide Sexual Assault Response Team
286 JHHSA WINTER 2006
(SART) in order to provide comprehensive care to victims and
thorough evidence collection and information to law enforcement.
INTRODUCTION
This study seeks to examine the extent to which
Emergency Departments (EDs) in the Commonwealth of
Virginia are prepared to provide care for victims of sexual
violence through an examination of both structural and
process factors that are currently in place. Many studies
indicate that sexual violence victimization has both long-
term and short-term health consequences (Plichta and Falik,
2001; see also Rentoul and Applebloom 1997; Cloutier,
Martin and Poole, 2002; Bohn and Holz, 1996). The ED is
a key source of care for victims of sexual assault. It is one
of the first points of entry to care. Competent care by
professionals trained in treating sexual assault victims is
critical to the timely recovery of physical and mental
health. The ED also plays a critical role in the collection of
evidence that may lead to the conviction of the perpetrator
and a recent study found that specially trained (forensic)
nurses perform this function significantly better than do
other staff (Sievers, Murphy and Miller, 2003). Forensic
nurses are registered nurses (R.N.’s) who have advanced
training in the examination of sexual assault victims; this
includes training on legal aspe.
The emergence of HRM in the UK in the 1980s represented a new fo.docxtodd701
The emergence of HRM in the UK in the 1980s represented a new form of managerialism and was instrumental in increases in work intensification’. Discuss.
Word count: 2,000 words (excluding references) and the 10% convention applies
· Minimum use of 15 academic journal articles/ research reports.
· It must be single-sided with size 12 font, 1.5 spacing with the pages numbered and stapled.
Structure – a clear logical format with linked points and arguments.
Broadly, your essay should be structured in the following manner (subheadings are not necessary)
1. Introduction – summary of your ideas and the structure
2. Review of the literature – critical discussion
3. Conclusions
4. References
Background material – evidence of the background research drawing from literature sources. This should include enough descriptive content and factual information from which to derive arguments and assessment of key themes, issues and problems addressed.
Accuracy – in the presentation and description of theories used in the argument
Argumentation – the main argument of the report should relate to the objectives you have initially stated. They should be supported by evidence, both from a variety of sources in the literature.
Presentation – the answers should be well planned – clear, coherent and well constructed. Remember- never write in the first person.
Relevant references and sources must be cited using the Harvard style of referencing. Marks will be removed for wrong or poor referencing.
Useful tips on essay writing
http://www.reading.ac.uk/internal/studyadvice/studyresources/essays/stadevelopessay.aspx
.
The elimination patterns of our patients are very important to know .docxtodd701
The elimination patterns of our patients are very important to know as we continue to assess and do our care plans. How can impaired elimination affect the integumentary system?
Remember that your posts must exhibit appropriate writing mechanics including using proper language, cordiality, and proper grammar and punctuation. If you refer to any outside sources or reference materials be sure to provide proper attribution and/or citation.
.
The Elements and Principles of Design A Guide to Design Term.docxtodd701
The Elements and Principles of Design
A Guide to Design Terminology
The elements of design are some of the basic building blocks that make up the design or artwork.
Understanding and using this terminology can help the designer articulate what works and what doesn’t
work in a design, and to think critically about a design on a more conscious level. Combined, the elements
and principles of design can make for a strong, complete and well-established composition. The principles
of Gestalt, which arise from the elements of design, are included at the end of this document. Learning to
use these elements and principles will be the focus of Beginning Design.
The elements of design are: Point, Line, Form, Value, Texture, Shape, Space, Color
(Color is covered in Art 110; we will be focusing on black, white, and gray scale values.)
DEFINITIONS:
A Point is a position in space.
A Line is the path of a moving point. Two points connected make a line. Lines often imply motion, and can
be rendered in a variety of ways. Contour lines or outlines, define the boundary between shapes. Lines can
create texture or value when used in crosshatching. In addition to these types of actual lines, our eyes can
invent implied lines, such as in dotted lines, or where area boundaries describe lines that may not be there.
Shape is a two dimensional form. The variety of possible shapes is endless. Several common ones are as
follows:
• Simple Geometric: circles, squares, triangles are some of the examples.
• Complex Geometric: straight and curved shapes that have more sides and angles.
• Curvilinear: French curves, ellipses, circles and ovals used in combination.
• Accidental: an example of this might be a coffee ring or paint splatters.
Form is a shape with dimension, an object existing in three dimensional space physically or implied.
Value is the tone created by black, white and shades of gray. The value or tone of an element can create
mass, dimension, emphasis or volume.
Texture can be actual or visual.
• Actual texture is tactile: you can feel it by touching it.
• Visual texture are the markings of a two dimensional artwork that imply actual texture.
Space is an illusion or feeling of 3-dimensionality, which can be created in a two-dimensional design in
several ways, for example:
• Overlapping one object in front of another;
• Using differences in value, amount of detail, etc. between elements;
• Using techniques related to linear perspective, such as differences in size or height on page between
elements
The principles of design are: Unity, Variety, Movement, Balance, Emphasis, Contrast, Proportion,
and Pattern.
DEFINITIONS:
Unity or harmony is the quality of wholeness or oneness that is achieved through the effective use of the
elements and principles of design. The most basic quality of a design or artwork, unity gives a piece the
feeling of being an integrated human expression. The princi.
The emergence of HRM in the UK in the 1980s represented a new form o.docxtodd701
The document provides instructions for a 2,000 word essay discussing how the emergence of human resource management in the UK during the 1980s represented a new form of managerialism and was instrumental in increasing work intensification. The essay should include a minimum of 15 academic sources, follow a clear structure with an introduction, literature review, conclusions, and references section, and demonstrate accurate presentation of evidence and a well-supported argument.
The eligibility requirements to become a family nurse practition.docxtodd701
The eligibility requirements to become a family nurse practitioner include completion of “APRN core (advance physical assessment, advanced pharmacology, and advanced pathophysiology), supervised clinical hours, completion of an accredited graduate program with evidence of an academic transcript, and an active nurse license” (American Academy of Nurse Practitioners, 2021).
The value associated with certification as an FNP is very personal to me. Along with providing higher quality care to clientele, I will have a more fulfilled inner sense of purpose and also be able to provide for my family in a higher capacity than I was previously able to, with an estimated average nurse practitioner salary being over $100,000 annually in the state of Wisconsin. Achieving both my master's and nurse practitioner certification would allow my employer, fellow professional comrades, and most of all; my clients, to have a higher sense of security knowing I’ve worked and studied hard to bring them the highest quality care available. Staying up to date on my continuing education and state-of-the-art processes and pathology will also instill confidence in my clientele to not only continue coming to me with their individual and family healthcare needs but likely will ensure referrals into my practice.
Any time a nurse genuinely takes on a holistic approach towards the practical application of nursing theory, a client is in a better position for patient-centered care, maintaining anonymity, and ensuring positive effective communication during the care process. In the nursing profession, nurses need to not only advocate for their clients, but themselves by participating in associations that work towards advancing the field through by working towards lower nurse-to-client ratios to decrease burnout, leadership education, and opportunity, and also grants to advance continuing education.
.
The Electoral College was created to protect US citizens against.docxtodd701
The Electoral College was created to protect US citizens against mob rule. Mob rule is the control of a lawful government system by a mass of people through violence and intimidation. However, some Americans question the legitimacy of this process. Pick one election where the outcome of the popular vote and the electoral college vote differed to create an argument in favor of or opposed to the use of the electoral college. List at least three valid points to support your argument. Present you argument in a PowerPoint presentation.
As you complete your presentation, be sure to:
Use speaker's notes to expand upon the bullet point main ideas on your slides, making references to research and theory with citation.
Proof your work
Use visuals (pictures, video, narration, graphs, etc.) to compliment the text in your presentation and to reinforce your content.
Do not just write a paper and copy chunks of it into each slide. Treat this as if you were going to give this presentation live.
Presentation Requirements (APA format)
Length: 8-10 substantive slides (excluding cover and references slides)
Font should not be smaller than size 16-point
Parenthetical in-text citations included and formatted in APA style
References slide ( 3 scholarly sources)
.
The Emerging Role of Data Scientists on Software Developmen.docxtodd701
The Emerging Role of Data Scientists
on Software Development Teams
Miryung Kim
UCLA
Los Angeles, CA, USA
[email protected]
Thomas Zimmermann Robert DeLine Andrew Begel
Microsoft Research
Redmond, WA, USA
{tzimmer, rdeline, andrew.begel}@microsoft.com
ABSTRACT
Creating and running software produces large amounts of raw data
about the development process and the customer usage, which can
be turned into actionable insight with the help of skilled data scien-
tists. Unfortunately, data scientists with the analytical and software
engineering skills to analyze these large data sets have been hard to
come by; only recently have software companies started to develop
competencies in software-oriented data analytics. To understand
this emerging role, we interviewed data scientists across several
product groups at Microsoft. In this paper, we describe their educa-
tion and training background, their missions in software engineer-
ing contexts, and the type of problems on which they work. We
identify five distinct working styles of data scientists: (1) Insight
Providers, who work with engineers to collect the data needed to
inform decisions that managers make; (2) Modeling Specialists,
who use their machine learning expertise to build predictive mod-
els; (3) Platform Builders, who create data platforms, balancing
both engineering and data analysis concerns; (4) Polymaths, who
do all data science activities themselves; and (5) Team Leaders,
who run teams of data scientists and spread best practices. We fur-
ther describe a set of strategies that they employ to increase the im-
pact and actionability of their work.
Categories and Subject Descriptors:
D.2.9 [Management]
General Terms:
Management, Measurement, Human Factors.
1. INTRODUCTION
Software teams are increasingly using data analysis to inform their
engineering and business decisions [1] and to build data solutions
that utilize data in software products [2]. The people who do col-
lection and analysis are called data scientists, a term coined by DJ
Patil and Jeff Hammerbacher in 2008 to define their jobs at
LinkedIn and Facebook [3]. The mission of a data scientist is to
transform data into insight, providing guidance for leaders to take
action [4]. One example is the use of user telemetry data to redesign
Windows Explorer (a tool for file management) for Windows 8.
Data scientists on the Windows team discovered that the top ten
most frequent commands accounted for 81.2% of all of invoked
commands, but only two of these were easily accessible from the
command bar in the user interface 8 [5]. Based on this insight, the
team redesigned the user experience to make these hidden com-
mands more prominent.
Until recently, data scientists were found mostly on software teams
whose products were data-intensive, like internet search and adver-
tising. Today, we have reached an inflection point where many.
The Earths largest phylum is Arthropoda, including centipedes, mill.docxtodd701
The Earth's largest phylum is Arthropoda, including centipedes, millipedes, crustaceans, and insects. The insects have shown to be a particularly successful class within the phylum. What biological characteristics have contributed to the success of insects? I'm many science fiction scenarios, post-apocalyptic Earth is mainly populated with giant insects. Why don't we see giant insects today?
250-500 words done by 12:40pm today which is about two hours from now. Cite work.
.
The economic and financial crisis from 2008 to 2009, also known .docxtodd701
The economic and financial crisis from 2008 to 2009, also known as the global financial crisis, was considered to be the worst financial crisis since the Great Depression. The general situation of financial markets has been additionally complicated by the introduction of new financial products as well as other modes of operations including globalization. The global financial market seems to be playing a different function in our economy and it has been working because of new regulations. The introduction of new trade platforms, online access to information, integration and globalization of the market have caused some revisions of finance theories.
What are reliable predictors of economic and financial crises (list at least 3 of them)?
Describe some achievements and some pending issues in context of a global crisis.
Are we still in danger of economic and financial crises today (please refer to current Covid-19 situation)?
Instructions:
Conduct research from viable and credible sources such as and not limited to economic journals, periodicals, books, data base, and websites. This assignment should be submitted/uploaded via D2L on the date the assignment is due. Any late assignments will be subject to a letter grade reduction unless an extension has been negotiated with the professor prior to the due date.
In this written assignment, the quality of your writing and the application of APA format will be evaluated in addition to your content. Evaluation based on these criteria is designed to help prepare you for completing your college projects, which must be well written and follow APA guidelines. Each written assignment should contain a minimum of 800 words, but no more than 900 words. Make sure that you use correct spelling, grammar, and punctuation.
.
The Economic Development Case Study is a two-part assign.docxtodd701
The document provides instructions for a two-part economic development case study assignment. For the first part, students must write a paper analyzing a local economic development project or plan in San Bernardino or Riverside counties. The paper should be 750-1000 words and discuss the project introduction, the government's role, public involvement, economic impacts, analysis, and current status. For the second part, students must create a 10-minute presentation with graphics about their case and record a video of the presentation. The presentation and video are due by April 19th for approval and grading.
The Eighties, Part OneFrom the following list, choose five.docxtodd701
The Eighties,
P
art
One
From the following list, choose five
events
during the 1980s.
I
dentify
the basic facts, dates, and purpose of the event in 2 to 3 sentences in the Identify column. Include why the event is significant in the Significance column, and add a reference for your material in the Reference column.
·
The Sunbelt
·
Suburban Conservatism
·
The Tax Revolt
·
Corporate Elites
·
Neoconservatives
·
Populist Conservatives
·
Deregulation
·
The Federal Reserve Board
·
The Energy Glut
·
The 1981 Tax Cuts
·
Spending Cuts
·
Military Spending
·
Technology
Event
Identify
Significance
Reference
The Eighties,
P
art
Two
From the following list, choose five
events
during the 1980s.
I
dentify
the basic facts, dates, and purpose of the event in 2 to 3 sentences in the Identify column. Include why the event is significant in the Significance column, and add a reference for your material in the Reference column.
·
Feminism
·
Homelessness
·
Republicans and the environment
·
Malls
·
Alternative rock
·
Madonna
·
Michael Jackson
·
AIDS
·
The Cosby Show
·
Sandra Day O’Connor
·
We Are the World
·
Global Warming
·
Geraldine Ferraro
Event
Identify
Significance
Reference
.
The Election of 1860Democrats split· Northern Democrats run .docxtodd701
The Election of 1860
Democrats split
· Northern Democrats run Stephen Douglas
· Southern Democrats run John C. Breckinridge
Republicans decide for moderate
· Republicans nominate Lincoln
· Lincoln opposes slavery in territories
· Republican platform comprehensive
Fourth party enters race
· Constitutional Unionists
· Run John Bell
Republican Victory
· Lincoln gains 40% popular vote
· Lincoln wins in electoral college
· Most Americans want settlement
South Carolina fire-eaters demand secession
· South Carolina secedes December 20, 1680
· Deep South follows
· Buchanan unable to shape compromise
Crittenden Compromise
· Proposed extension of 36º 30’
· John Tyler proposed constitutional amendment
· Lincoln cannot accept slavery in territories
· Compromises fail
Confederate States of America
· Seven states of deep South
· Montgomery original capital
· Constitution similar to that of U.S.
· Constitution protects slavery
President Jefferson of CSA
· Model slave owner; not fire-eater
· Cold personality, irritable, inflexible
· Lacks self-confidence
· Surrounds himself with yes-men
President Abraham Lincoln of United States
· Knows value of unity, competency
· Appoints rivals to cabinet
· Brunt of jokes, criticism
· Sharp native intelligence, humble
Border states
· Virginia, North Carolina, Tennessee, Arkansas join CSA
· Maryland, Kentucky, Missouri stay with Union
· West Virginia secedes from Virginia
A war of nerves
· Two Southern forts in U.S. hands
· Davis willing to let status quo stand for moment
· Lincoln decides to re-supply forts without force
· Confederates fire, beginning April 12, 1861
Art of War influences commanders
· Focus on occupying high ground
· Focus on taking enemy cities
· Retreat when necessary
· Jomini’s 12 models of war
The Armies
· Calvary: for reconnaissance
· Artillery: weakens enemy
· Infantry: backbone of army
· Also support units
Infantry
· Brigades of 2,000–3,000
· Form double lines of 1,000 yards
· Advance into enemy fire
· Then fight hand-to-hand
· Most battles in dense woods
Yanks and Rebs
· Most between 17 and 25
· From all states, social classes
· Draft exempts upper class
· Anti-draft riots in New York City
· Draft dodgers in South
· Some bounty hunters
· High desertion rates
· Shirking duty not common
First Battle of Manassas (Bull Run)
· Both sides thought war would be short
· First battle 20 miles from Washington
· South wins, Union forces flee in panic
First Battle of Manassas (Bull Run)
· South fails to attack Washington
· South celebrates victory
· Stonewall Jackson hero for South
· South disorganized even in victory
Consequences of Manassas (Bull Run)
· South becomes overconfident
· North prepares for long fight
· George McClellan given command of Army of Potomac
Northern strategy
· Defend Washington; take Richmond
· Split Confederacy by taking Mississippi River
· Blockade southern coastline
Mismatch
· North had population advantage of 22 to 9 million
· Industry in north
· Railroads mainl.
The early civilizations of the Indus Valley known as Harappa and Moh.docxtodd701
The early civilizations of the Indus Valley known as Harappa and Mohenjo-Daro had many of the markings of a sophisticated culture. In a
2-3 page
paper discuss the noted advancements of these cultures including significant archaeological finds that suggest these civilizations were far more advanced than originally believed. For this paper, you will need to find
at least (2) outside
resources that support your writing.
.
The Early Theories of Human DevelopmentSeveral theories atte.docxtodd701
The Early Theories of Human Development
Several theories attempt to describe human development.
Briefly describe the Freud, Erickson, and Piaget theories regarding development. Provide the major similarities and differences between each.
Explain how these early theories were developed, and why there is concern related to race, gender, socioeconomic status, and other areas of diversity in how these theories were developed.
.
The Electoral College was created to protect US citizens against mob.docxtodd701
The Electoral College was created to protect US citizens against mob rule. Mob rule is the control of a lawful government system by a mass of people through violence and intimidation. However, some Americans question the legitimacy of this process. Pick one election where the outcome of the popular vote and the electoral college vote differed to create an argument in favor of or opposed to the use of the electoral college. List at least three valid points to support your argument.
Present you argument in a PowerPoint presentation.
Use speaker's notes to expand upon the bullet point main ideas on your slides, making references to research and theory with citation.
Use visuals (pictures, video, narration, graphs, etc.) to compliment the text in your presentation and to reinforce your content.
Treat this as if you were going to give this presentation live.
8-10 slides
.
The early modern age was a period of great discovery and exploration.docxtodd701
The early modern age was a period of great discovery and exploration. The frontiers of knowledge were being pushed out in many directions through the work of scientists and the colonizing of the New World by the European nations. Discuss how our world today is also a world of discovery and exploration. Reflect on this in a short paragraph (250–300) that specifically links the kinds of changes five hundred years ago with the kinds of changes our culture is experiencing today.
.
Strategies for Effective Upskilling is a presentation by Chinwendu Peace in a Your Skill Boost Masterclass organisation by the Excellence Foundation for South Sudan on 08th and 09th June 2024 from 1 PM to 3 PM on each day.
it describes the bony anatomy including the femoral head , acetabulum, labrum . also discusses the capsule , ligaments . muscle that act on the hip joint and the range of motion are outlined. factors affecting hip joint stability and weight transmission through the joint are summarized.
This slide is special for master students (MIBS & MIFB) in UUM. Also useful for readers who are interested in the topic of contemporary Islamic banking.
The simplified electron and muon model, Oscillating Spacetime: The Foundation...RitikBhardwaj56
Discover the Simplified Electron and Muon Model: A New Wave-Based Approach to Understanding Particles delves into a groundbreaking theory that presents electrons and muons as rotating soliton waves within oscillating spacetime. Geared towards students, researchers, and science buffs, this book breaks down complex ideas into simple explanations. It covers topics such as electron waves, temporal dynamics, and the implications of this model on particle physics. With clear illustrations and easy-to-follow explanations, readers will gain a new outlook on the universe's fundamental nature.
How to Build a Module in Odoo 17 Using the Scaffold MethodCeline George
Odoo provides an option for creating a module by using a single line command. By using this command the user can make a whole structure of a module. It is very easy for a beginner to make a module. There is no need to make each file manually. This slide will show how to create a module using the scaffold method.
How to Fix the Import Error in the Odoo 17Celine George
An import error occurs when a program fails to import a module or library, disrupting its execution. In languages like Python, this issue arises when the specified module cannot be found or accessed, hindering the program's functionality. Resolving import errors is crucial for maintaining smooth software operation and uninterrupted development processes.
Executive Directors Chat Leveraging AI for Diversity, Equity, and InclusionTechSoup
Let’s explore the intersection of technology and equity in the final session of our DEI series. Discover how AI tools, like ChatGPT, can be used to support and enhance your nonprofit's DEI initiatives. Participants will gain insights into practical AI applications and get tips for leveraging technology to advance their DEI goals.
हिंदी वर्णमाला पीपीटी, hindi alphabet PPT presentation, hindi varnamala PPT, Hindi Varnamala pdf, हिंदी स्वर, हिंदी व्यंजन, sikhiye hindi varnmala, dr. mulla adam ali, hindi language and literature, hindi alphabet with drawing, hindi alphabet pdf, hindi varnamala for childrens, hindi language, hindi varnamala practice for kids, https://www.drmullaadamali.com
THE ENGINEERING ECONOMIST, VOL. , NO. , –http.docx
1. THE ENGINEERING ECONOMIST
–
Adjustments within discount rates to cater for
uncertainty—Guidelines
David G. Carmichael
School of Civil and Environmental Engineering, The University
of New South Wales, Sydney, Australia
ABSTRACT
Deterministic discounted cash flow (DCF) analysis is a well-
accepted
technique in engineering appraisals. Common practice is to
incorpo-
rate all uncertainty influences within a single variable—namely,
the
discount rate—which also represents the time value of money.
Com-
mentary already exists in the literature that such a practice is
expedi-
ent but not rational and has shortcomings. This article examines
the
error involved in this practice and provides guidelines and
precautions
for using blanket or constant discount rates in dealing with
uncertain-
ties. It shows the adjustments necessary for any given
investment sce-
nario. This is done through establishing equivalence of the
2. expected
utility of deterministic and probabilistic present worth, allowing
a rate
adjustment to be calculated. Numerical studies look at the
relationship
or trends of this rate adjustment to the key analysis variables.
Gener-
ally, it is found that the rate adjustment should be decreased as
the
timing of a cash flow’s occurrence increases, increased as the
variance
of the cash flow increases, kept almost as an additive constant
as the
base rate increases, and increased as the investor’s level of risk
aver-
sion increases. The article provides practitioner-friendly usable
guide-
lines for adjusting rates, something that is unavailable
elsewhere in the
literature.
Introduction
Deterministic discounted cash flow (DCF) analysis is a well-
accepted technique in engineer-
ing appraisals, despite the general acknowledgement that
uncertainty exists in the analysis
variables, namely, cash flows, cash flow timing, and interest
rate. (The term “uncertainty” here
is used in the sense of implying probability, likelihood, or
frequency of occurrence, in contrast
to determinism; Carmichael 2016b; Carmichael and Balatbat
2008.) Common practice is to
incorporate all uncertainty influences within a single
parameter—namely, a discount rate—
which also represents the time value of money (Robichek and
3. Myers 1966). And this might be
supplemented with a sensitivity-style analysis. This practice is
expedient, but incorporating
both uncertainty and money time value within the one variable
is not without its troubles;
in particular, a consistent rate encompassing both matters may
not be able to be found and
users are confronted with the difficulty of determining an
appropriate discount rate to use
(Espinoza 2014; Zinn et al. 1977). The practice relocates the
analysis within the comfort zone
CONTACT David G. Carmichael [email protected] School of
Civil and Environmental Engineering, The Uni-
https://doi.org/10.1080/0013791X.2016.1245376
https://crossmark.crossref.org/dialog/?doi=10.1080/0013791X.2
016.1245376&domain=pdf&date_stamp=2017-11-10
mailto:[email protected]
THE ENGINEERING ECONOMIST 323
of determinism and away from a more mathematical but also
more realistic probabilistic DCF
analysis. Users forego accuracy in their investment models in
return for ease of use. Robichek
and Myers (1966), Fama (1996), Halliwell (2001),
Cheremushkin (2009), and others express
concern that a single variable cannot capture both the effect of
uncertainty and the time value
of money.
4. Despite the well-known shortcomings of discount rates,
(deterministic) discounted cash
flow analysis is increasingly being adopted (Block 2005).
According to a recent survey, the
(deterministic) discounted cash flow approach is a dominant
methodology used (KPMG
2013). A potential explanation for this is the simplicity of the
calculations, though they may
not be intuitive. In addition, the inertia of using discount rates,
the comfort of not doing
differently to others, together with human nature’s resistance to
change, may explain its pop-
ularity. However, these and other surveys do not comment in
any depth on the implications
of the incorrect modeling of uncertainty within conventional
(deterministic) discounted flow
analysis.
The literature gives various ways by which discount rates might
be established, such that
multiple influences (and not just uncertainty) are
accommodated. This article only addresses
and quantifies the influence of uncertainty in the choice of
discount rate and only examines
discount rates in the context of assets and infrastructure; that is,
investments where no compa-
rable markets exist. It examines the error involved in the
practice of incorporating uncertainty
within a blanket or constant discount rate and provides
guidelines and precautions for using
blanket discount rates in dealing with uncertainties. This is
done through establishing equiv-
alence of the expected utility of deterministic and probabilistic
present worth, allowing a rate
adjustment to be calculated. Numerical studies look at the
relationship of this rate adjustment
5. to the key analysis variables—namely, the timing of the
investment’s cash flows, the variances
of the cash flows, the base rate assumed, and the risk attitude of
the investor.
The approach of this article is distinguished from other
commentaries on rates and that
also use utility, particularly in the area of certainty equivalence.
Such commentaries include
Robichek and Myers (1966), Berry and Dyson (1980), Dyson
and Berry (1983), Baker and Fox
(2003), and Cheremushkin (2009). In contrast with this article,
Robichek and Myers (1966)
work with individual certainty equivalent cash flows for cash
flows occurring in the future but
do not inform on base rate effects, cash flow variance effects,
multiple cash flows and levels of
risk aversion, and use the risk-free rate rather than a general
base rate. Berry and Dyson (1980)
and Dyson and Berry (1983) do similarly but do now allow cash
outflows and investment
markets, whereas Baker and Fox (2003) and Cheremushkin
(2009) model uncertain cash flows
as time series, which do not apply to non-market-oriented
investments. This article explicitly
uses utility functions on the present worth rather than on cash
flows, because it is the collective
present worth of all cash flows (of any sign) that is of
paramount concern to the investor, rather
than individually occurring cash flows at different points in
time with differing uncertainty
and magnitude; this article also goes directly to the rate
adjustment rather than having to infer
the adjustment, and because no markets are involved, it makes
no distinction among sources
of uncertainty.
6. The article is structured in the following way. The article first
reviews suggestions for how
discount rates might be established. Demonstration results are
given whereby a rate adjust-
ment is established for a range of values of the underlying
analysis variables of cash flow vari-
ance, cash flow timing, base rate, and risk attitude. This is
followed by summarized guidelines.
The method behind the equivalence calculations is provided in
the Analysis and Numerical
Studies sections.
324 D. G. CARMICHAEL
The article’s results will be of interest to anyone who uses
discounted cash flow analysis. The
article provides practitioner-friendly usable guidelines for
adjusting rates, something that is
unavailable elsewhere in the literature.
Background
The literature gives various ways by which discount rates might
be established. This arti-
cle only examines discount rates in the context of assets and
infrastructure—that is, invest-
ments where no comparable markets exist—and looks at
uncertainty in isolation from other
influences.
Sensitivity-style analyses, scenario testing, and Monte Carlo
simulation can assist in under-
standing the influence of uncertainty but do not say anything
7. directly about the choice of an
appropriate discount rate. Uncertainty could be double counted
in these approaches if the
discount rate used already has been adjusted for uncertainty.
Rate adjustment
Common deterministic DCF analysis incorporates uncertainty
using risk-adjusted discount
rates. Rates are adjusted to take into account uncertainty, among
other things. A premium
or loading is added to a base rate to give a discount rate. The
intent is that the premium
should compensate the investor for investment uncertainty.
Generally, premiums and dis-
count rates are increased in line with greater perceived
uncertainty. This leads to lower cal-
culated present worths (or net present value), lower calculated
profitability of the investment,
and lower weight being given to cash flows further into the
future.
A risk-adjusted discount rate oversimplifies an investment
model. Among other things, it
does not represent uncertainty well throughout the duration of
an investment. It would be
possible to change the rate over time or to use a different rate
for each cash flow, for example,
but this appears to be rarely done (Fama 1977). Such an
adjusted rate approach disconnects
uncertainties from their actual sources and implicitly assumes
that uncertainty and time are
interchangeable. This can lead, among other things, to cash
flows being wrongly valued and
weakens an investor’s ability to connect an investment’s return
with its source of uncertainty.
8. Some attempt in the literature has been made to separate
uncertainty and the time value of
money; for example, through adjusting the cash flows rather
than the base rate (Baker and
Fox 2003; Berry and Dyson 1980; Cheremushkin 2009; Dyson
and Berry 1983; Robichek and
Myers 1966).
Halliwell (2001) comments that the current use of adjustments
for uncertainty to calculate
discount rates is subjective and inconsistent, whereas Baker and
Fox (2003) comment that the
current selection of the magnitude of the rate adjustment
appears somewhat arbitrary and
varies among investors. In the survey of Block (2005, p. 62),
when adjusting for uncertainty,
some firms considered “risk to be a concept that cannot be
appropriately quantified and sim-
ply use a subjective approach.” Uncertainty and the time value
of money are separate issues
and hence there can be no unique adjustment (Robichek and
Myers 1966), with investors
consequently adopting different, and inconsistent, practices.
When dealing simultaneously with both positive and negative
cash flows, the usual notion
of using higher discount rates for cash flows with higher
uncertainty may lead to anomalous
practices. Some investors discount negative cash flows at a
lower rate than the risk-adjusted
rate and positive cash flows at the risk-adjusted rate, but this is
an inconsistent treatment of
THE ENGINEERING ECONOMIST 325
9. uncertainty. The choice of discount rate for negative cash flows
should reflect their uncertainty
and not be because they are negative (Ariel 1998; Cheremushkin
2009). The uncertainty fun-
damentally lies in the cash flows, not the discount rate.
Other methods of establishing discount rates
There exist methods for establishing discount rates, peculiar to
investments where com-
parable markets exist, rather than being applicable to asset and
infrastructure investments
other than by analogy. Some do not incorporate uncertainty
effects. Most of these meth-
ods relying on markets do not transfer well to non-market-
oriented investments, because
of issues with finding comparable proxies and separating
diversifiable from nondiversifi-
able uncertainties (Espinoza 2014). However, having said that,
many investors are com-
fortable using analogies between the two. There also exist
methods for establishing dis-
count rates, either directly or indirectly, incorporating multiple
influences beyond uncer-
tainty or not addressing uncertainty and hence not directly
applicable to this article. Some
of these other methods, commonly mentioned in books—for
example Damodaran (2001,
2007a, 2007b), Bodie (2011), Brealey et al. (2011), and Ross et
al. (2013)—as well as other
citations in this article include implied discount rates; capital
asset pricing model (Bren-
nan 1997; Fama 1996; Fama and French 2004; Lintner 1965;
Sharpe 1964); opportunity
cost of capital; cost of debt/funds; cost of equity, dividend
10. growth model; weighted average
cost of capital (WACC; Block 2011); social time preference
(National Oceanic and Atmo-
spherica Administration 2014); past projects or real
investments; post valuation adjust-
ment; illiquidity discount; rates related to the investment time
horizon (Gollier 2002); syn-
thetic insurances (Espinoza 2014; Espinoza and Morris 2013);
and the certainty equivalent
method.
Espinoza (2014) gives commentary on some of these methods.
Generally, the methods lead
to different values for the discount rate (Bruner et al. 1998;
JPMorgan 2008). Commentary
on industry adoption of these approaches is given, for example,
in Block (2005) and KPMG
(2013). The survey of Block (2005, pp. 60, 62) gives:
Although [deterministic] discounted cash flow methods (based
on NPV or IRR) are almost uni-
versal, the same cannot be said for the discount rate. There are a
number of approaches for adjust-
ing for risk. … The most common is to adjust the discount rate
for risk [according to] low-risk
projects are assigned the minimum discount rate and high-risk
projects the maximum rate.
Analysis
In order to establish the relationship between rate adjustment
and uncertainty, equivalence
between deterministic DCF and probabilistic DCF results is
used here in conjunction with
expected utility. The following develops the analysis in terms of
its components: present
11. worth, utility, and expected utility. The notation used in the
article is as follows:
bi constants
COV coefficient of variation
E[] expected value
Var[] variance
PW present worth
r interest or discount rate
RA risk aversion coefficient
326 D. G. CARMICHAEL
u, U utility
Xi cash flow in period i, i = 0, 1, 2, …, n
α, β, γ constants
ρi j correlation coefficients between Xi and Xj
Consider a general set of cash flows over time. Let the net cash
flow at period i, i = 0, 1, 2,
…, n, be Xi, characterized by its expected value E[Xi] and
variance Var[Xi]. Then,
E[PW] =
n∑
i=0
biE[Xi]
(1 + r)i (1a)
12. Var[PW] =
n∑
i=0
b2iVar[Xi]
(1 + r)2i + 2
n−1∑
i=0
n∑
j=i+1
bibjρi j
√
Var[Xi]
√
Var[Xj]
(1 + r)i+ j , (1b)
where PW is present worth, r is the interest or discount rate, bi
are constants (typically, +1
and −1), and ρi j are the correlation coefficients between Xi and
Xj. For the deterministic case,
the variances are set to zero. Monte Carlo simulation could also
be used to get information
on present worth, alternative to the second-order moment results
(1a, 1b), but in numerical
form only. To include variability in the interest rates, in
addition to cash flows, see Carmichael
and Bustamante (2014).
13. Utility is a measure of value and preferences, which may be
represented in a utility func-
tion. Value and preference may depend not only on the
magnitude of a return, but also its
probability as well as the financial status of the investor. Each
investor could be anticipated to
have its own utility function, but commonly these functions
might be grouped as being risk
averse, risk neutral, or risk seeking. Risk aversion is associated
with accepting lower but more
certain investment returns compared to higher but less certain
returns (Ang and Tang 1984).
Commonly, investors are considered risk averse (Brealey et al.
2011).
Consider a general utility function for present worth, applicable
over the range of present
worths anticipated in the investment. Here a quadratic is used,
but other forms (for example,
exponential and logarithmic) are possible (Ang and Tang 1984):
u(PW ) = αPW2 + βPW + γ , (2)
where u is utility, and α, β, and γ are constants, different for
each investor and investment
circumstances. The establishment of utility functions is well
documented in the literature and
is not repeated here. Ang and Tang (1984, p. 74) note that
the expected utility is relatively insensitive to the form of the
utility function at a given level of
risk-aversion, and that the expected utility does not change
significantly over a wide range of risk-
aversion coefficients. Hence, the exact form of the utility
function may not be a crucial factor in
14. the computation of an expected utility. Moreover, the risk-
aversiveness coefficient in the utility
function need not be very precise; that is, any error in the
specification of the risk-aversiveness
coefficient may not result in a significant difference in the
calculated expected utility.
Further comment is given below on utility functions.
The second derivative of u gives an indication of the risk
attitude. The degree of risk aver-
sion, RA, is sometimes measured by
RA(PW ) = −u
′′(PW )
u′(PW )
. (3)
THE ENGINEERING ECONOMIST 327
Expected utility becomes, using a Taylor series expansion of u
about E[PW],
E[U] ∼= αE2[PW] + βE[PW] + γ + αVar[PW] (4)
The more general version of this can be found in Benjamin and
Cornell (1970), Ang and
Tang (1984), and Carmichael (2014). Such an expansion is valid
for usual utility function
shapes. Markowitz (2014) gives portfolio commentary on mean–
variance approximations to
expected utility.
15. Expected utility is used in the following to establish the rate
adjustment necessary for the
deterministic DCF analysis (using discount rates) to give
equivalence with the true proba-
bilistic DCF analysis. Two scenarios are considered:
1. A base interest rate together with probabilistic cash flows.
2. A discount rate (including the base rate and an adjustment)
together with deterministic
cash flows.
Equivalence between these two scenarios is established through
expected utility. That is,
the analysis is addressing the question: If investors wish to use
discount rates and assume
deterministic cash flows (as is common practice) as a substitute
for base interest rates and
true probabilistic cash flows, how different should base interest
rates and discount rates be?
Alternatively, by how much does the base interest rate need to
be adjusted in order to get a
correct discount rate? This is established by using expected
utility as a measure of the goodness
of an investment. Expected utility for the two above scenarios is
equated.
For the same cash flows and the same rate, the expected utility
for the deterministic case
will be different from that for the probabilistic case. To make
them equivalent requires an
adjusted rate or adding a premium or loading to the base rate for
the deterministic case.
Note that, with the second-order approach given above, no
assumptions are being made
16. on the probability distributions of any of the variables and, in
particular, of the cash flows or
the present worth. The base rate can be determined by any
means that the user wishes, such
as using a risk-free rate or WACC; the article’s results do not
depend on this choice. The cash
flow variance can also be established by any means that the user
wishes; the article’s results do
not depend on this choice.
Numerical studies
Introduction
A range of numerical studies, covering example cash flows,
cash flow uncertainty, cash flow
timing, base interest rates, and typical utility functions, is
given. These are example results of
a much larger numerical experimentation but represent typical
results. The range of values
used in the experimentation covers typical commercial values.
To establish how much base
rates should be adjusted to give discount rates, in the presence
of uncertainty, the approach
to the studies proceeds as in the following. Each analysis
includes
1. A utility function is chosen over the possible range of PW.
This gives α, β, and γ in
Equation (2).
2. A cash flow regime is chosen, with each cash flow, Xi,
occurring at time i, characterized
by its moments, E[Xi] and Var[Xi].
3. A base interest rate is chosen. This gives E[PW], Var[PW],
17. and E[U] for the general
probabilistic case, according to Equations (1a), (1b), and (4).
328 D. G. CARMICHAEL
Risk aversion
coefficients shown in the legend. Increasing risk
aversiveness from bottom to top.
4. Also using Equations (1a) and (4), an adjusted rate (discount
rate; leading to E[PW]
for the deterministic case) is calculated such that E[U] for both
the probabilistic and
deterministic cases is the same.
Two cases are not considered. First, risk seeking attitude is not
given as “such preference
behavior is ordinarily not realistic” (Ang and Tang 1984, p. 72).
Comments only are given on
the influence of risk seeking attitudes. Second, negative present
worths are not examined on
the basis that investors would ordinarily desire positive present
worths.
The following variables and associated numerical ranges are
considered in the numerical
experimentation:
� Levels of uncertainty in the cash flow. This is measured in
terms of cash flow coefficient
of variation (COV). Cash flow COV values range from 0.05 to
0.15.
� Singly occurring cash flows and uniform series of cash flows.
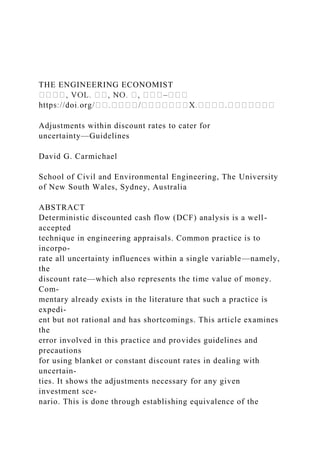
18. � Time into the future at which the cash flow occurs. Times
range from 1 to 10 years.
� The base interest rate, to which an additive adjustment is
made to give a discount rate.
Base interest rates range from 0.05 (5% per annum) to 0.15
(15% per annum).
� The level of risk aversion of the investor. Figure 1 shows the
utility functions used in
the analysis, ranging from risk neutral to risk averse.
(Comments only are given on risk
seeking attitudes.) These are typical utility functions,
representative of different levels of
risk aversion. The risk aversion coefficients, RA, given in
Figure 1 are those evaluated at
E[PW]. The risk aversion coefficient for a quadratic utility
function varies with the value
of PW used in its evaluation.
Demonstration of adjustments needed
Using the above analysis, Figures 2 to 7 illustrate the type of
adjustment that needs to be made
to blanket or constant discount rates where uncertainty is
present. By implication, they also
show the errors involved in assuming constant discount rates in
the presence of uncertainty.
All rate adjustments shown are additive to the base rate.
Figures 2 to 7 are examples of a much larger numerical
experimentation but represent typi-
cal results. The range of values used in the experimentation
covers typical commercial values.
Single cash flow
Figures 2 to 4 show typical results for a single cash flow
19. occurring at a future time. RA is the
level of risk aversion defined in Equation (3). COV is the
coefficient of variation. Base rate is
the constant discount rate to which an adjustment is applied.
THE ENGINEERING ECONOMIST 329
Although not presented here, adjustments for the risk-seeking
case are opposite in sign to
those for the risk averse case.
Uniform cash flows
Figures 5 to 7 show typical results for a uniform series of cash
flows starting in year 1 and
proceeding variously up to year 1, 4, 7, and 10. The coefficient
of variation, COV, refers to
330 D. G. CARMICHAEL
20. the cash flow at each year. Figures 5 to 7 are given for cash
flows in each year being perfectly
correlated; lesser correlation (including independence) leads to
lower adjustments.
General collection of cash flows
For a general collection of cash flows and correlation
assumptions, the analysis does not
change; however, it can be harder to isolate the influence of a
mixture of analysis inputs.
Fi
THE ENGINEERING ECONOMIST 331
Summary
In summary, the numerical experimentation shows that
deterministic DCF analysis using
blanket discount rates does not accurately incorporate an
investment’s uncertainty. This
affects any conclusions on investment viability. The resultant
present worth calculated will
be wrongly valued.
The numerical study results can be summarized as follows:
� Risk-neutral attitudes lead to no adjustment of the base rate.
Risk-averse attitudes require
rate adjustment according to the following points.
� With increasing base interest rate, the additive adjustment
21. decreases slightly but is almost
constant. (As a proportion of the base rate, it decreases.)
� With increasing time, i, into the future at which the cash flow
occurs, the adjustment
decreases (with the rate of adjustment decreasing with time). No
adjustment is necessary
at long times into the future.
� With increasing uncertainty in the cash flow (as measured by
the cash flow COV), the
adjustment increases (with the rate of adjustment increasing
with COV).
� With increasing level of risk aversion, the adjustment
increases.
Depending on where the present worth expected value lies
within the utility function, the
results will change but still the trends will remain. Accordingly,
the values given in Figures 2 to
7 are not to be taken as definitive but rather as indicating
trends. To establish specific numer-
ical values, rather than trends, each investor needs its own
utility function and analysis for
each investment case.
For identical utility functions, but applying over different
magnitudes of present worth, the
form of adjustment remains unchanged for different magnitudes,
only varying with the cash
flow coefficient of variation. However, it is anticipated that
investors’ utility functions would
change, depending on the degree of risk aversion exhibited,
with increasing magnitudes of
present worth involved.
22. The analysis for multiple cash flows is no different than that for
a single cash flow or uni-
form series of cash flows. Some extensions can be argued (by
comparison with a single cash
flow) using Equations (1a) and 1(b) and Figures 2 to 7 to apply
to multiple cash flows.
Comparison with the literature
Existing literature analyzing the influence of uncertainty on
discount rates tends to be directed
at market-oriented investments rather than real assets as in this
article. Hence, the treatment
and categorization of uncertainty is different. The present
article looks at an investment’s
total cash flow uncertainty, rather than components of
uncertainty. In addition, different from
existing methods is the choice of the base interest rate.
Generally, market-oriented treatments
use a risk-free rate as a base. In the present article, the user is
able to select any base rate that
is considered appropriate, including the risk-free rate, WACC,
or other. The results are not
dependent on what this base rate is, unlike market-oriented
treatments.
It is believed that the present article provides a more complete
understanding of discount
rate determination in the presence of cash flow uncertainty for
real assets compared to existing
methods. Existing methods of establishing a risk-adjusted
discount rate tend to be subjective
and inconsistent (Halliwell 2001). Users attempt to
acknowledge the uncertainty associated
with cash flows with a rate adjustment that does not accurately
23. reflect an investment’s uncer-
tainty. A strong argument against the current practice of using
risk-adjusted discount rates is
that the adjustment adopted is a constant over time and over
different cash flows and does not
332 D. G. CARMICHAEL
Increases in Will lead to adjustments being
Base interest rate Slightly lower; almost constant (but
proportionally lower)
The future timing of cash flows Lower
Cash flow uncertainty Higher
Risk aversion Higher
reflect the true underlying cash flow uncertainty. This article’s
results show the deficiencies in
such an approach; here it is shown that the adjustment needs to
change with level of cash flow
uncertainty, cash flow timing, and degree of risk aversion but
only mildly with base rate. With
possibly the exception of a change in the base rate, the rate
adjustments are not constant over
these variables.
The time variability of adjustments shown in Figure 2 is in
agreement with the arguments
of Weitzman (1998) and Gollier (2002), the implied rates in
Espinoza (2014) using synthetic
insurances, and the real option results of Carmichael et al.
(2011) and Carmichael (2014,
24. 2016a). The time influences in Figure 2 also agree in form with
Robichek and Myers (1966),
Berry and Dyson (1980), Dyson and Berry (1983), Baker and
Fox (2003), and Cheremushkin
(2009). However, these papers are silent on the influence of the
base rate and cash flow vari-
ance. On the influence of the level of risk aversion, the
qualitative comments in these papers
agree with Figures 3 and 6.
The negative adjustment comment is consistent with Berry and
Dyson (1980) and Dyson
and Berry (1983).
Guidelines
In using discount rates and a deterministic DCF analysis, Table
1 gives guidelines for adjusting
the rate to take care of uncertainty in the cash flows.
These guidelines provide a rate adjustment that more accurately
represents an investment’s
cash flow uncertainty over existing methods. In order to use the
article’s findings, it is neces-
sary that users only understand their level of risk aversion
(ranging from risk neutral through
to low, medium, and high risk aversion), not that they be able to
generate their own utility
functions. For accurate adjustments for any given situation,
users should develop their own
utility function and apply their own values substituted into
Equations (1) to (4).
Conclusions
A single blanket or constant discount rate is not able to
25. simultaneously represent the time
value of money and uncertainty. The article shows the
limitations and errors involved in
requiring the discount rate to do this but also provides, on a
case-by-case basis, a way of
adjusting rates such that the errors are minimized. The
requirement for adjustments demon-
strates that errors are involved in using blanket discount rates.
The article’s results show that
the adjustment varies with timing of the cash flow, cash flow
uncertainty, and level of risk
aversion but only mildly with the base rate. By not
appropriately acknowledging investment
uncertainty, any conclusions on investment viability can be
questioned.
The article showed trends relating to the influence of the
underlying analysis variables. It
showed the quantitative adjustments necessary for any given
investment scenario. Generally,
it is found that the rate adjustment should be decreased as the
cash flow timing increases,
THE ENGINEERING ECONOMIST 333
increased as the variance of the cash flows increases, kept
almost constant as the base rate
increases, and increased as the investor’s level of risk aversion
increases.
In the absence of a full probabilistic analysis, the guidelines
presented here represent a way
forward if deterministic analysis is pursued, as is the current
custom. Users are now able to
26. make a more informed approach to rate adjustment, rather than
it being arbitrary. The article’s
results will be useful not only for single investments but also in
the comparison of multiple
investments involving uncertain cash flows, where the cash flow
timing and uncertainty differ
across the different investments.
The numerical results are based on assumptions regarding
utility. Each person and organi-
zation has its own utility function and this can change
depending on the type and magnitude
of an investment and the range of present worth anticipated.
There is no standardized util-
ity function that can be applied to all investments. Here, typical
utility functions for different
levels of risk aversion are used. Using the theory presented in
this article, each person or orga-
nization could incorporate its own utility function and cash
flows and derive a specific rate
adjustment. The trends demonstrated in this article are not
anticipated to change, though
particular numerical values will. Utility is not totally embraced
by everyone, but it has strong
support and appears frequently in the commerce literature.
Accordingly, it is emphasized that
the article’s results have this qualification.
Further research
More extensive numerical studies could be performed to verify
the article’s results, in partic-
ular, looking at the influence of the investor’s degree of risk
aversion as represented by utility
functions. Ultimately, an aim of further research might be to
develop a function for the rate
27. adjustment that incorporates all of the key investment variables.
The research only accounted
for uncertainty in cash flows and assumes no uncertainty in the
base rate uncertainty
and no uncertainty in the cash flow timing. Uncertainty in the
interest rate could be included
through the results of Carmichael and Bustamante (2014). See
also Carmichael and Handford
(2015).
With present worth being calculated from a nonlinear
expression and with the quadratic
used for utility, the combined nonlinearity prevented obtaining
any closed-form result. The
rate adjustment occurs within the denominator raised to a
power. Restricted closed-form
results may, however, be possible using an exponential utility
curve.
Notes on contributor
David G. Carmichael is a Professor of Civil Engineering and
former Head of the Department of Engi-
neering Construction and Management at the University of New
South Wales, Australia. He is a grad-
uate of the Universities of Sydney and Canterbury; a Fellow of
the Institution of Engineers, Australia; a
Member of the American Society of Civil Engineers; and a
former graded arbitrator and mediator. Pro-
fessor Carmichael publishes, teaches, and consults widely in
most aspects of project management, con-
struction management, systems engineering, and problem
solving. He is known for his leftfield thinking
on project and risk management (Project Management
Framework, A. A. Balkema, Rotterdam, 2004),
project planning (Project Planning, and Control, Taylor and
28. Francis, London, 2006), problem solving
(Problem Solving for Engineers, CRC Press, Taylor and Francis,
London, 2013), and infrastructure invest-
ment (Infrastructure Investment: An Engineering Perspective,
CRC Press, Taylor and Francis, London,
2014).
334 D. G. CARMICHAEL
References
Ang, A.H.-S. and Tang, W. H. (1984) Probability concepts in
engineering planning and design. Vol. 2.
John Wiley & Sons, New York.
Ariel, R. (1998) Risk adjusted discount rates and the present
value of risky costs. The Financial Review,
33(1), 17–30.
Baker, R. and Fox, R. (2003) Capital investment appraisal: a
new risk premium model. International
Transactions in Operational Research, 10(2), 115–126.
Benjamin, J.R. and Cornell, C.A. (1970) Probability, statistics,
and decision for civil engineers. McGraw-
Hill, New York.
Berry, R.H. and Dyson, R.G. (1980) On the negative risk
premium for risk adjusted discount rates.
Journal of Business Finance and Accounting, 7(3), 427–436.
Block, S. (2005) Are there differences in capital budgeting
procedures between industries? The Engi-
neering Economist, 50(1), 55–67.
29. Block, S. (2011) Does the weighted average cost of capital
describe the real-world approach to the dis-
count rate? The Engineering Economist, 56(2), 170–180.
Bodie, Z. (2011) Investments. 9th ed. McGraw-Hill Irwin, New
York.
Brealey, R., Myers, S. and Allen, F. (2011) Principles of
corporate finance. 10th ed. McGraw-Hill Irwin,
New York.
Brennan, M.J. (1997) The term structure of discount rates.
Financial Management, 26(1), 81–90.
Bruner, R., Eades, K., Harris, R. and Higgins, R. (1998) Best
practices in estimating the cost of capital:
survey and synthesis. Financial Practice and Education, 1, 13–
28.
Carmichael, D.G. (2014) Infrastructure investment: an
engineering perspective. CRC Press, London.
Carmichael, D.G. (2016a) A cash flow view of real options. The
Engineering Economist. [Epub ahead of
print]. Available at
http://dx.doi.org/10.1080/0013791X.2016.1157661 (accessed
April 12, 2016).
Carmichael, D.G. (2016b) Risk—a commentary. Civil
Engineering and Environmental Systems, 33(3),
177–198.
Carmichael, D.G. and Balatbat, M.C.A. (2008) Probabilistic
DCF analysis, and capital budgeting and
investment—a survey. The Engineering Economist, 53(1), 84–
102.
Carmichael, D.G. and Bustamante, B.L. (2014) Interest rate
30. uncertainty and investment value—a second
order moment approach. International Journal of Engineering
Management and Economics, 4(2),
176–189.
Carmichael, D.G. and Handford, L.B. (2015) A note on
equivalent fixed-rate and variable-rate loans;
borrower’s perspective. The Engineering Economist, 60(2),
155–162.
Carmichael, D.G., Hersh, A.M. and Parasu, P. (2011) Real
options estimate using probabilistic present
worth analysis. The Engineering Economist, 56(4), 295–320.
Cheremushkin, S.V. (2009) Revisiting modern discounting of
risky cash flows. Available at
http://papers.ssrn.com/sol3/papers.cfm?abstract_id=1526683
(accessed December 10, 2015).
Damodaran, A. (2001) Investment valuation. 2nd ed. John Wiley
& Sons, New York.
Damodaran, A. (2007a) Strategic risk taking: a framework for
risk management. Pearson Prentice Hall,
New York.
Damodaran, A. (2007b) Valuation approaches and metrics: a
survey of the theory and evidence. John
Wiley & Sons, New York.
Dyson, R.G. and Berry, R.H. (1983) On the negative risk
premium for risk adjusted discount rates: a
reply. Journal of Business Finance and Accounting, 10(1), 157–
159.
Espinoza, R.D. and Morris, J.W.F. (2013) Decoupled NPV: a
31. simple, improved method to value infras-
tructure investments. Construction Management and Economics,
31(5), 471–496.
Espinoza, R.D. (2014) Separating project risk from the time
value of money: a step toward integration
of risk management and valuation of infrastructure investments.
International Journal of Project
Management, 32(6), 1056–1073.
Fama, E.F. (1977) Risk-adjusted discount rates and capital
budgeting under uncertainty. Journal of
Financial Economics, 5(1), 3–24.
Fama, E.F. (1996) Discounting under uncertainty. The Journal
of Business, 69(4), 415–428.
Fama, E.F. and French, K. (2004) The capital asset pricing
model. Journal of Economic Perspectives, 18(3),
25–46.
Gollier, C. (2002) Time horizon and the discount rate. Journal
of Economic Theory, 107(2), 463–473.
https://doi.org/10.1080/0013791X.2016.1157661
http://papers.ssrn.com/sol3/papers.cfm?abstract_id=1526683
THE ENGINEERING ECONOMIST 335
Halliwell, L. (2001) A critique of risk-adjusted discounting.
Paper read at 32nd International
Actuarial Studies in Non-Life Insurance Colloquium,
Washington, DC, July 8–11. Available
at
http://www.actuaires.org/ASTIN/Colloquia/Washington/Halliwe
32. ll.pdf. (accessed December 10,
2015).
JPMorgan. (2008) The most important number in finance: the
quest for the market risk pre-
mium. JPMorgan, New York. Available at
https://www.jpmorgan.com/cm/BlobServer/
JPMorgan_CorporateFinanceAdvisory_MostImportantNumber.p
df?blobkey=id&blobwhere=
1320675769380&blobheader=application/pdf&blobheadername1
=Cache-Control&blobheader
value1=private&blobcol=urldata&blobtable=MungoBlobs
(accessed December 10, 2015).
KPMG. (2013) Valuation practices survey, KPMG, Sydney,
Australia. Available at https://www.kpmg.
com/AU/en/IssuesAndInsights/ArticlesPublications/valuation-
practices-survey/Documents/
valuation-practices-survey-2013-v3.pdf (accessed December 10,
2015).
Lintner, J. (1965) The valuation of risk assets and the selection
of risky investments in stock portfolios
and capital budgets. Review of Economics and Statistics, 47(1),
13–37.
Markowitz, H. (2014) Mean–variance approximations to
expected utility. European Journal of Opera-
tional Research, 234(2), 346–355.
National Oceanic and Atmospherica Administration. (2014)
Discounting and time preference. National
Oceanic and Atmospheric Administration, Washington, DC.
Available at http://www.csc.noaa.gov/
archived/coastal/economics/discounting.htm (accessed
December 10, 2105)
33. Robichek, A.A. and Myers, S.C. (1966) Conceptual problems in
the use of risk adjusted discount rates.
The Journal of Finance, 21(4), 727–730.
Ross, S.A., Westerfield, R.W. and Jordan, B.D. (2013)
Fundamentals of corporate finance. 10th ed.
McGraw-Hill Irwin, New York.
Sharpe, W.F. (1964) Capital asset prices: a theory of market
equilibrium under conditions of risk. Journal
of Finance, 19(3), 425–442.
Weitzman, M.L. (1998) Why the far-distant future should be
discounted at its lowest possible rate. Jour-
nal of Environmental Economics and Management, 36, 201–208.
Zinn, C.D., Lesso, W.G. and Motazed, B. (1977) A probabilistic
approach to risk analysis in capital
investment projects. The Engineering Economist, 22(4), 239–
260.
http://www.actuaires.org/ASTIN/Colloquia/Washington/Halliwe
ll.pdf
https://www.jpmorgan.com/cm/BlobServer/JPMorgan_Corporate
FinanceAdvisory_MostImportantNumber.pdf?blobkey=id&blob
where=1320675769380&blobheader=application/pdf&blobheade
rname1=Cache-
Control&blobheadervalue1=private&blobcol=urldata&blobtable
=MungoBlobs
https://www.kpmg.com/AU/en/IssuesAndInsights/ArticlesPublic
ations/valuation-practices-survey/Documents/valuation-
practices-survey-2013-v3.pdf
http://www.csc.noaa.gov/archived/coastal/economics/discountin
g.htm
34. Copyright of Engineering Economist is the property of Taylor &
Francis Ltd and its content
may not be copied or emailed to multiple sites or posted to a
listserv without the copyright
holder's express written permission. However, users may print,
download, or email articles for
individual use.
AbstractIntroductionBackgroundRate adjustmentOther methods
of establishing discount ratesAnalysisNumerical
studiesIntroductionDemonstration of adjustments
neededSummaryComparison with the
literatureGuidelinesConclusionsFurther researchNotes on
contributorReferences