Download to read offline
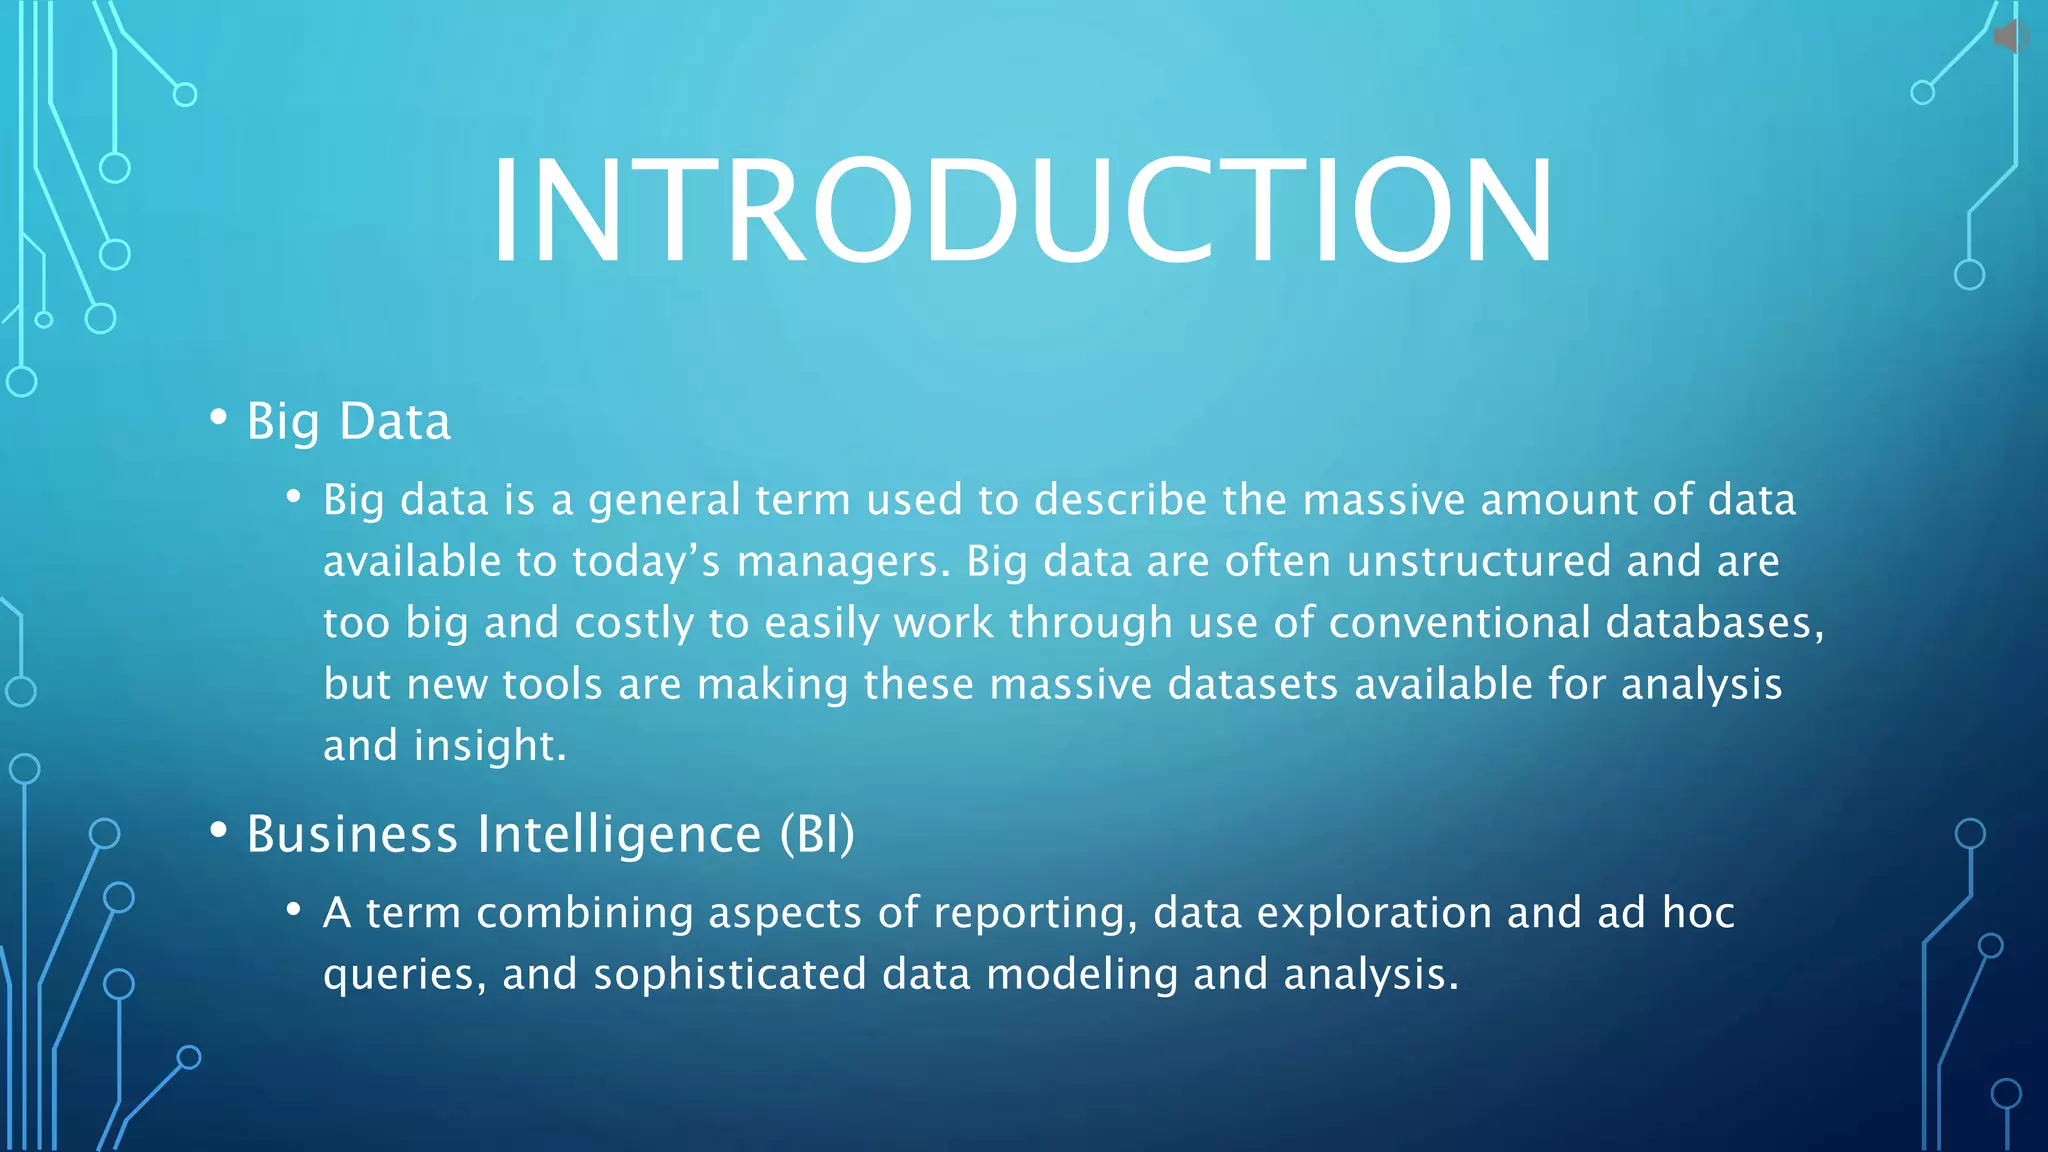
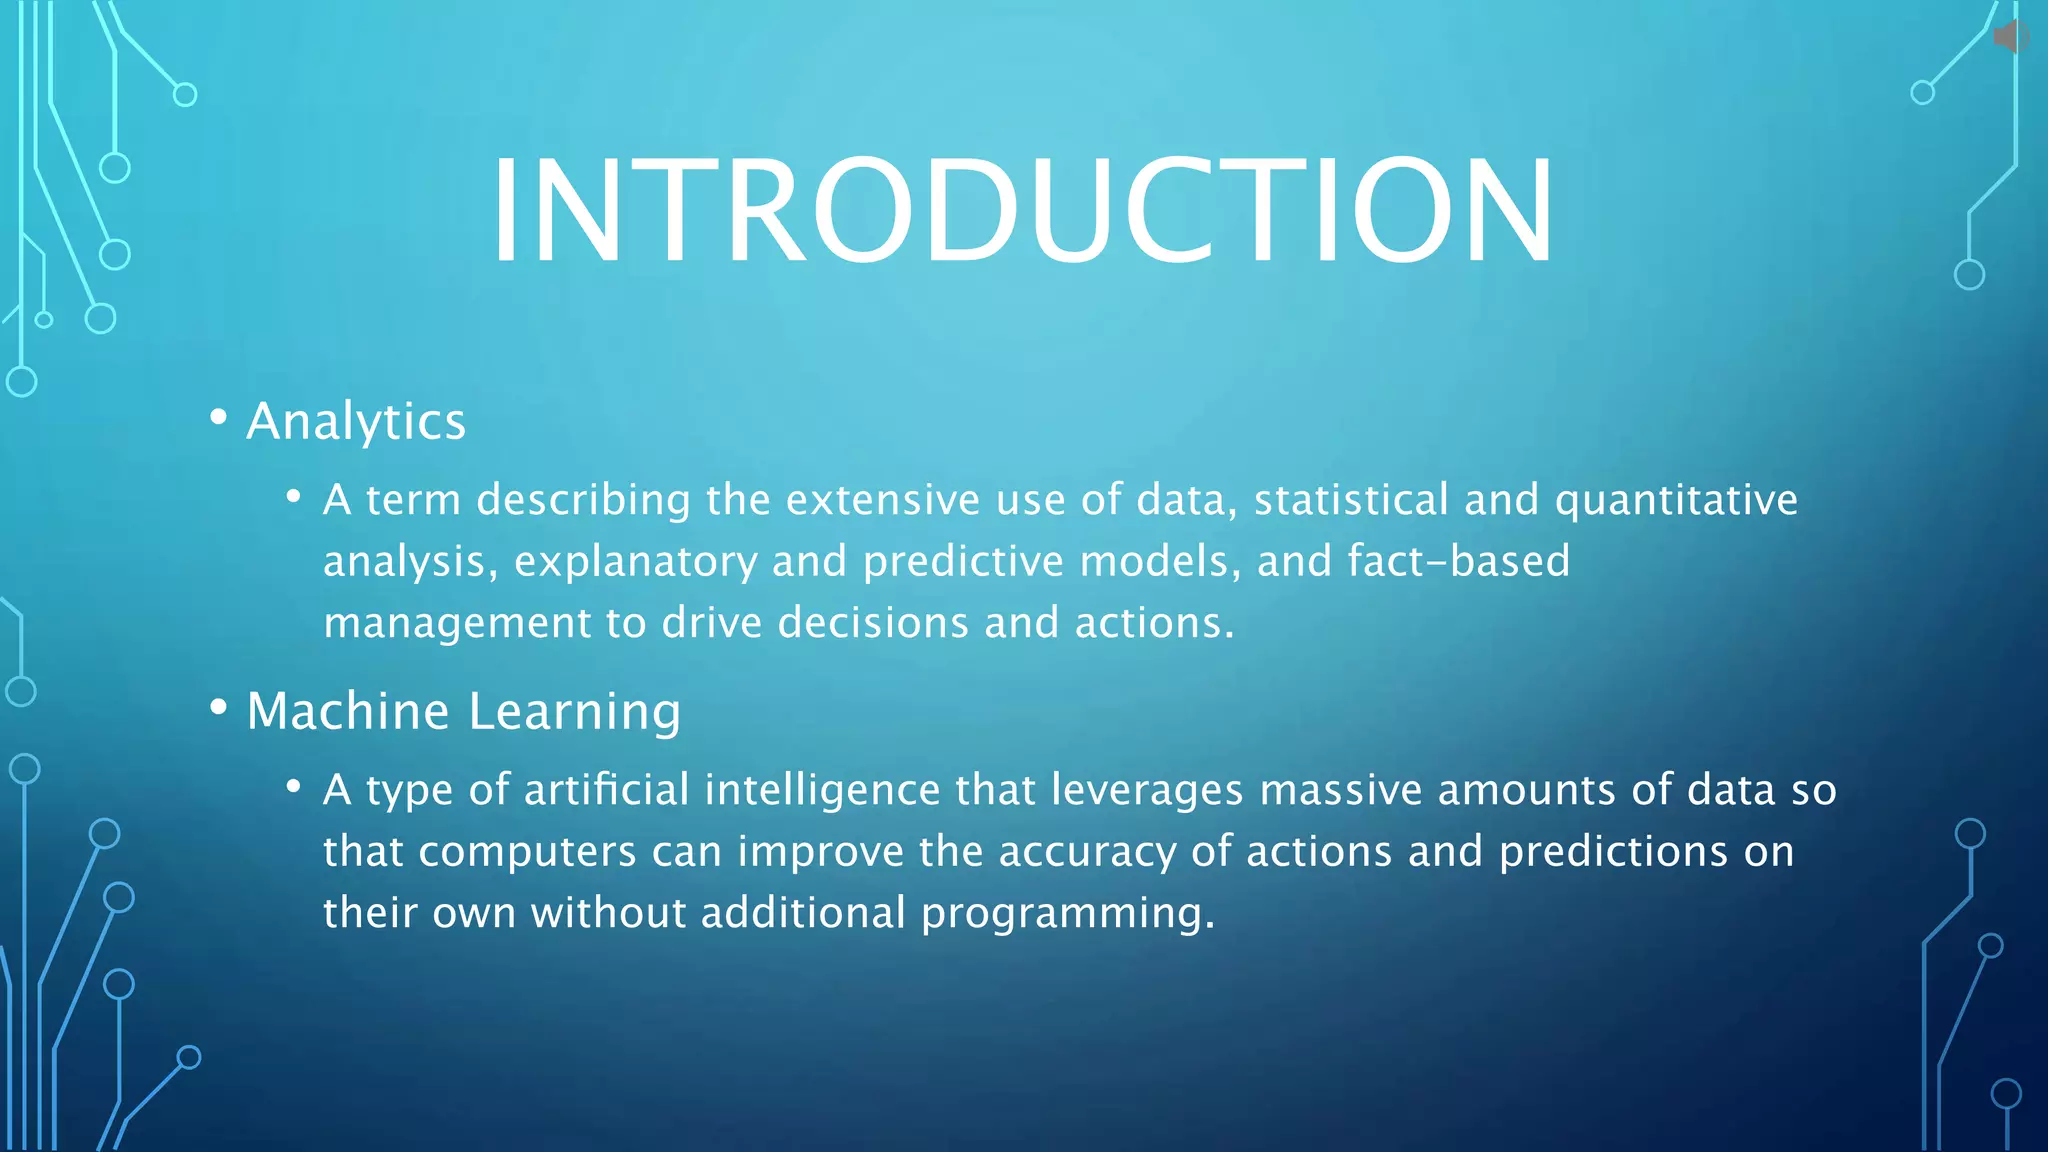


The document discusses the evolving landscape of decision-making driven by standardized data, access to third-party datasets, and advancements in computing technology. It covers concepts such as big data, business intelligence, analytics, and machine learning, emphasizing their roles in supporting data-driven management and competitive advantage. It also highlights that while data can provide a competitive edge, organizations must utilize new tools to effectively leverage it, as simply acquiring data is not sufficient for sustained advantages.


![Vibe Coding vs. Spec-Driven Development [Free Meetup]](https://cdn.slidesharecdn.com/ss_thumbnails/vibecodingvsspecdrivendevelopment-251209105622-43f455e7-thumbnail.jpg?width=640&height=640&fit=bounds)


