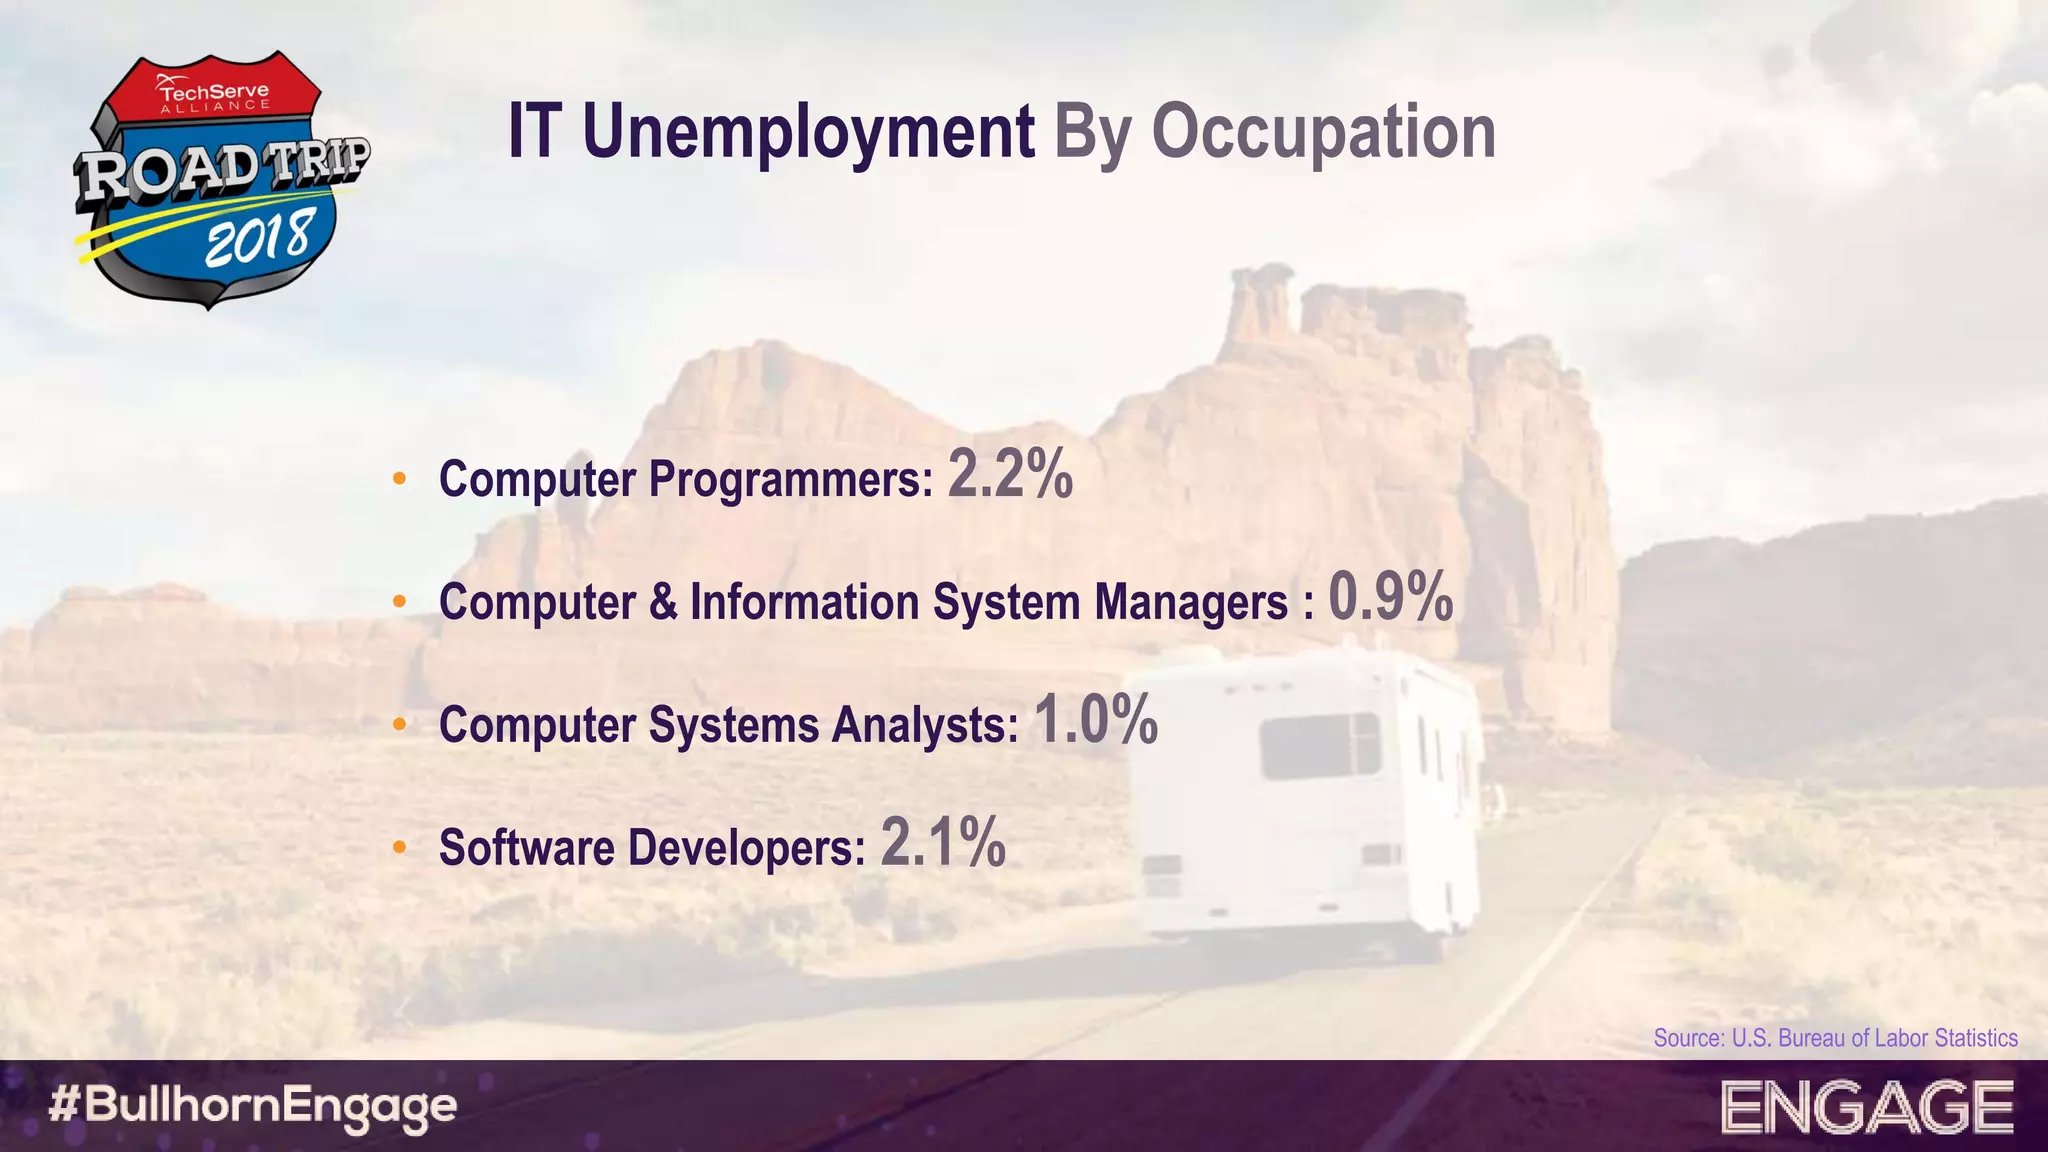
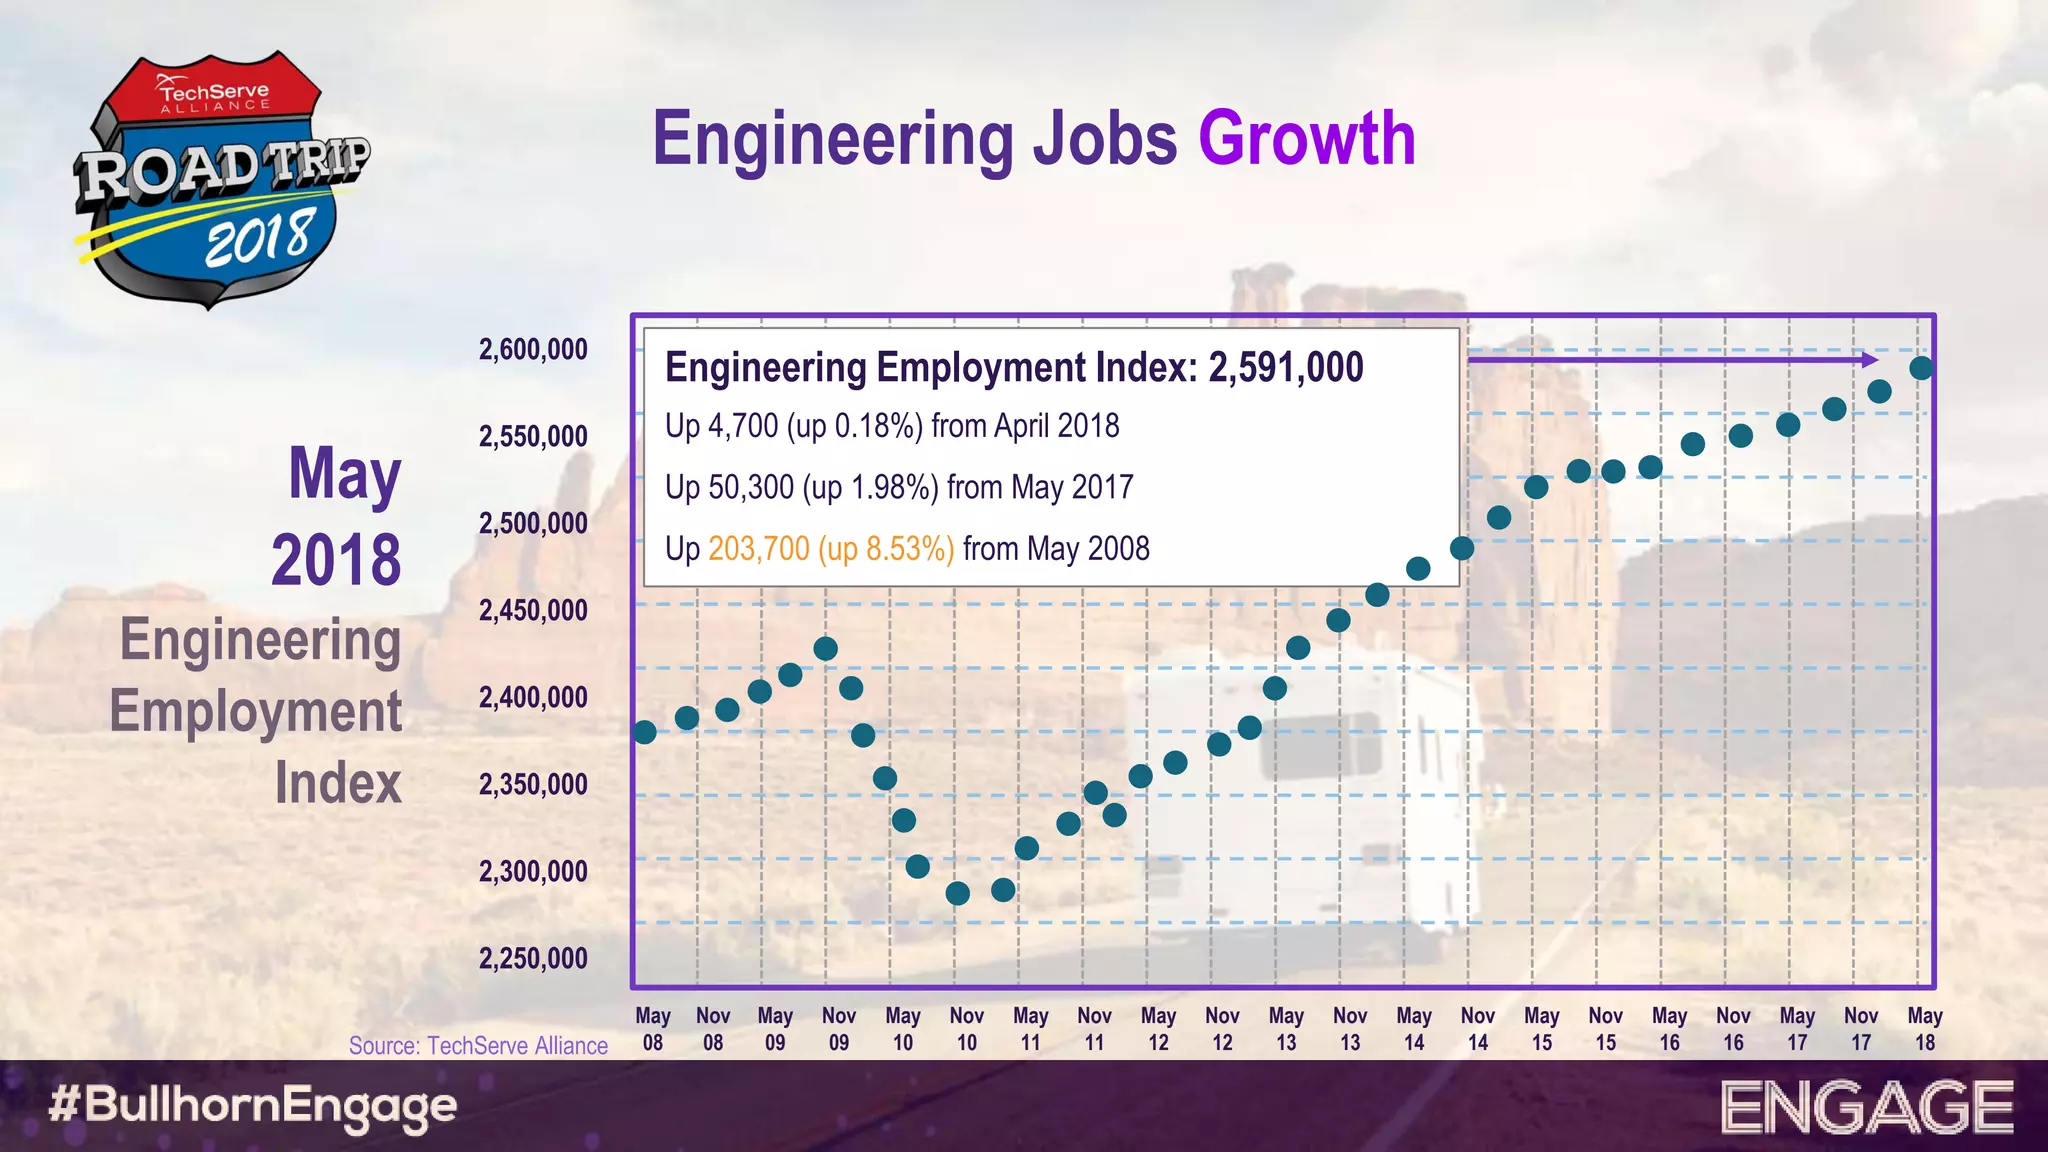
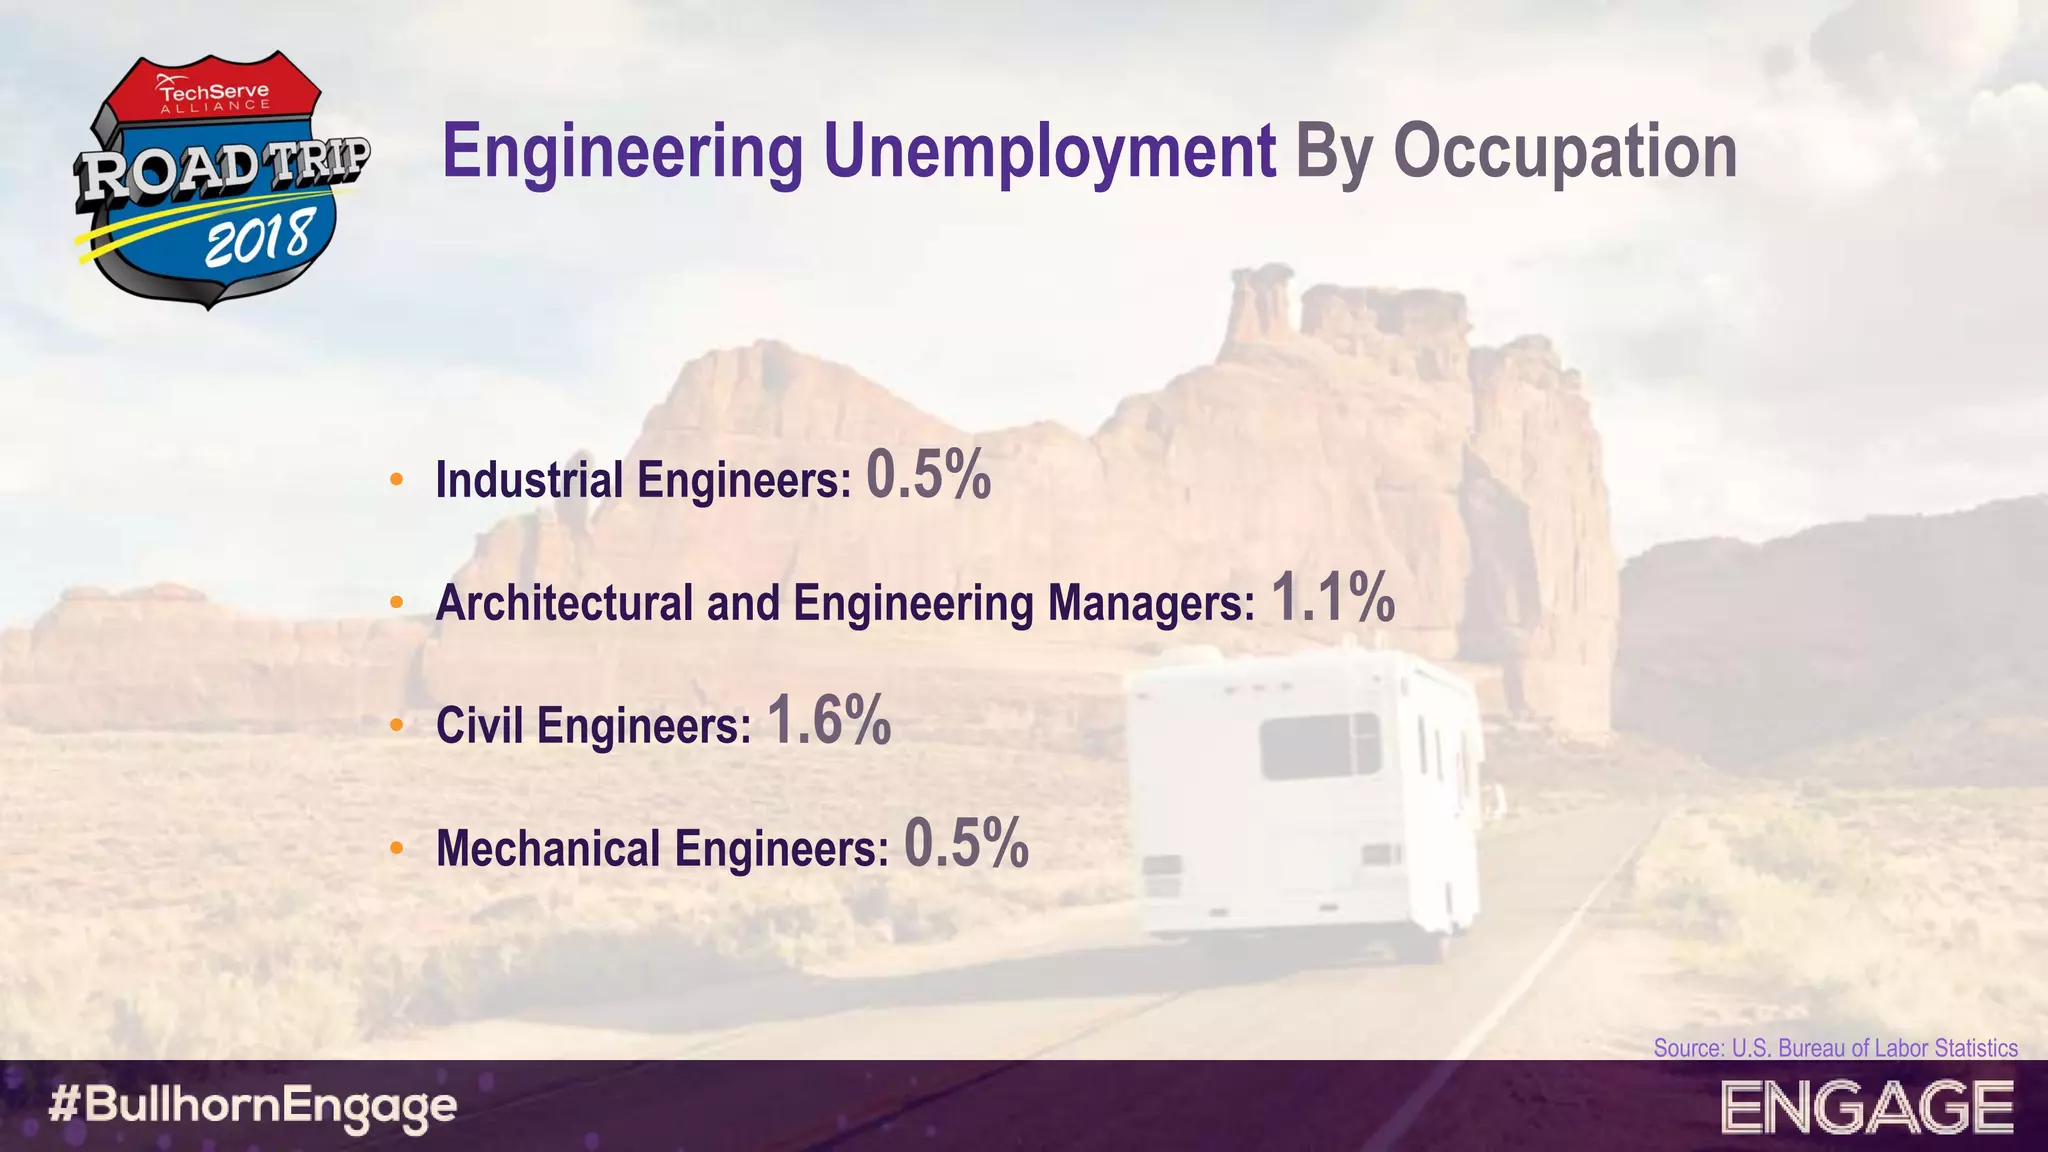
The Connected World:
Macrotrends in the Tech Sector
Mark Roberts
roberts@techservealliance.org
@MarkRoberts_TS
Get Ready To Poll!
If you have not already, SYNC YOUR DEVICE of
choice with PollEverywhere before we begin:
Mobile Phone: Text Voting Laptop, Tablet, or Phone:
Web Voting
Text “TechServe” to “22333” to
sync with the presentation.
Go to the “pollev.com/techserve”
on your laptop, tablet or phone.
To participate, type in your response to
the poll (i.e., enter “a” or “b) or type in
your response to open-ended
questions as if you are sending a text.
The polls will appear on your screen.
You simply select your response or type
in your answer.
Using Benchmarking Data to Map out 2018… and Beyond.
The
ROAD
Ahead
What’s your favorite
ROAD TRIP song?
On the Road Again, Willie NelsonA:
B: Don’t Stop Believin’, Journey
C: Born to be Wild, Steppenwolf
D: Road to Nowhere, Talking Heads
E: Hit the Road, Ray Charles
A Text Slide (No Bullets)
This is text that isn’t bulleted.
U.S. GDP: 3-month Moving Average
Quarterly
Trend:
$17.3
Trillion
20
18
16
14
12
‘07 ‘08 ‘09 ‘10 ‘11 ‘12 ‘13 ‘14 ‘15 ’16 ‘17 ‘18 ‘19
U.S. GDP: Quarter-over-Quarter Growth Rate
2018:
2.5%
9
6
3
0
-3
-6
-9
‘07 ‘08 ‘09 ‘10 ‘11 ‘12 ‘13 ‘14 ‘15 ‘16 ‘17 ‘18 ‘19 ‘20 ‘21
I I
I
I
I
I I
I
Mixed Signals
• US Stock Market Correction?
• Global Uncertainty
• Domestic Political Turmoil
• Rising Wages, Robust Consumer Spending
• Favorable Interest Rates, Banks Ramping up Lending
• Consistent Growth in Single Family Residential Market
• Upside Pressure on Commodities, Downside Pressure on USD
Copy and paste this
gradient onto your own
photos
JOB
Prospects
U.S. Unemployment
May
2011-2018
2011 2012 2013 2014 201
5
2016
10%
9%
8%
7%
6%
5%
4%
3%
2%
2017 2018
9.0%
8.2%
7.5%
6.3%
5.5%
4.7%
4.4%
3.8%
Source: U.S. Bureau of Labor Statistics
IT 2.1%
IT Talent Shortage
VS.
U.S. OVERALL 3.9%
Source: U.S. Bureau of Labor Statistics
IT Jobs Growth
May
08
Nov
08
May
09
Nov
09
May
10
Nov
10
May
11
Nov
11
May
12
Nov
12
May
13
Nov
13
May
14
Nov
14
May
15
Nov
15
May
16
Nov
16
May
17
Nov
17
May
18
5,400,000
5,200,000
5,000,000
4,800,000
4,600,000
4,400,000
4,200,000
4,000,000
3,800,000
3,600,000
3,400,000
May
2018
IT
Employment
Index
IT Employment Index: 5,337,000
Up 1,600 (up 0.03%) from April 2018
Up 44,900 (up 0.85%) from May 2017
Up 1,329,700 (up 33.18%) from May 2008
Source: TechServe Alliance
IT Unemployment By Occupation
• Computer Programmers: 2.2%
• Computer & Information System Managers : 0.9%
• Computer Systems Analysts: 1.0%
• Software Developers: 2.1%
Source: U.S. Bureau of Labor Statistics
Engineering Jobs Growth
May
08
Nov
08
May
09
Nov
09
May
10
Nov
10
May
11
Nov
11
May
12
Nov
12
May
13
Nov
13
May
14
Nov
14
May
15
Nov
15
May
16
Nov
16
May
17
Nov
17
May
18
2,600,000
2,550,000
2,500,000
2,450,000
2,400,000
2,350,000
2,300,000
2,250,000
May
2018
Engineering
Employment
Index
Engineering Employment Index: 2,591,000
Up 4,700 (up 0.18%) from April 2018
Up 50,300 (up 1.98%) from May 2017
Up 203,700 (up 8.53%) from May 2008
Source: TechServe Alliance
Engineering Unemployment By Occupation
• Industrial Engineers: 0.5%
• Architectural and Engineering Managers: 1.1%
• Civil Engineers: 1.6%
• Mechanical Engineers: 0.5%
Source: U.S. Bureau of Labor Statistics
Which Will Be Your Road?
5.1% 14.1%
Sources of Revenue
High
Profit
Overall
Staffing-Direct
Staffing-via 3rd Party
Perm Placements
IT Solutions
Payrolling
Contract-to-Hire Fees
0.0% 10.0% 30.0% 40.0% 50.0% 60.0% 70.0%
70.5%
72.8%
24.0%
25.1%
2.6%
2.1%
0.0%
0.0%
0.0%
0.0%
0.0%
0.0%
How would you
describe your
efforts at client
diversification?
Very SuccessfulA:
B: Somewhat Successful
C
:
Largely Unsuccessful
D
:
Unsuccessful
E: Not an Issue I Focus On
Client Concentration
25.5% Single largest client
64.6% Top 5 clients combined
BUSTED!
43.5%
ONLY
Redeployment
12%OVERALL
15%HIGH PROFIT
Business
MODEL
Spotlight
How much do you focus
on pursuing business
with direct client
relationships over
VMS/MSP business?
I only pursue direct client relationship opportunitiesA:
B:
I focus on pursuing direct client relationship
opportunities, but will also work on VMS/MSP
engagements
C: I pursue both direct client relationship and VMS/MSP
opportunities equally
D: I focus on VMS/MSP opportunities, but will also work
on direct client relationship engagements
E: I only pursue VMS/MSP opportunities
Percentage of Revenue by Business Type
$7-15 MM $15-30 MM > $30 MM$0-7.5 MM
90%
80%
70%
60%
50%
40%
30%
20%
10%
0%
Direct Client
Relationship
MSP with VMS
VMS Only
Submittal Close Rate
Direct Client Relationship
VMS/MSP – Contact
30%
10%
VMS/MSP – No Contact 4.2%
Placement Gross Margin
Direct Client Relationship
VMS/MSP – Contact
25%
19%
A Text Slide (No Bullets)
This is text that isn’t bulleted.
Road
TRIP
Companions
58%
OVERALL
48%
HIGH PROFIT
Internal Staff Efficiency Ratio
Most AEs Underperform
Under $.5 Million
Between $.5 and
$1 Million
Over $1 Million
11%
22%
67%
Gross Margin Dollars
Striking Differences
OVERALL FIRM HIGH-PROFIT FIRM
Gross Profit %
26.6% 30.4%
Profit before Taxes
3.2% 8.2%
SG&A (as a % of Revenue)
22.2%23.3%
What Lies Ahead?
Sunny
Skies
Stormy
Conditions
or
Challenging
Conditions
37%
of the U.S.
workforce
prefers an
alternate way
of working to
traditional
full-time
employment
50%
of the U.S.
workforce
is expected
to be
contingent
by 2030
82%
of millennials
are optimistic
about
freelancing
as a career
path
A Perfect Storm: The Good
THE
NEW
NORMSources: Staffing Industry Analysts; Stanford University
and Y Combinator; McKinsey Global Institute;
Jobeconomics
A Perfect Storm: The Challenging
DEMOGRAPHIC CHANGES
The U.S. birth rate is at or near the lowest it’s ever
been, at 62 births per 1,000 women.
Americans aged 65 and over will outnumber children
5 and under by 2020.
By 2020, there will be 38 to 40 million fewer workers
with college or post-graduate degrees than needed.
Sources: McKinsey Global Institute; Centers for Disease Control and Prevention; U.S. Bureau of Labor Statistics
A Perfect Storm: The Ugly
Goldman Sachs projects that more than 900K H-1Bs are working in
the U.S., representing 12%-13% of tech-related jobs. The percentage
is much higher for staffing firms.
H-1BS HEAVILY UTILIZED
OPR found that 21% of a typical firm’s billable FTEs are H-1Bs.
A Perfect Storm: The Ugly
• More Investigations
• More Revocations
• More Restrictions and Higher Fees
• Greater Uncertainty
• More Disruption to Clients,
Consultants & Staffing Firms
H-1B PROGRAM IMPACT
= LIMITED
TALENT SUPPLY
Your Wingman
on the JOURNEY
What
ROAD
will you take?
2
5
3
Test Your Knowledge! Name the Movie
1
4
Good Luck!
Thank You
Q&Atechservealliance.org

The Connected World: Macrotrends in the Tech Sector - Mark Roberts

Editor's Notes

  • #7 What’s your favorite road trip song? https://www.polleverywhere.com/multiple_choice_polls/deCG62aVcckI3fm
  • #10 3 Y 4 G
  • #14 Planes Trains Wrong Way
  • #15 See attached Excel file
  • #20 Tommy Boy New Map
  • #23 How would you describe your efforts at client diversification? https://www.polleverywhere.com/multiple_choice_polls/AFKH6jb4f326BTF
  • #29 How much do you focus on pursuing business with direct client relationships over VMS/MSP business? https://www.polleverywhere.com/multiple_choice_polls/PH2Ah4IyYNleTeK
  • #30 Pillows
  • #32 European Vacation
  • #36 Moving Right Along
  • #47 Back to Future