Download as PDF, PPTX
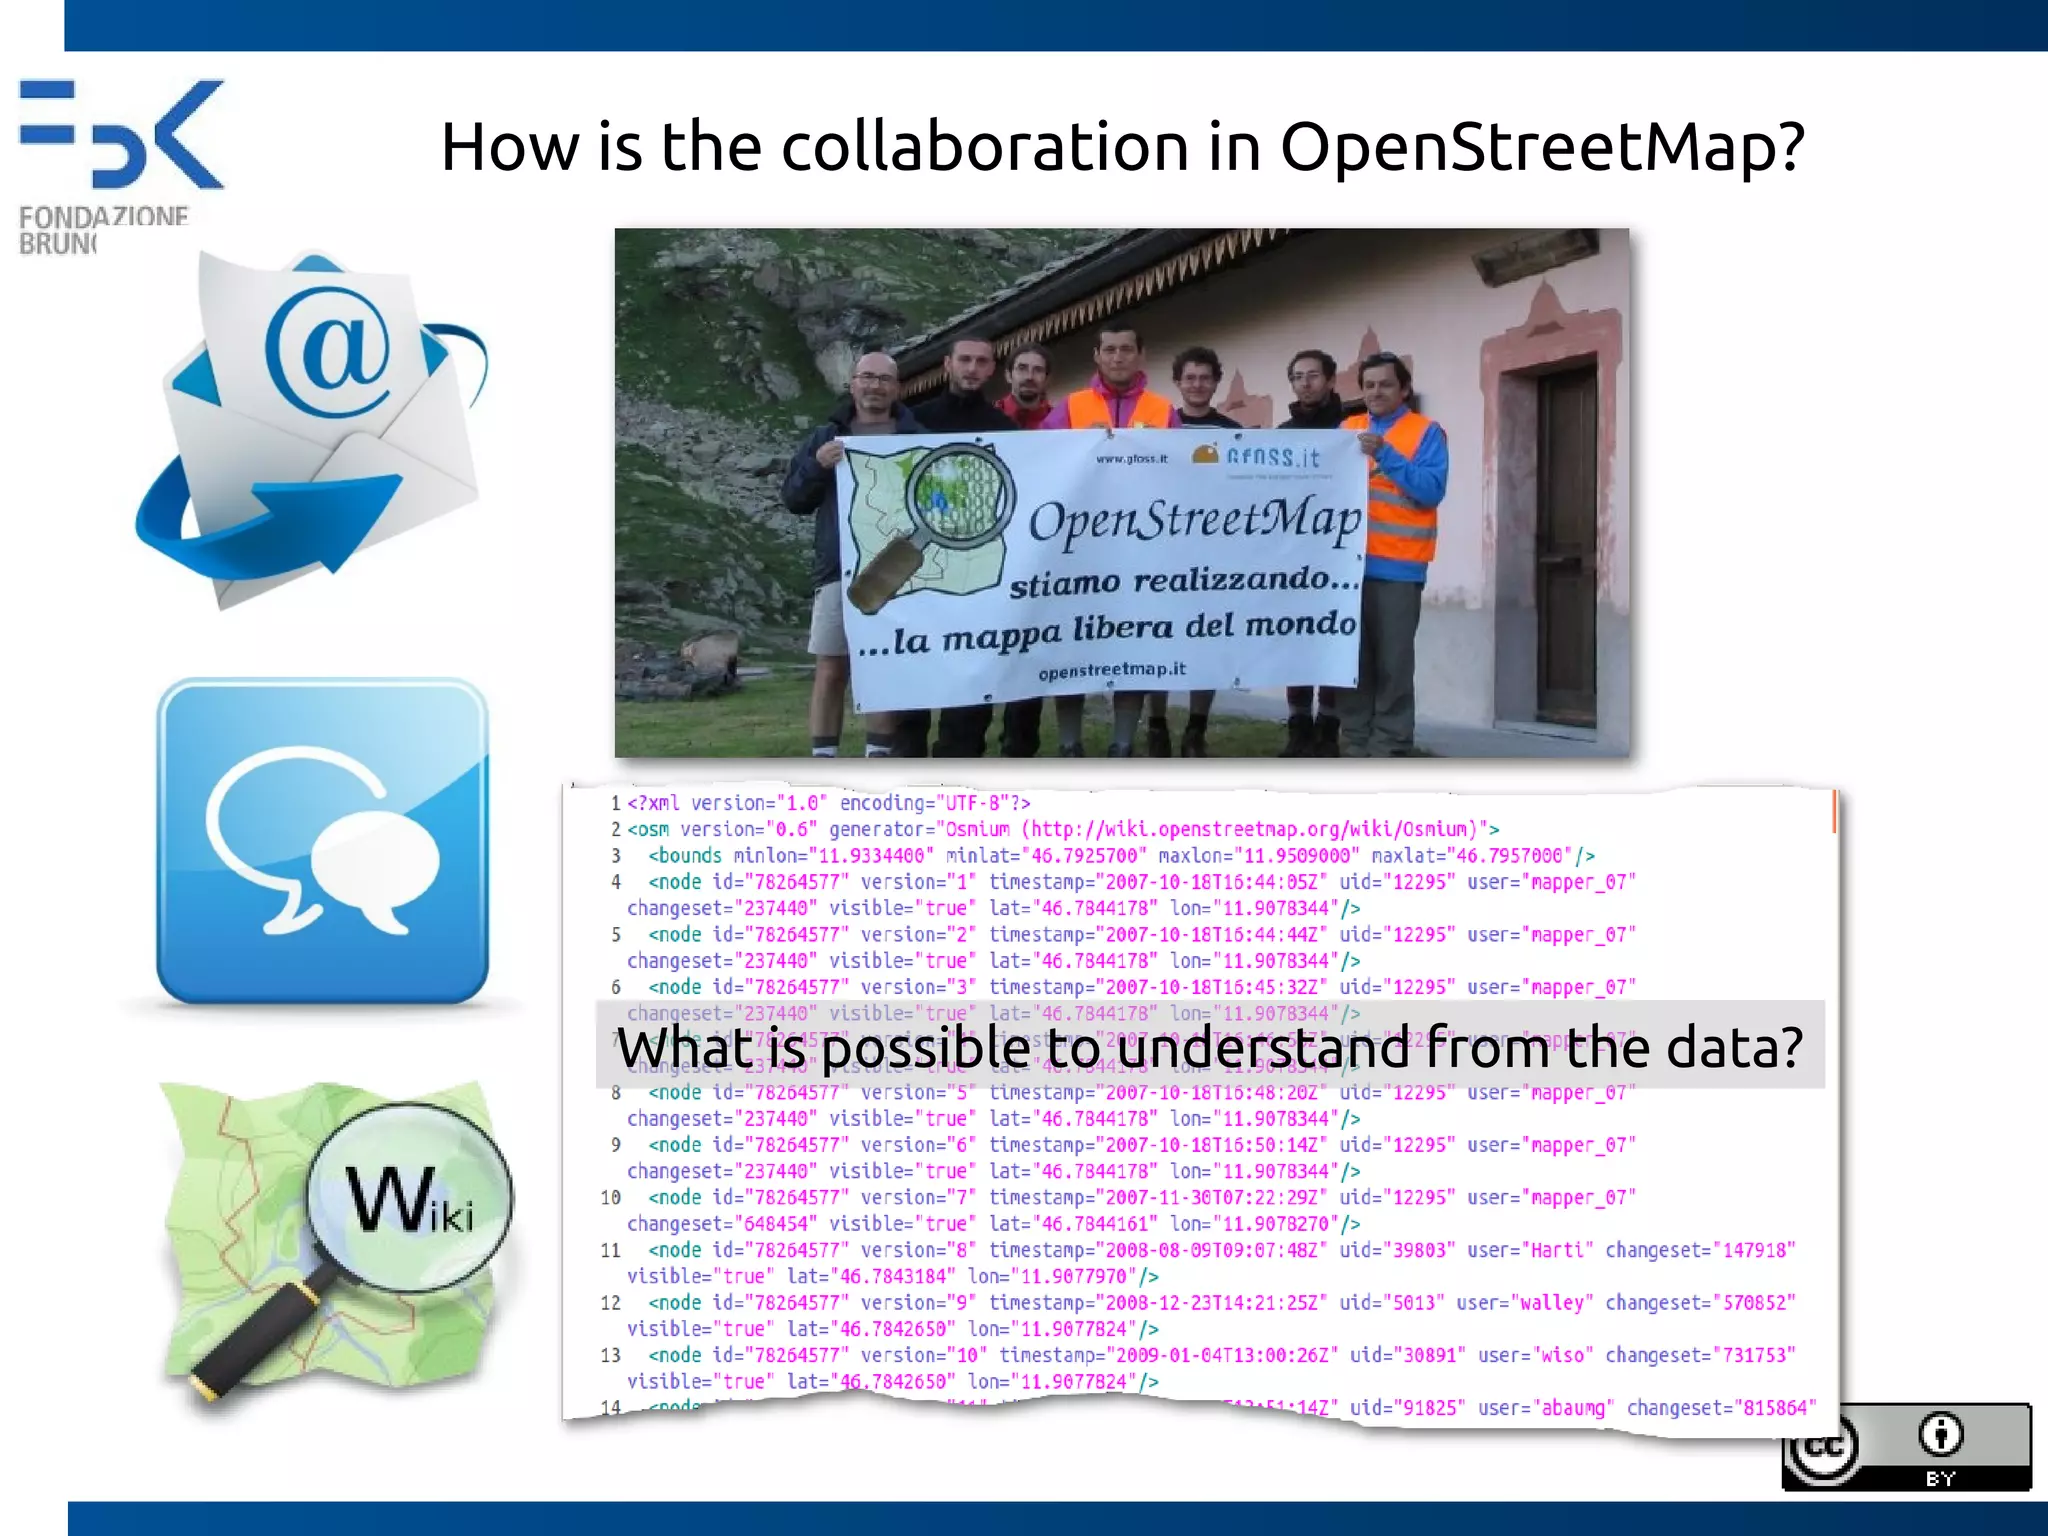

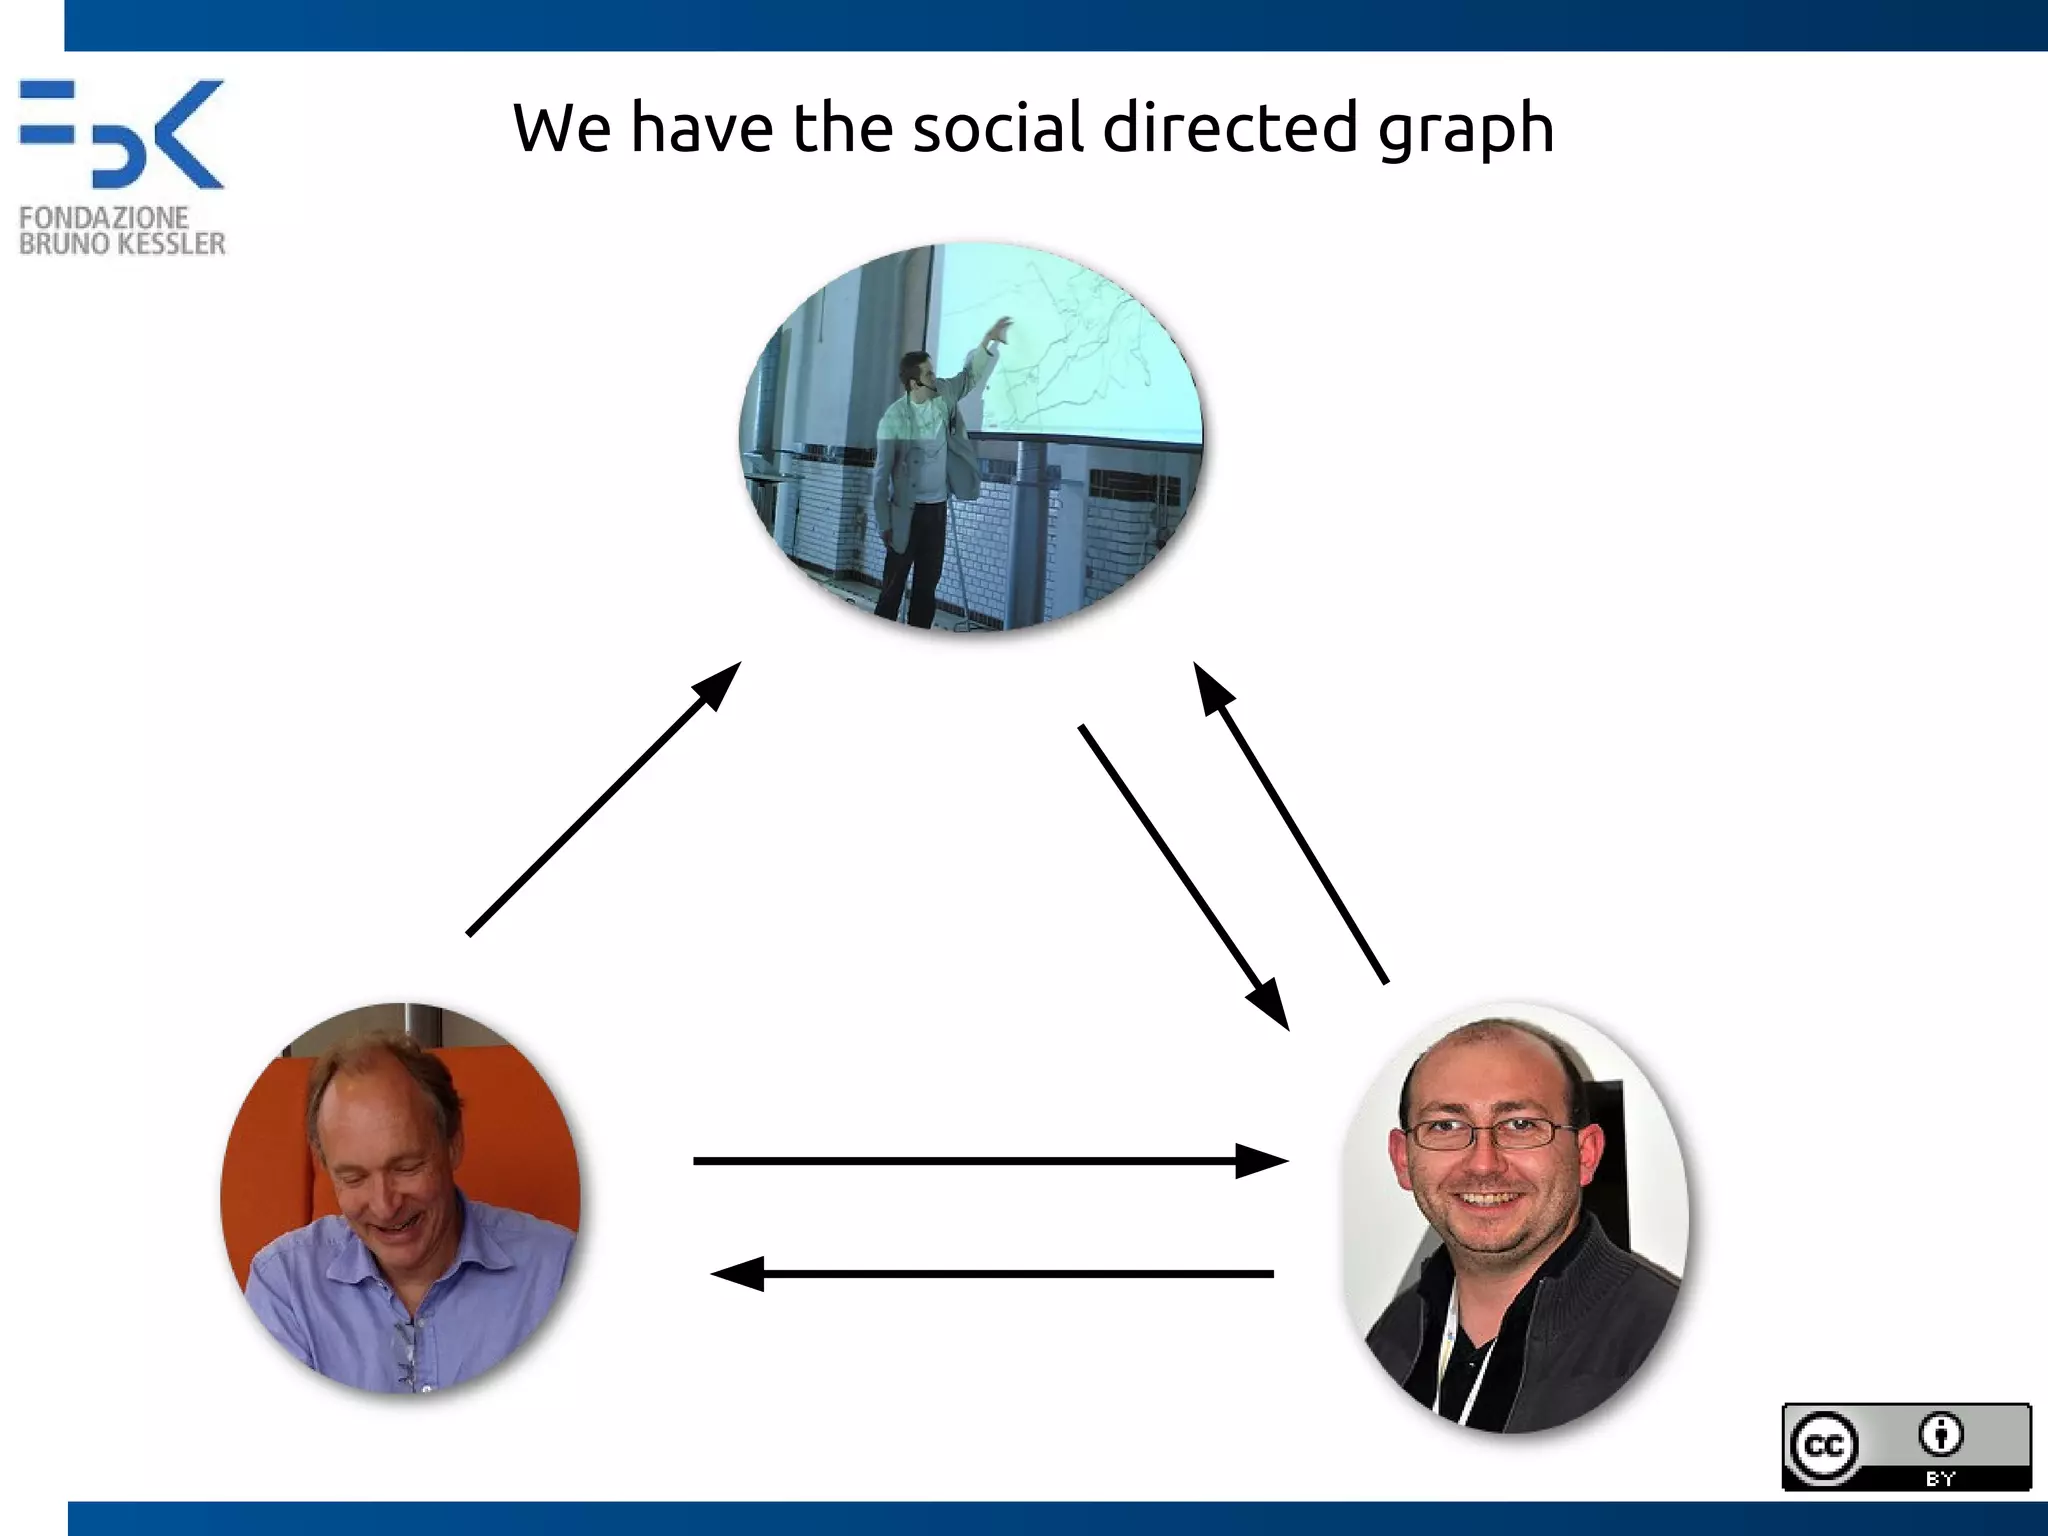
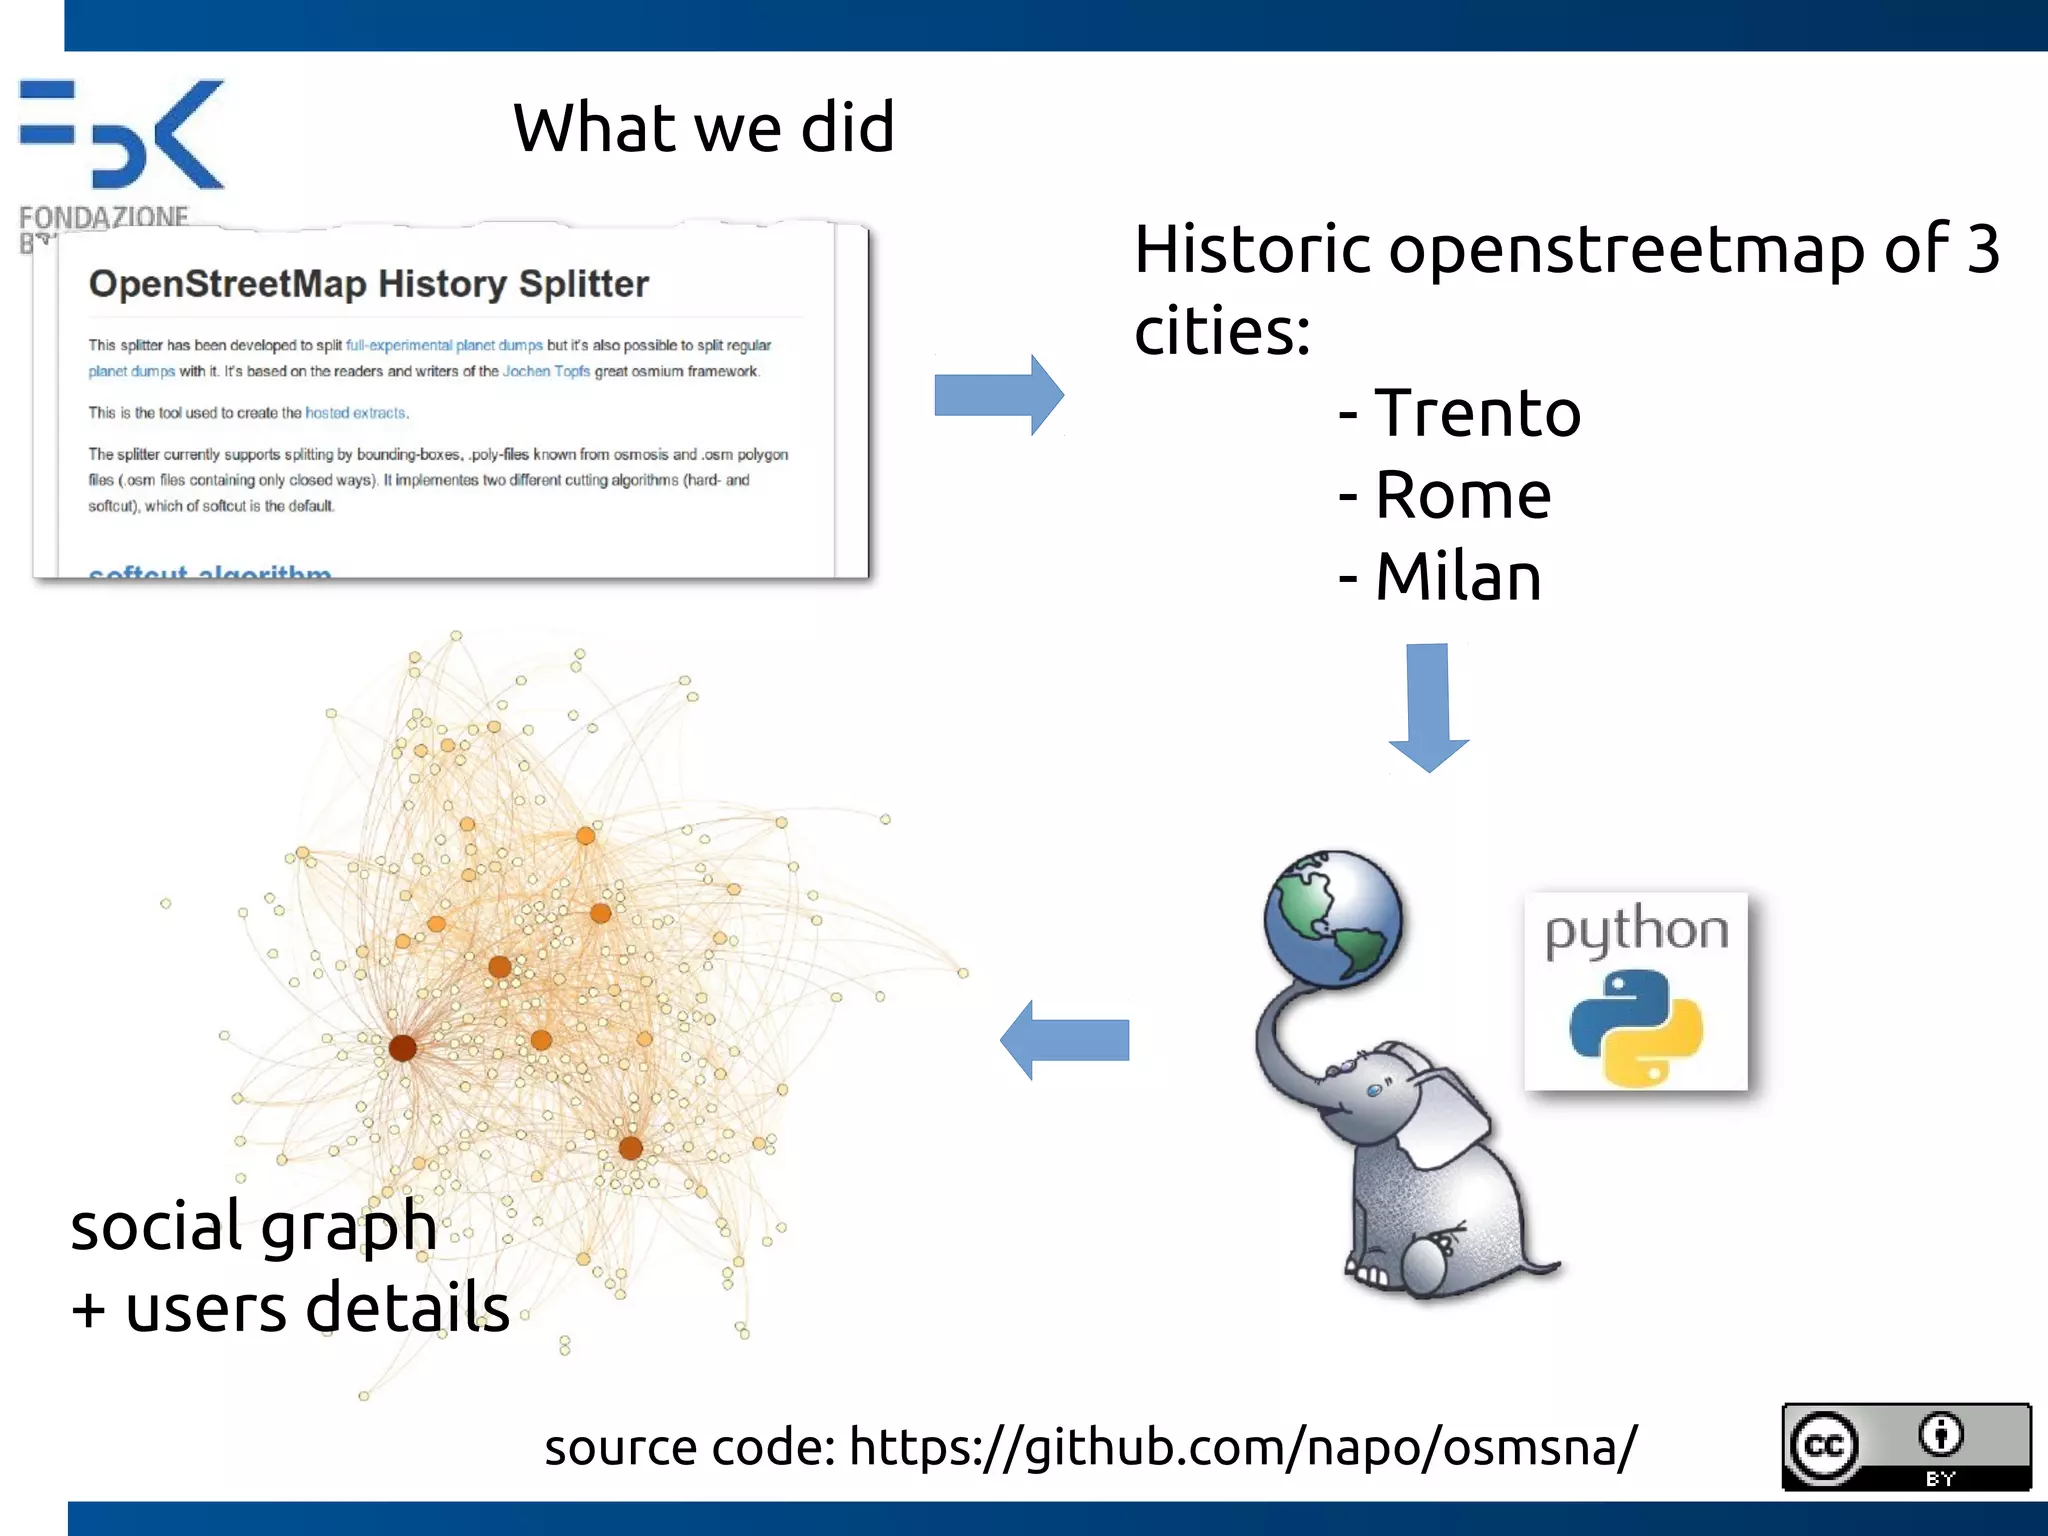

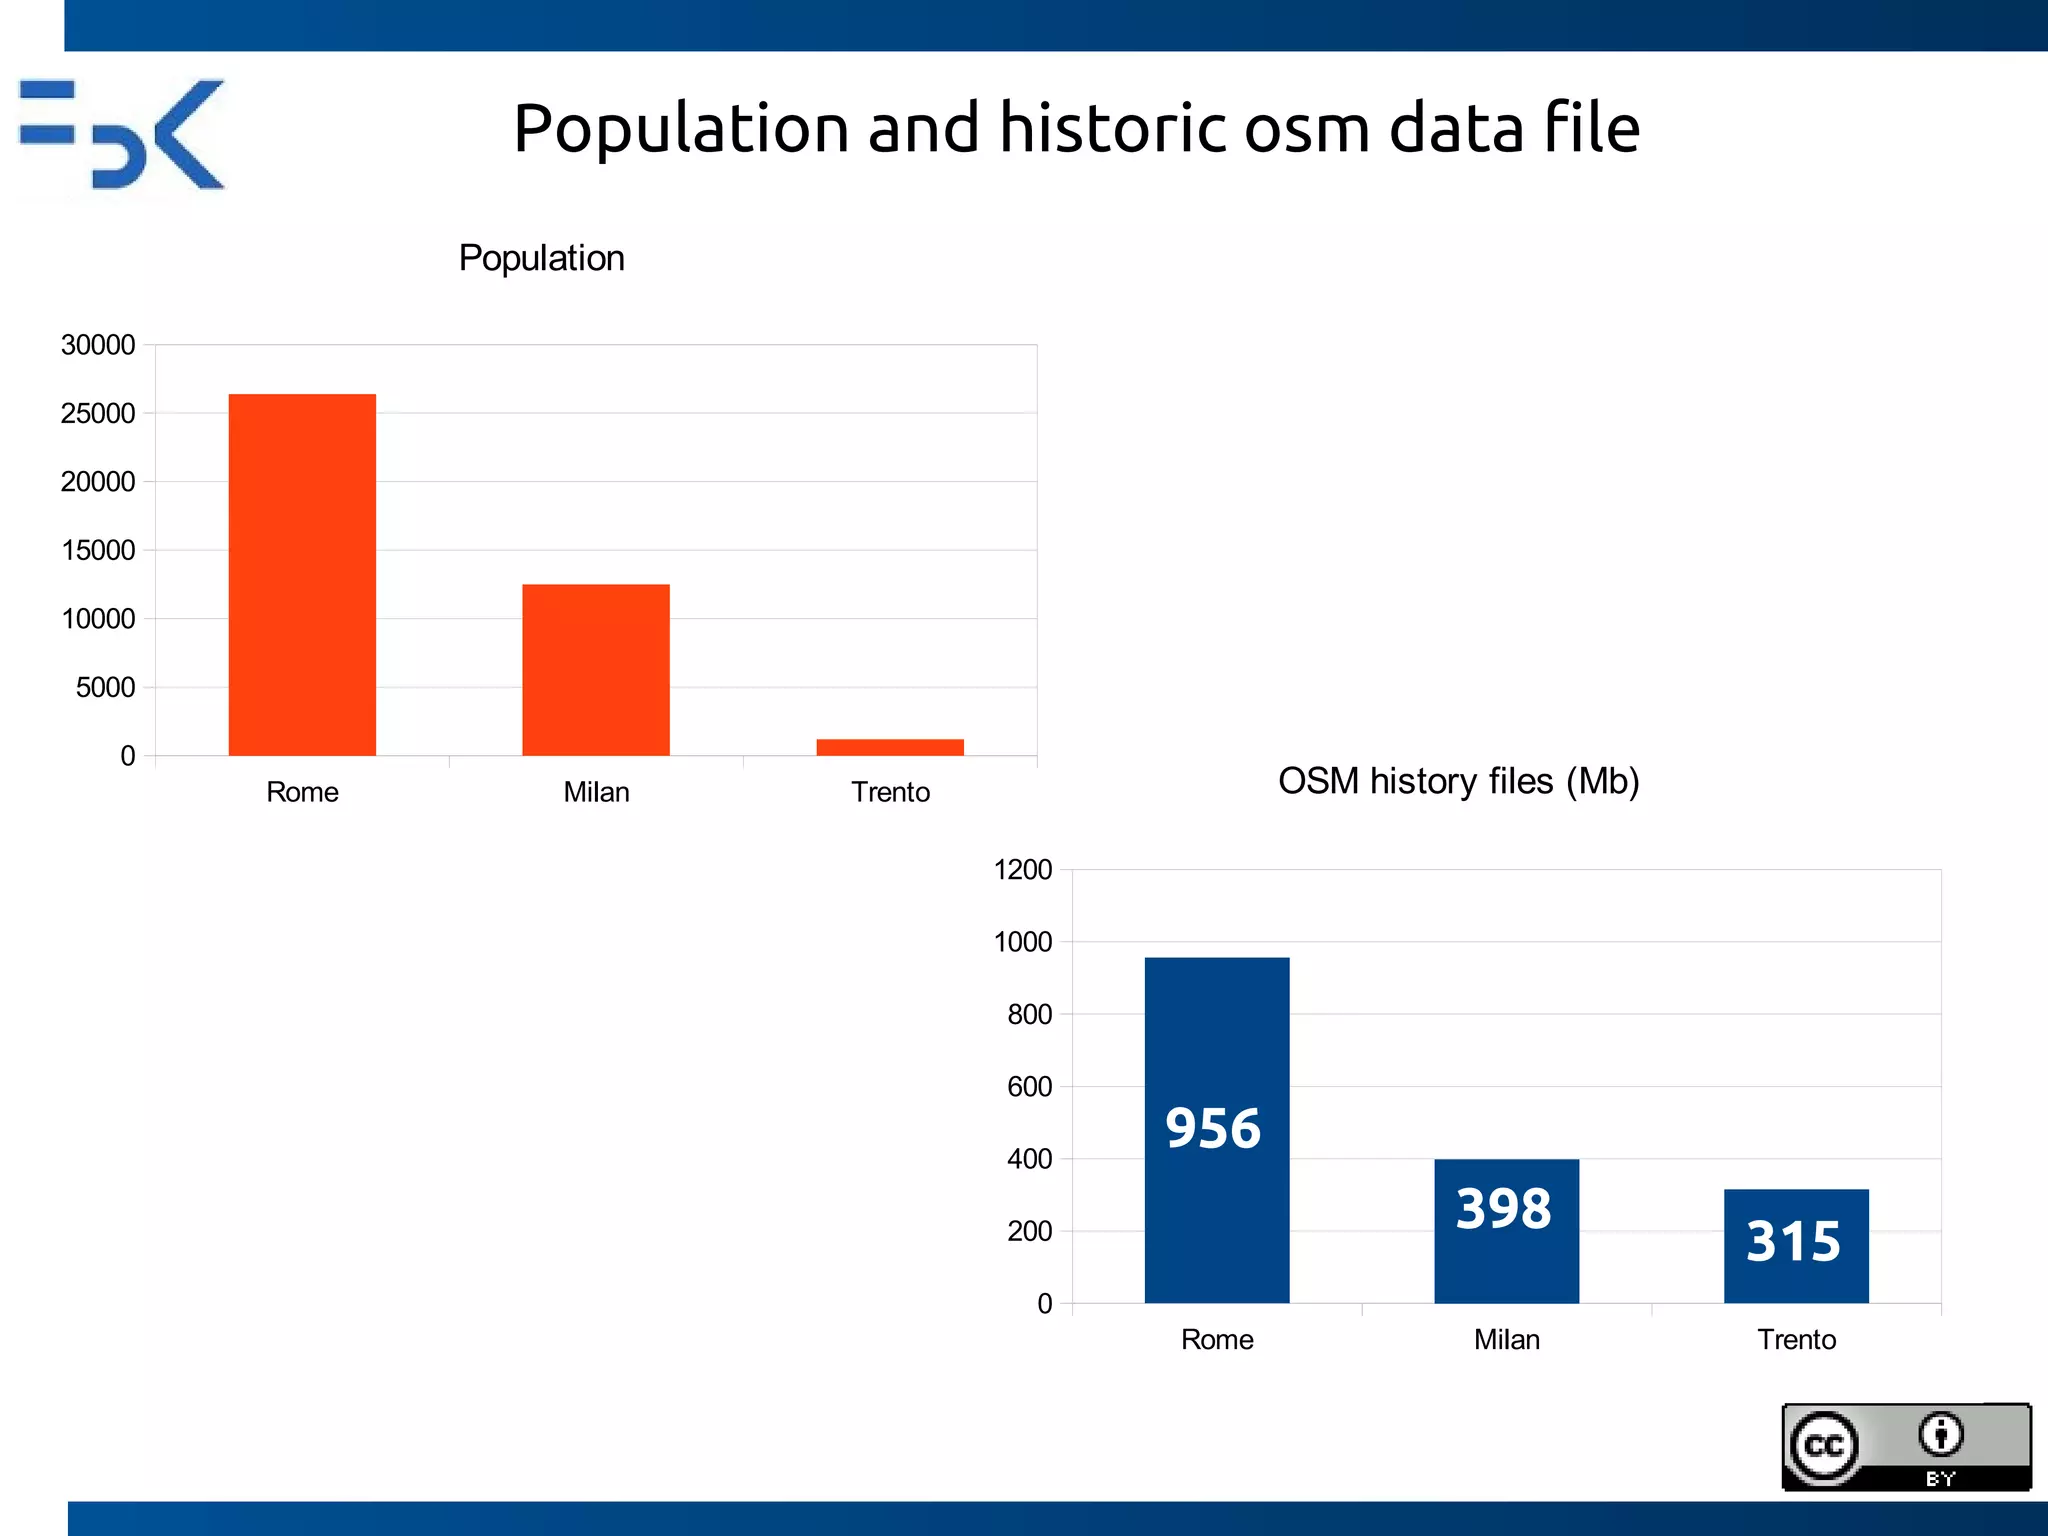
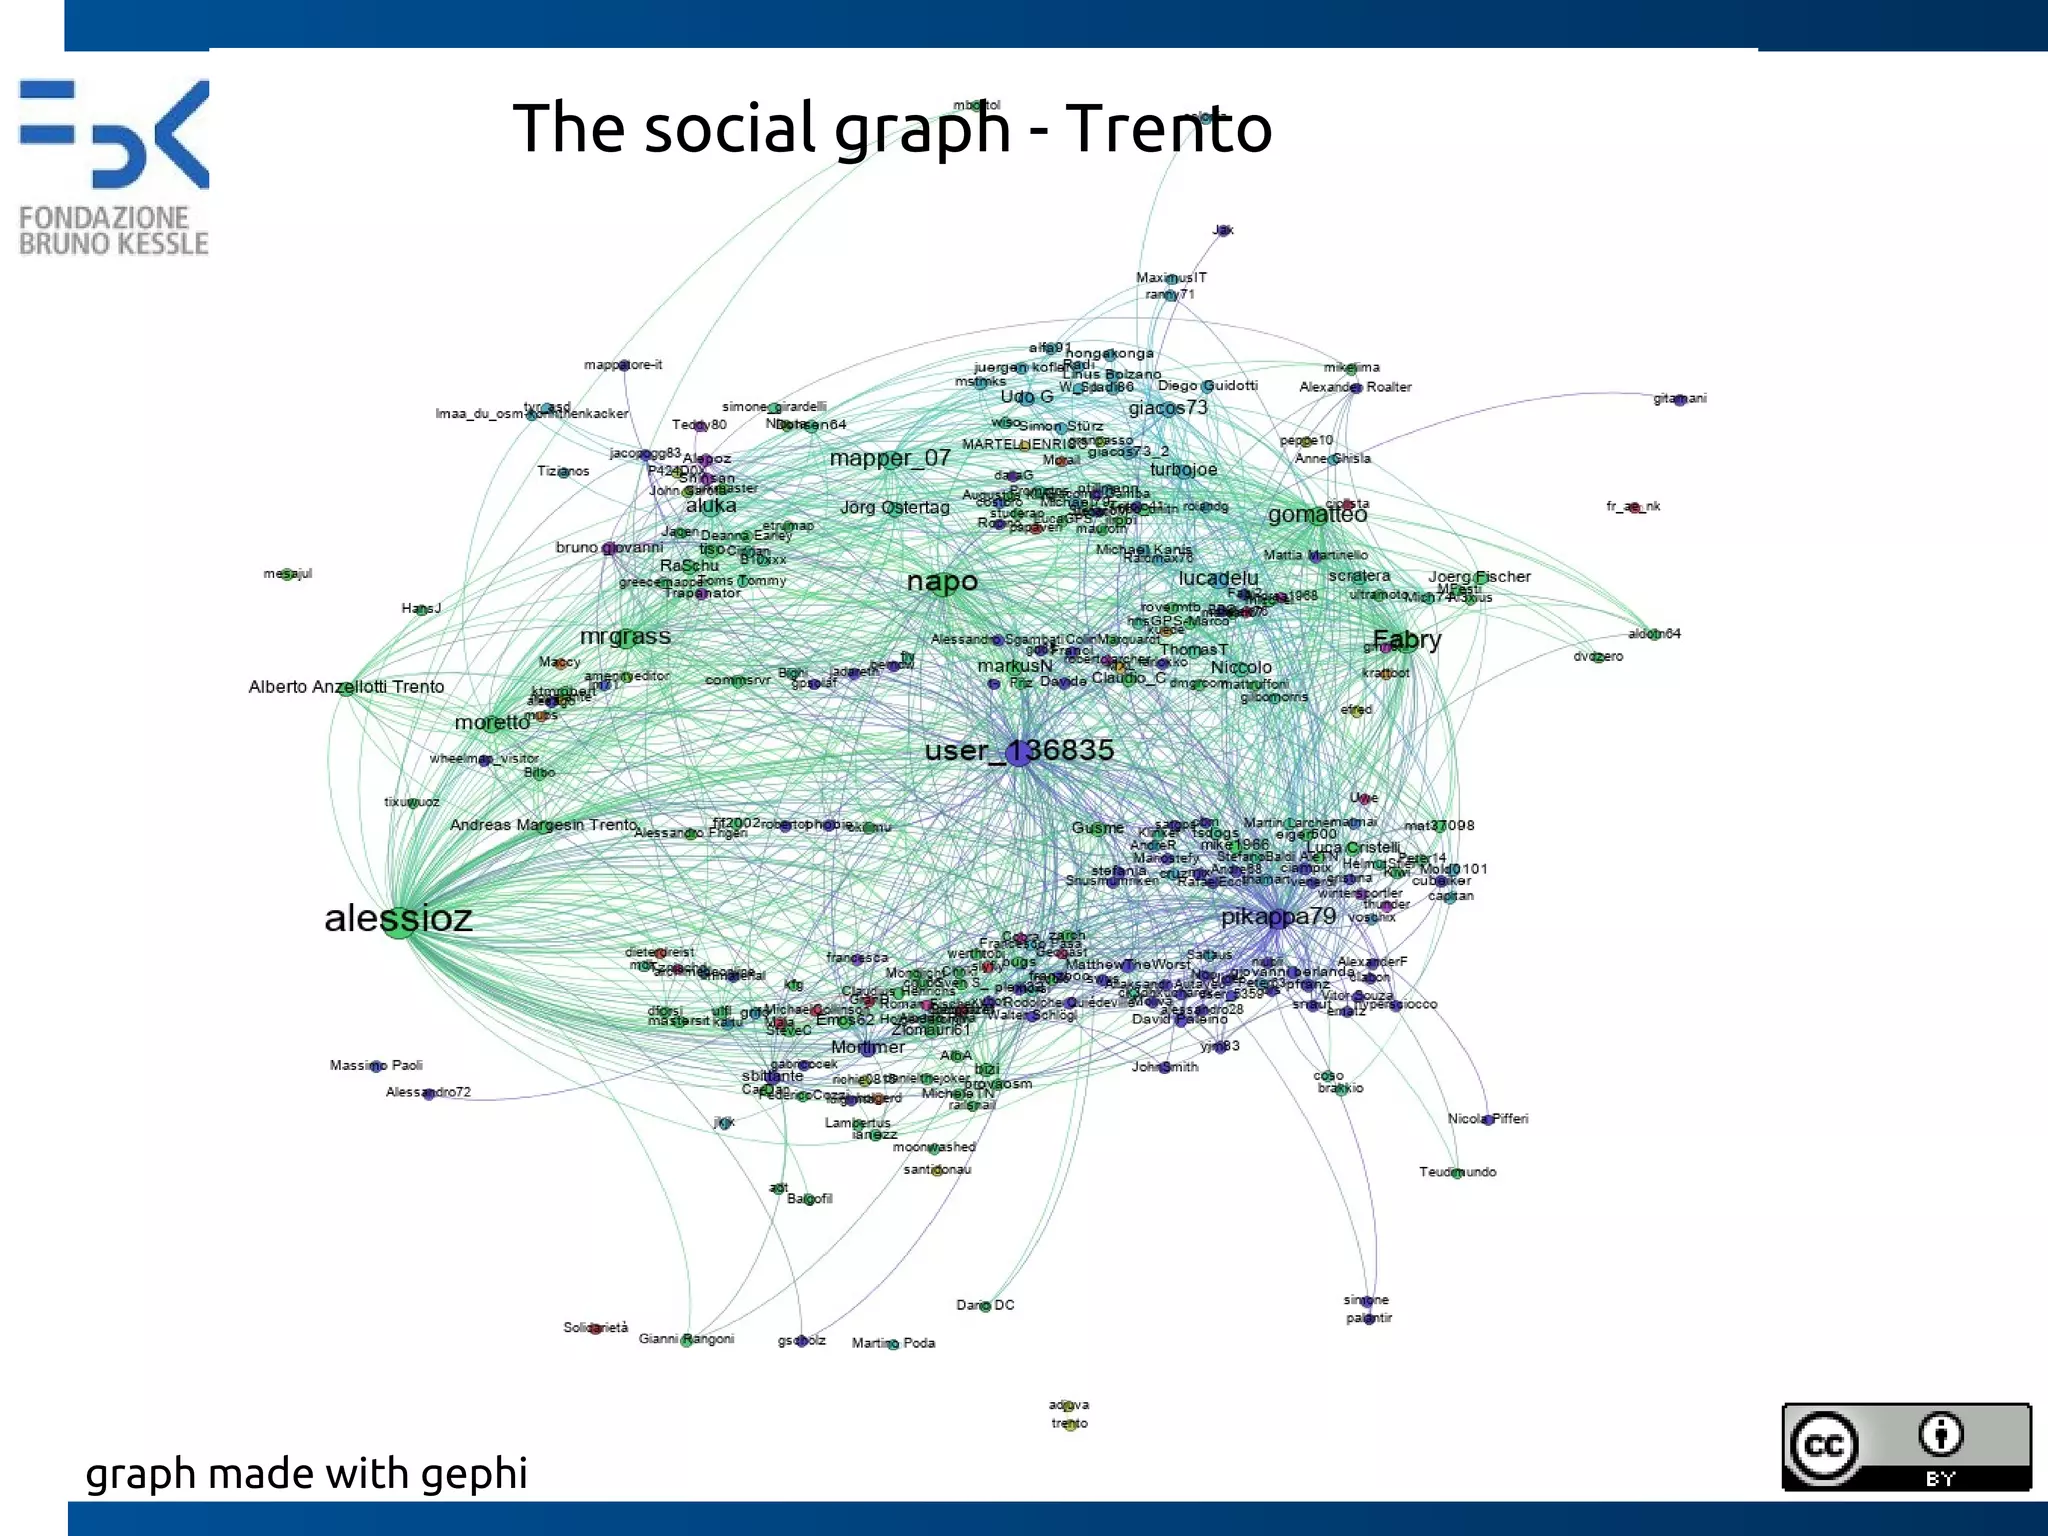
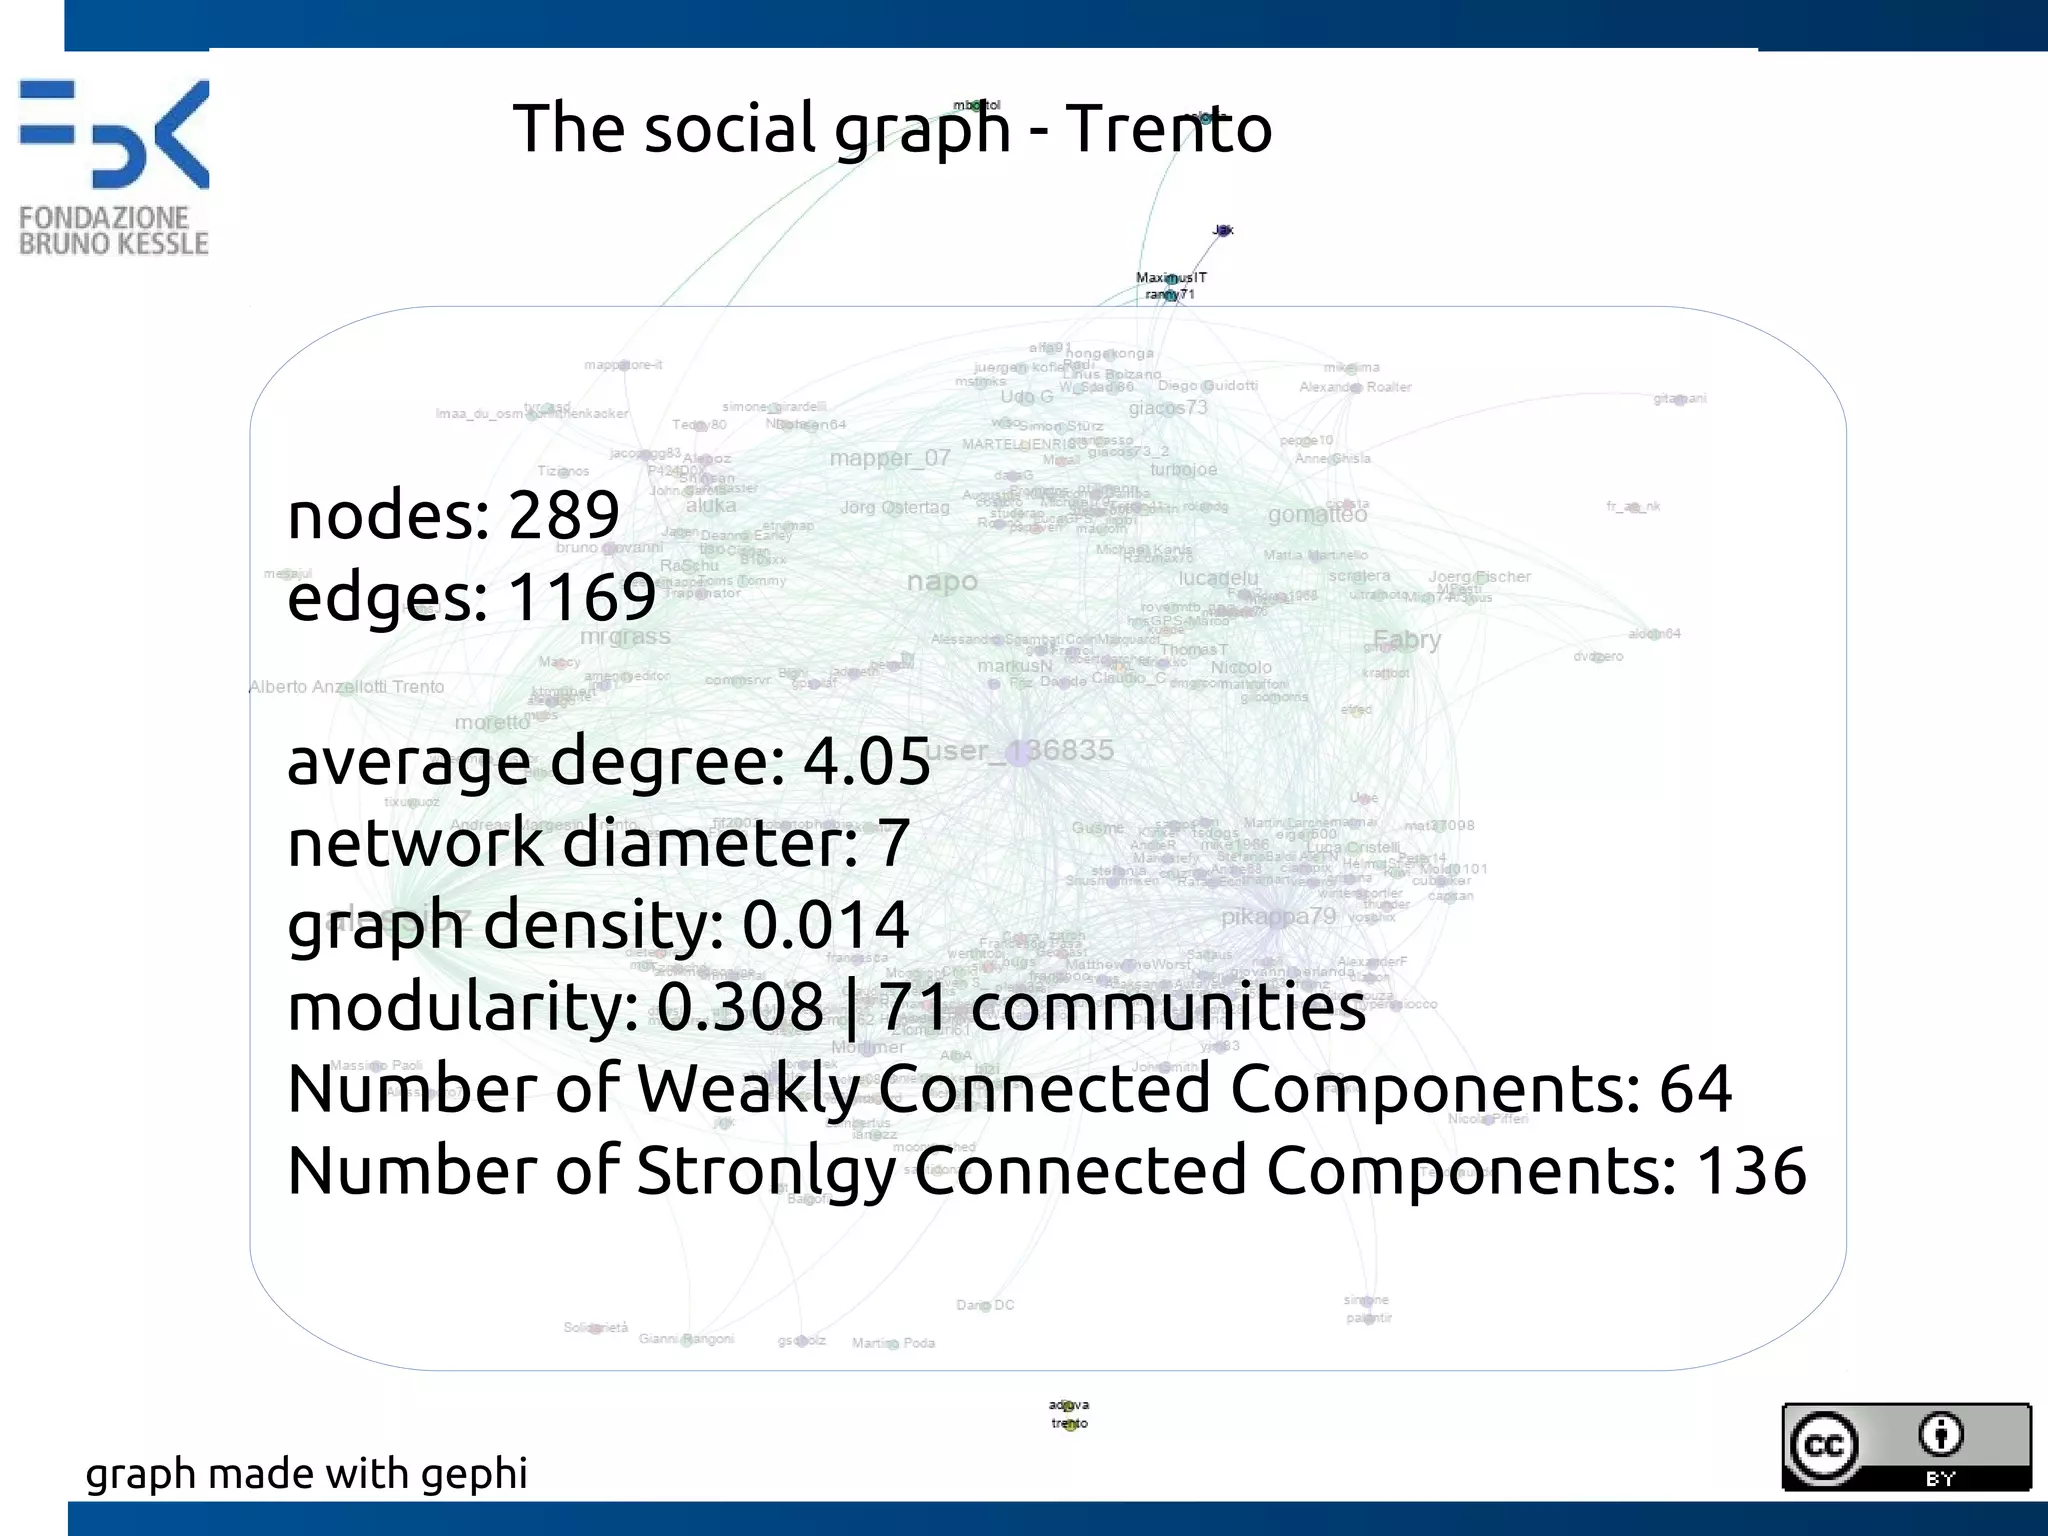
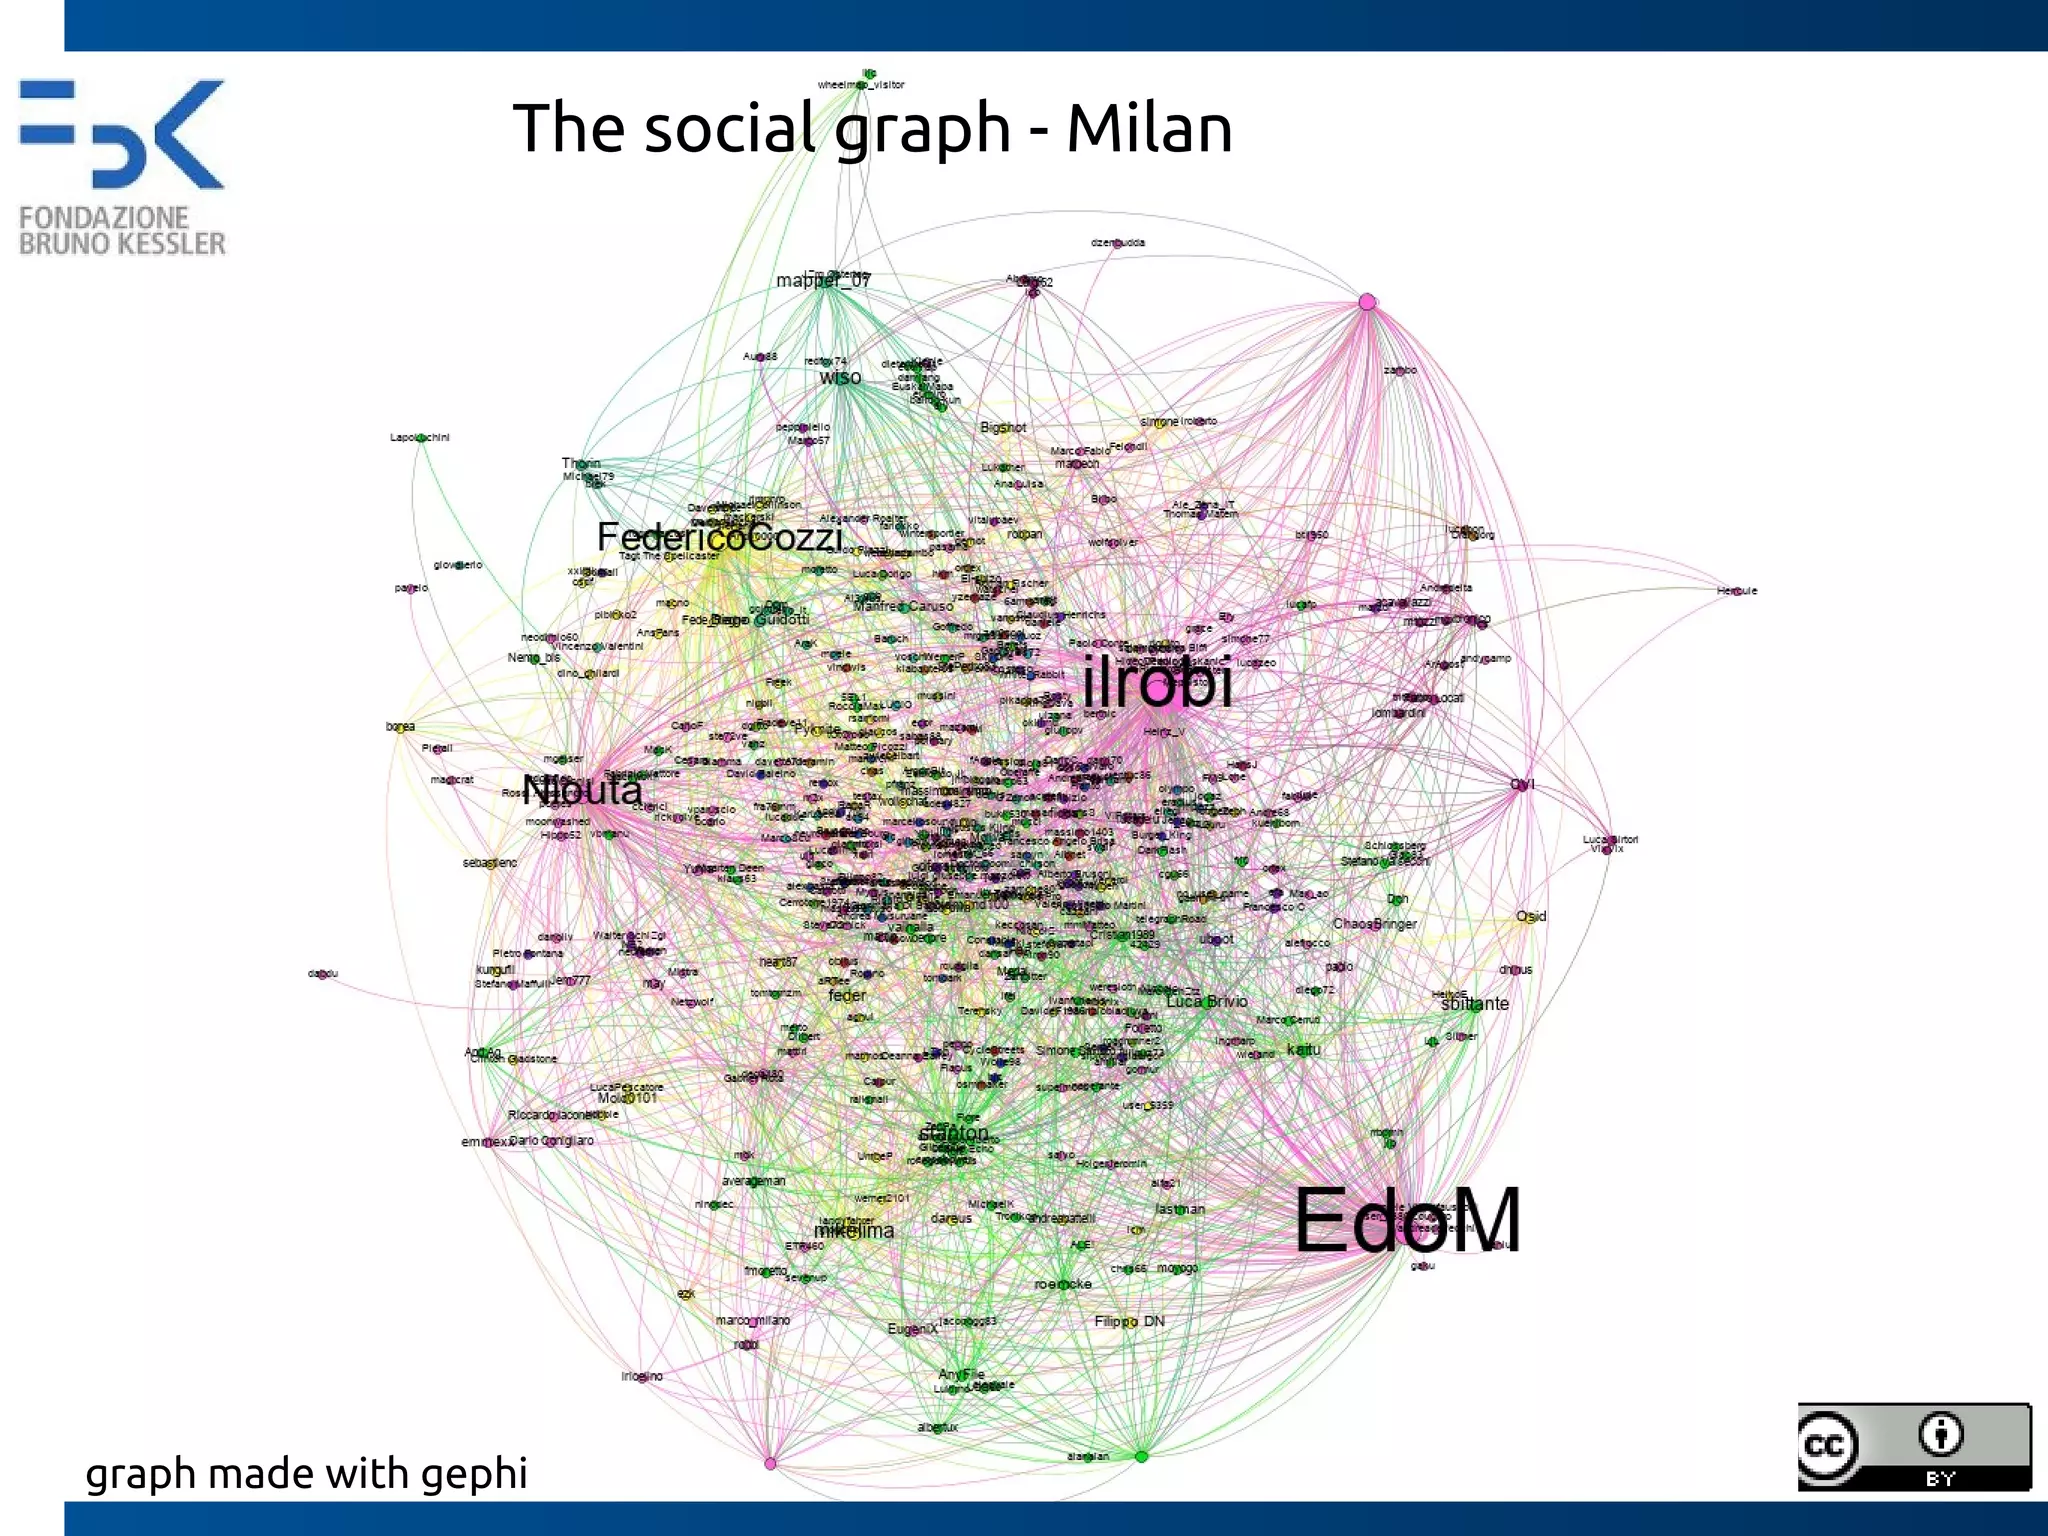
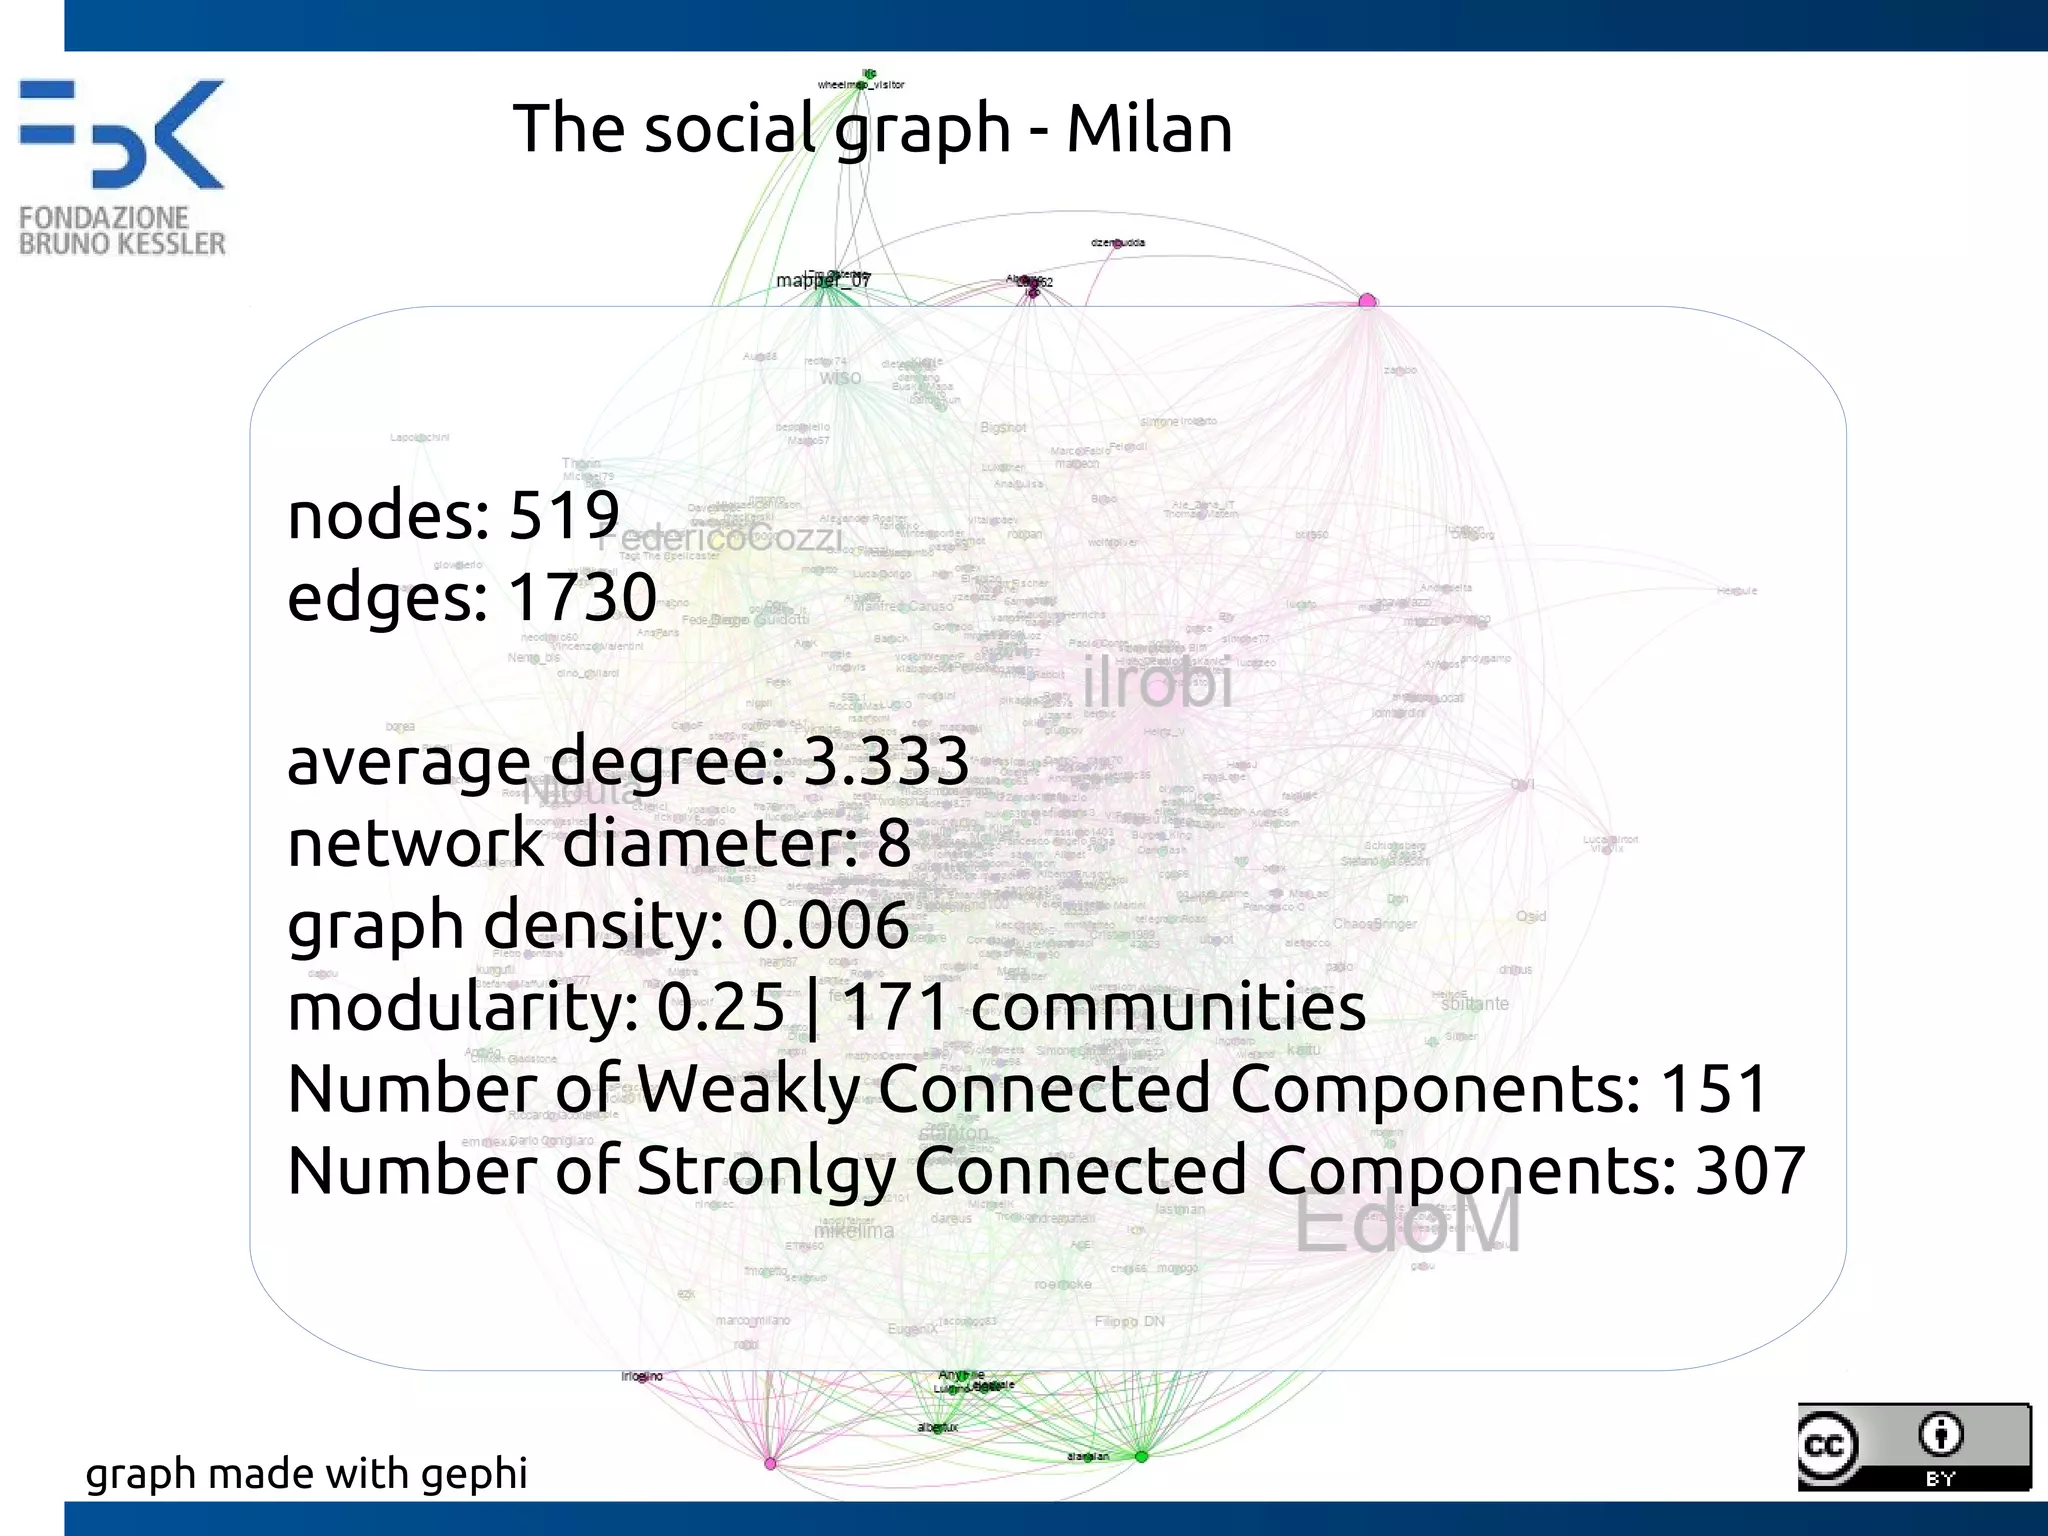
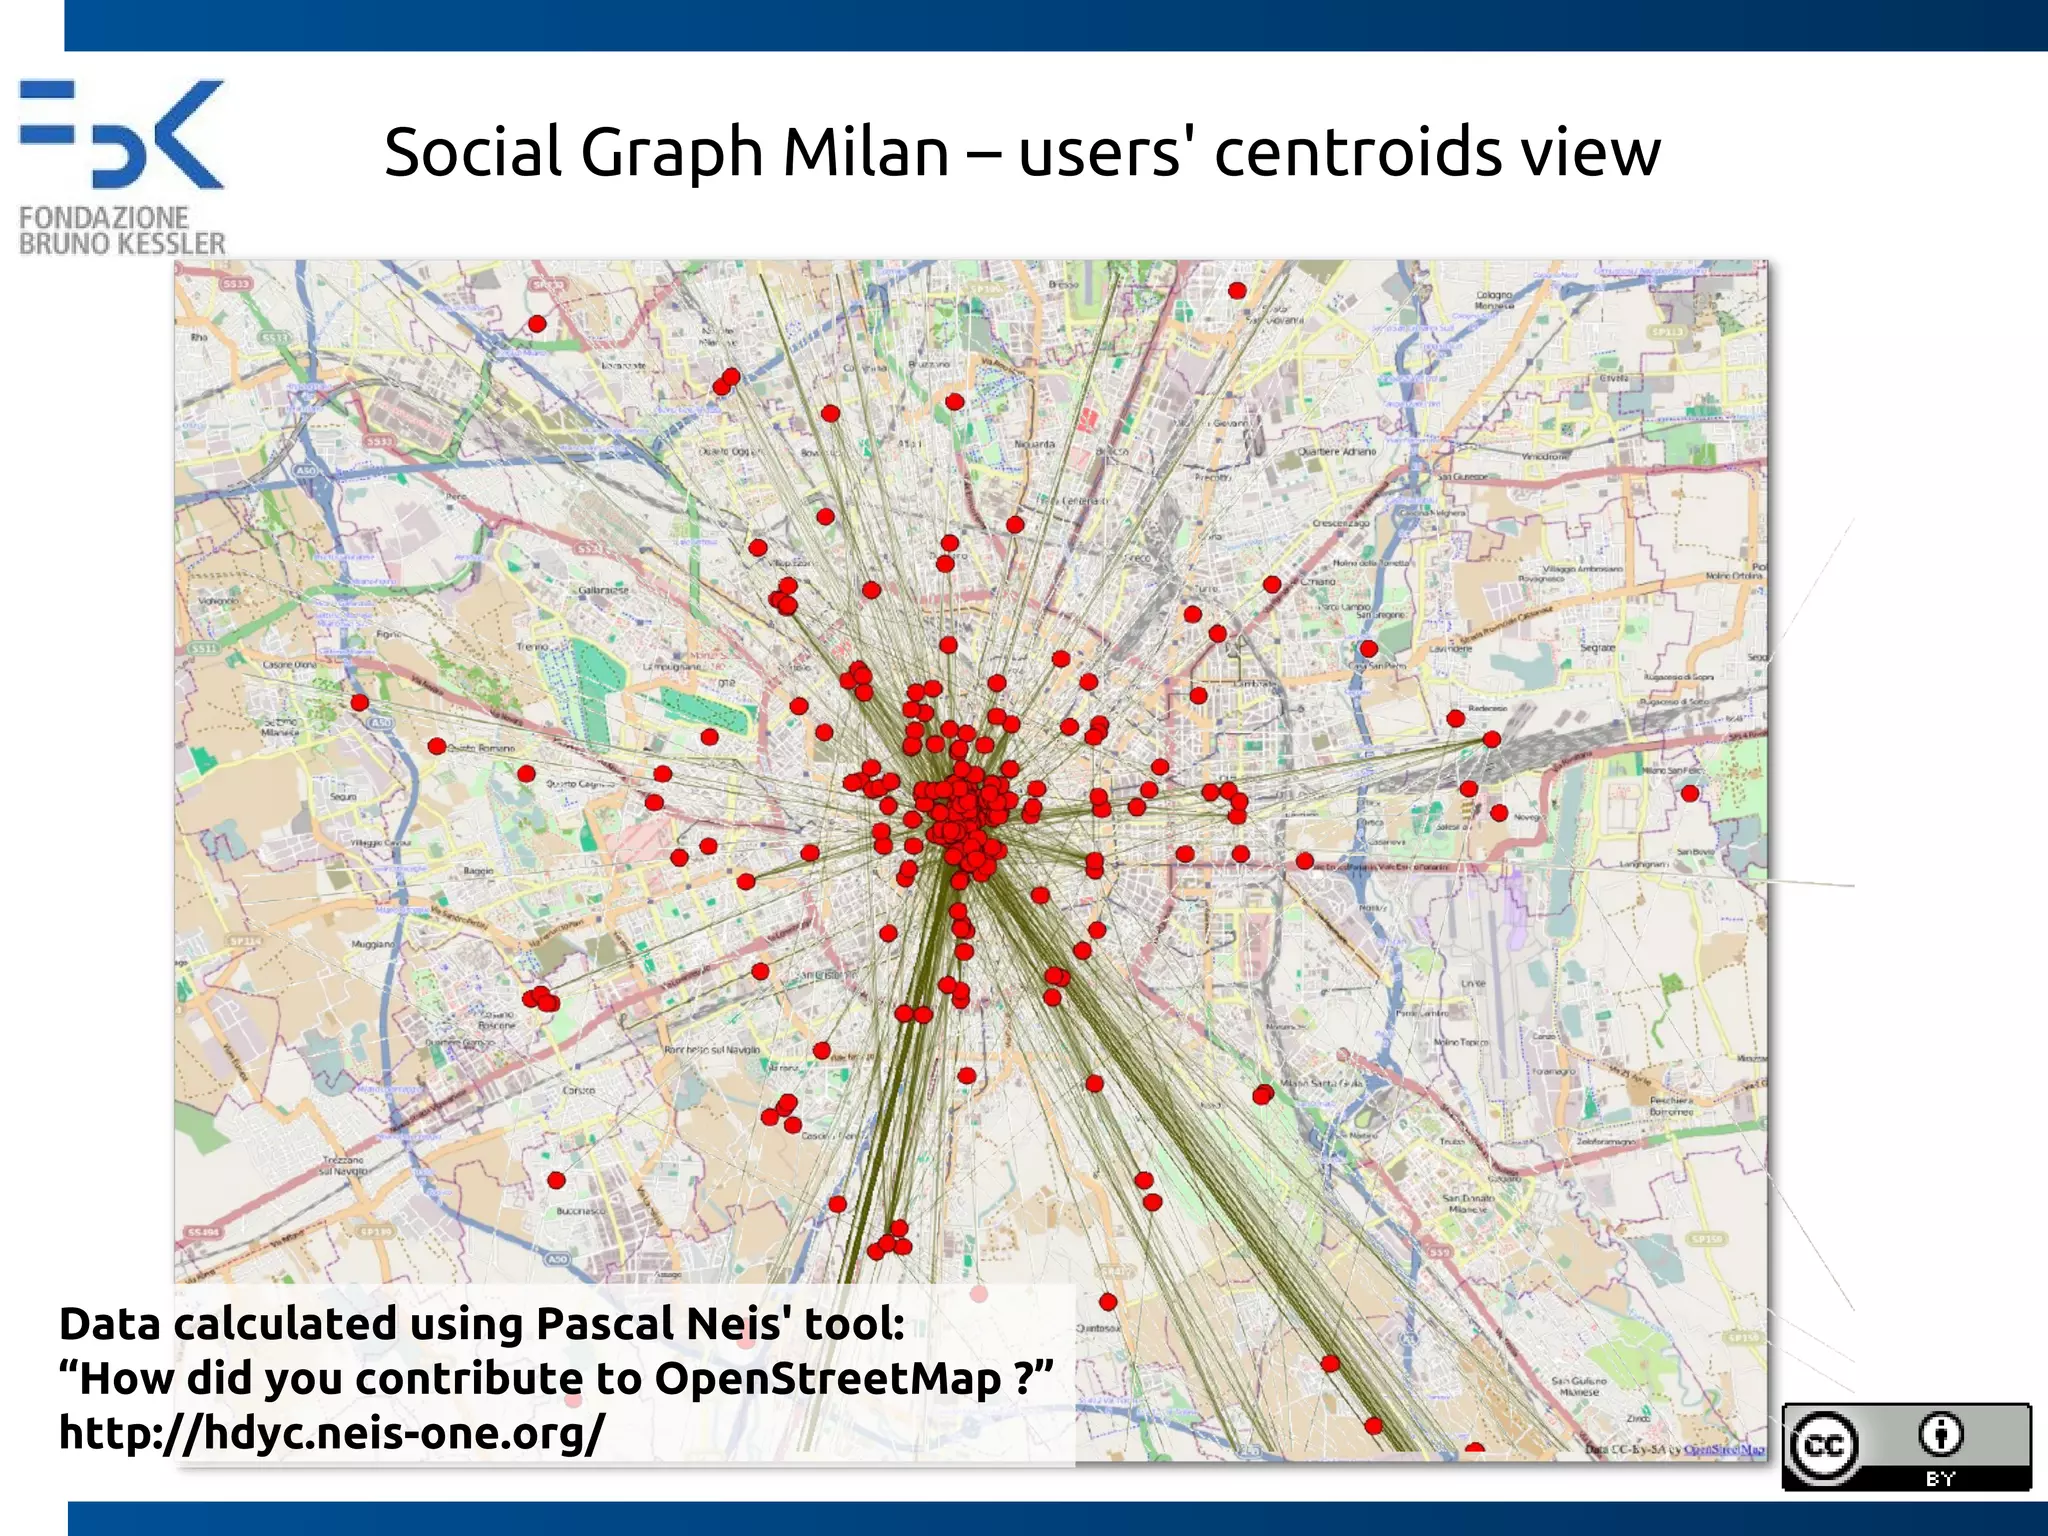
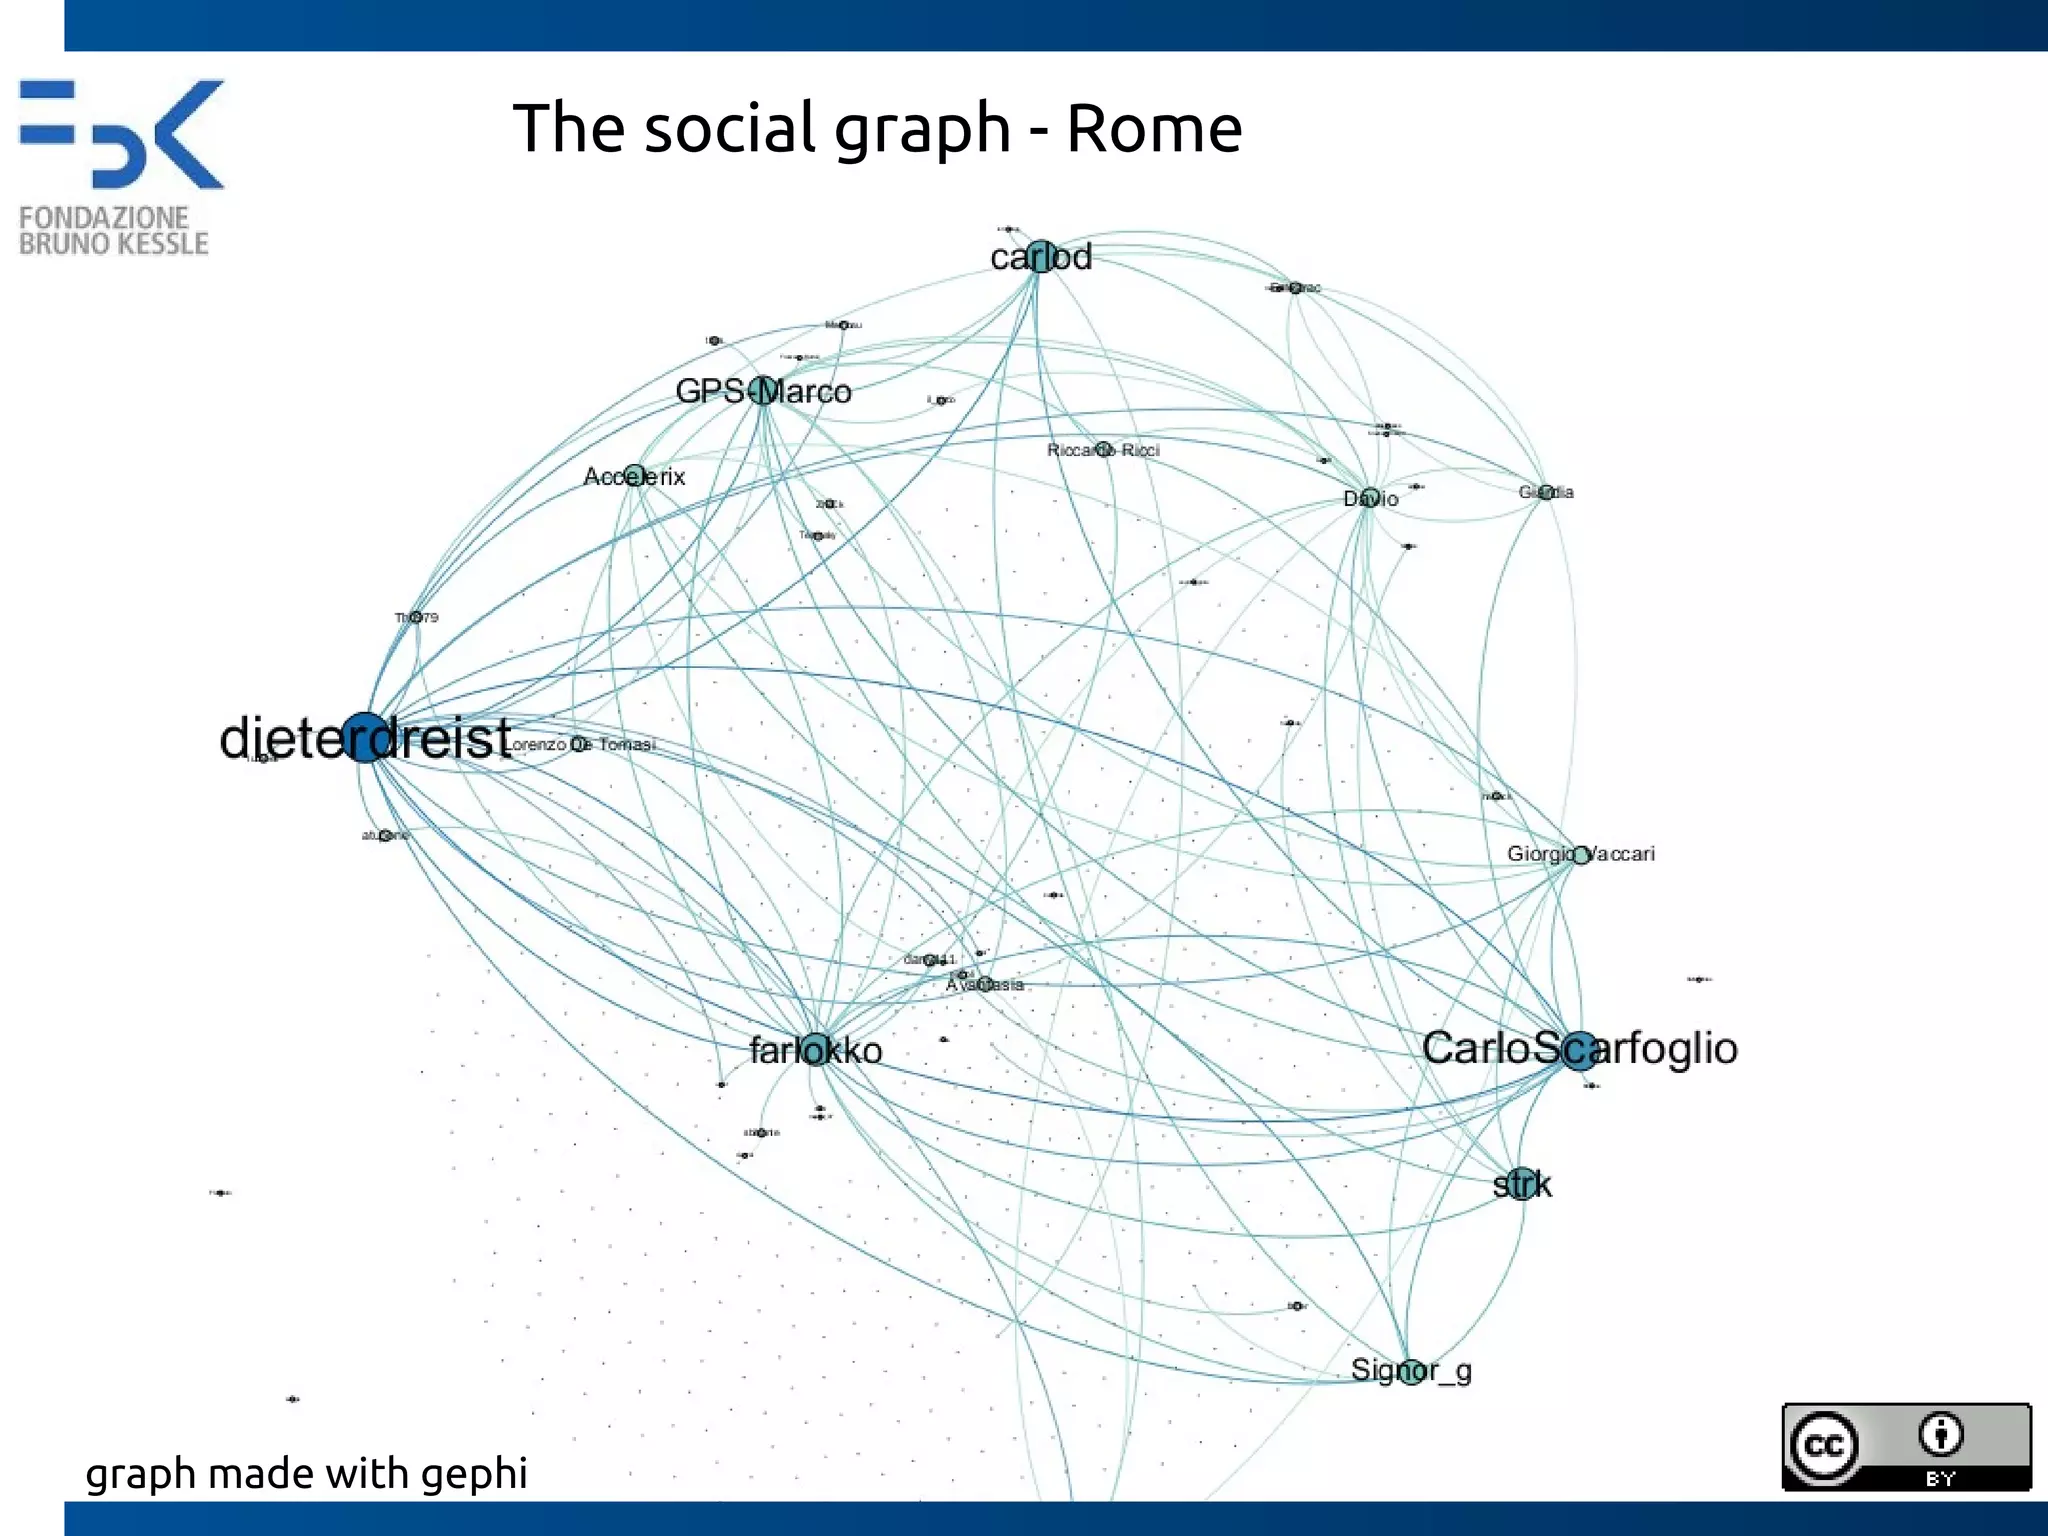
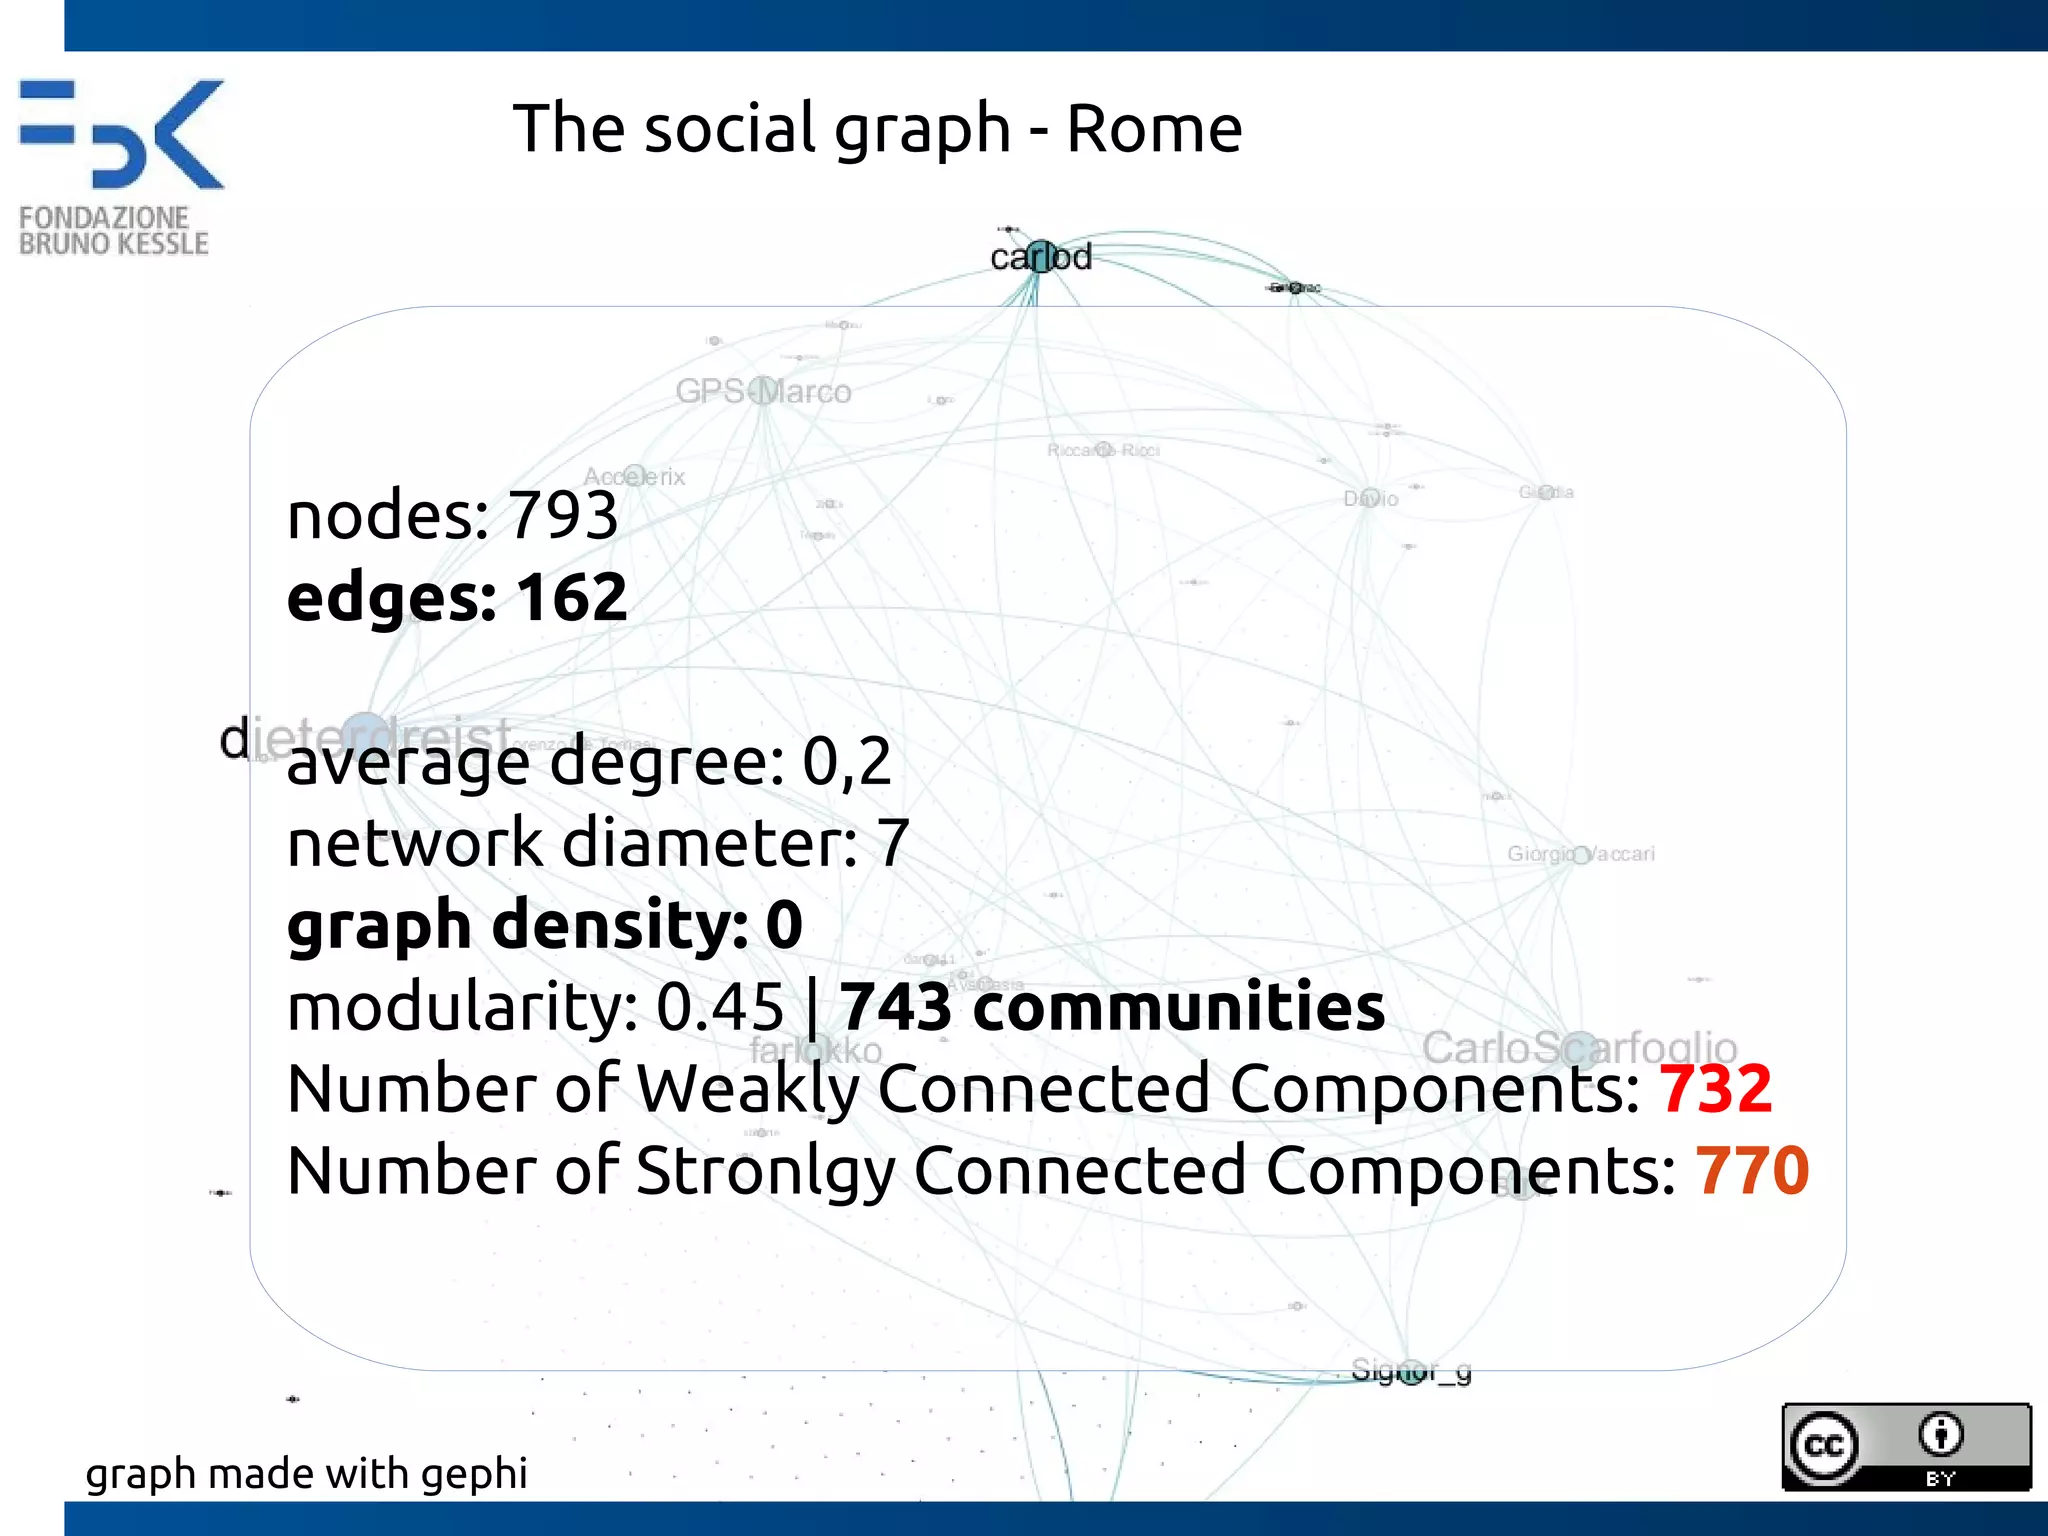
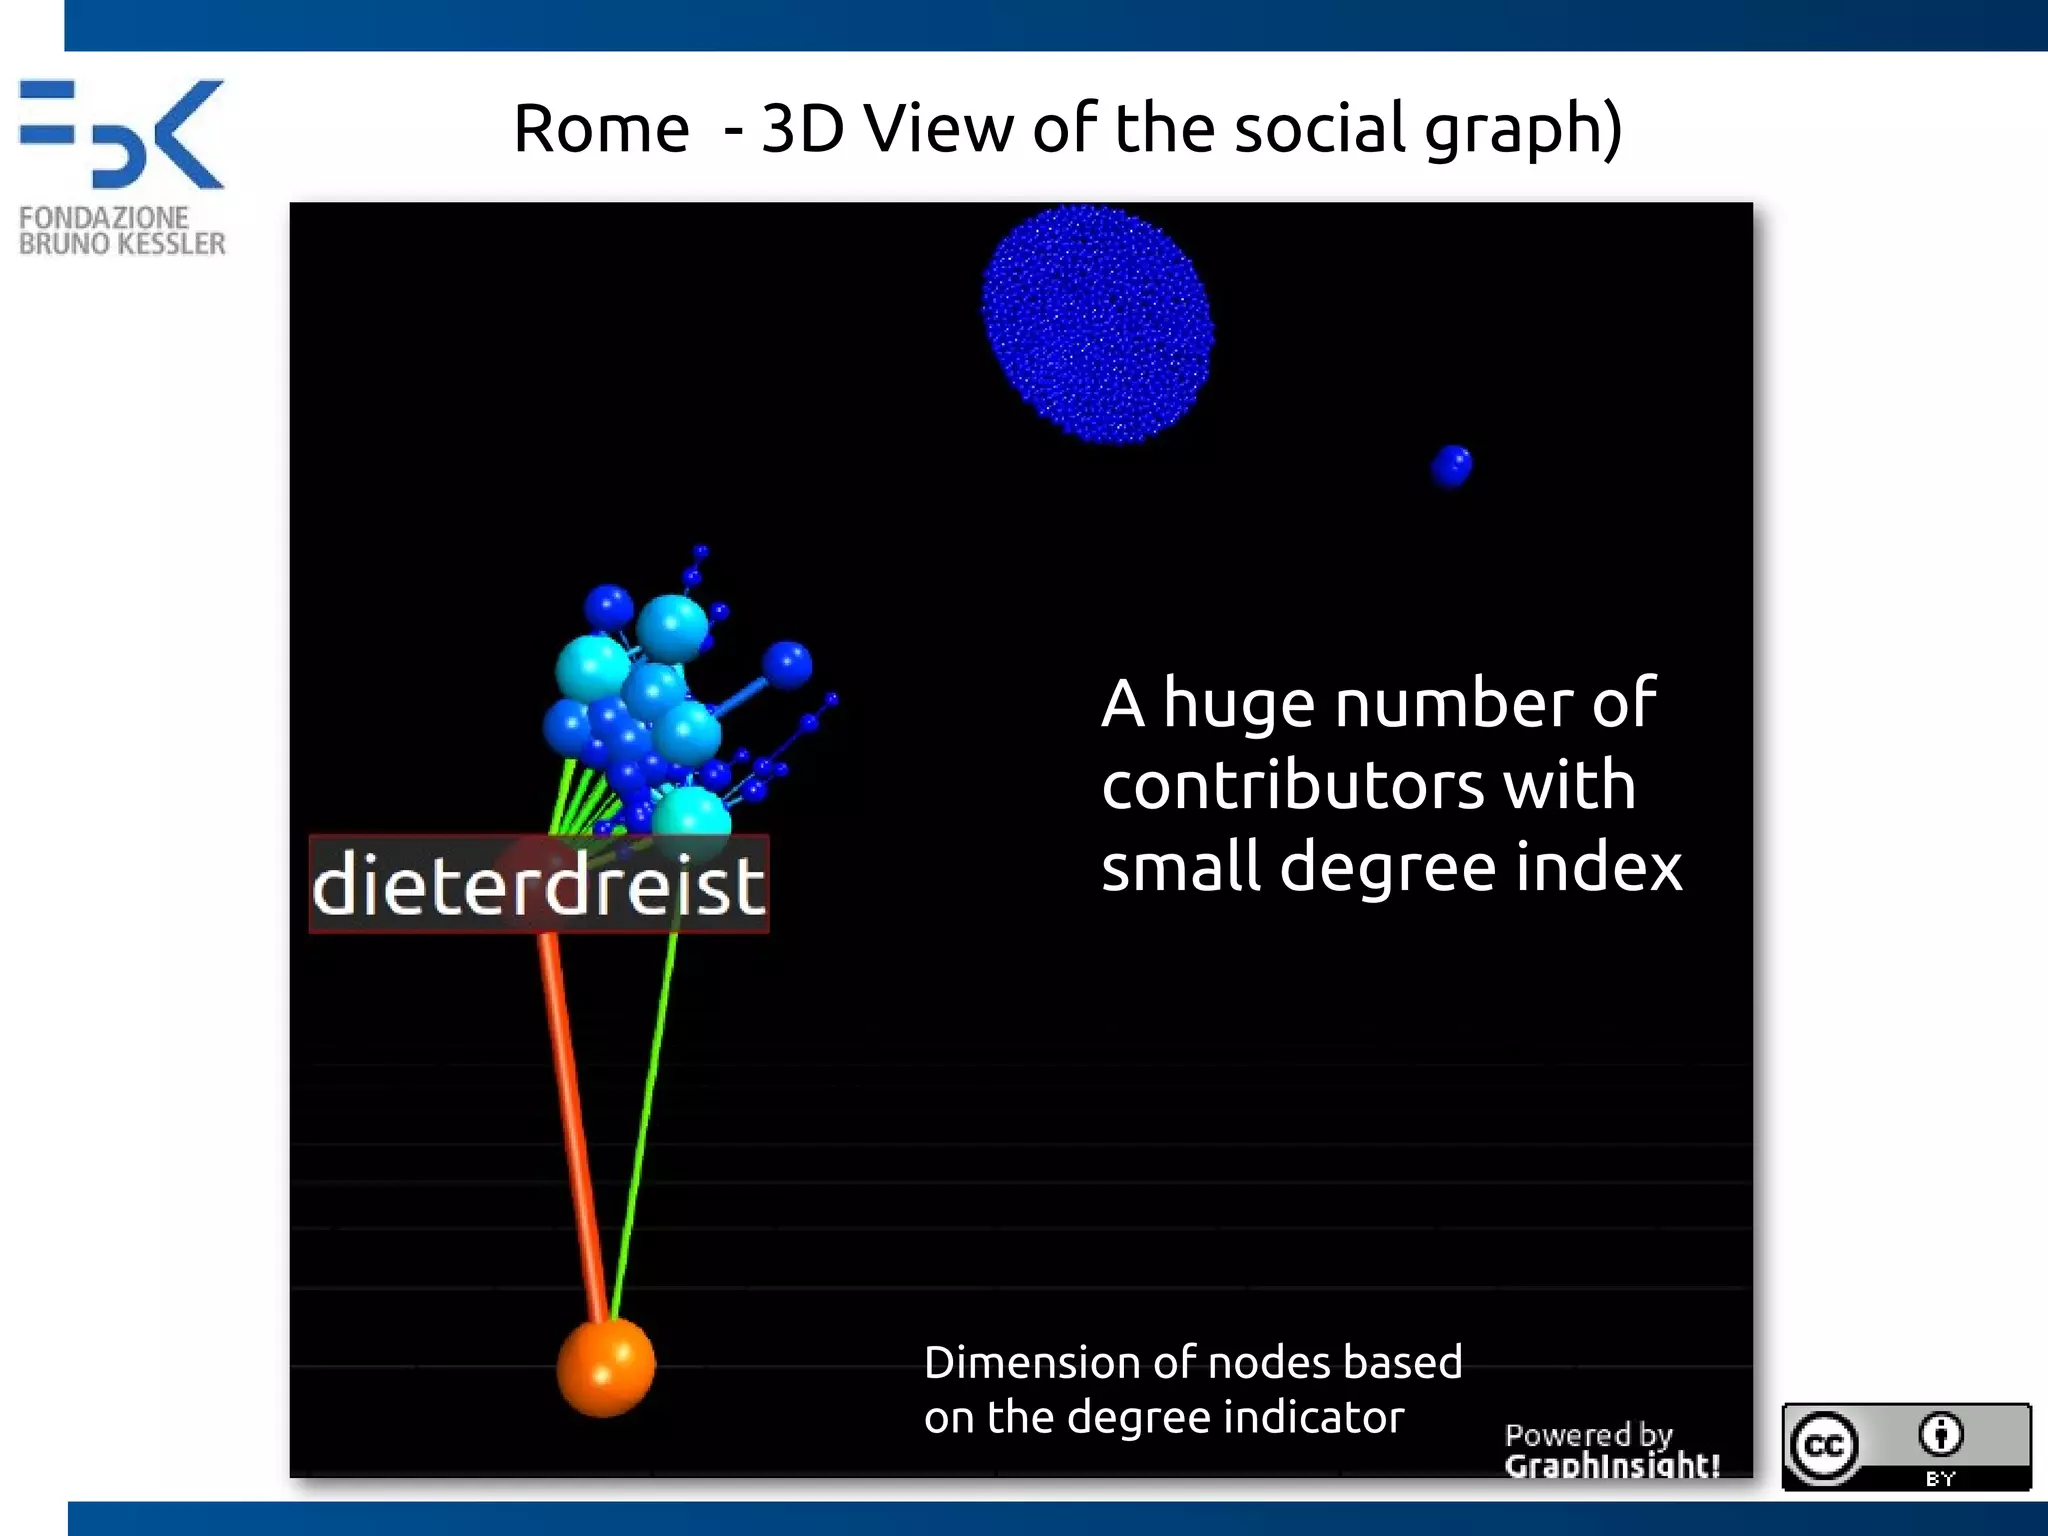
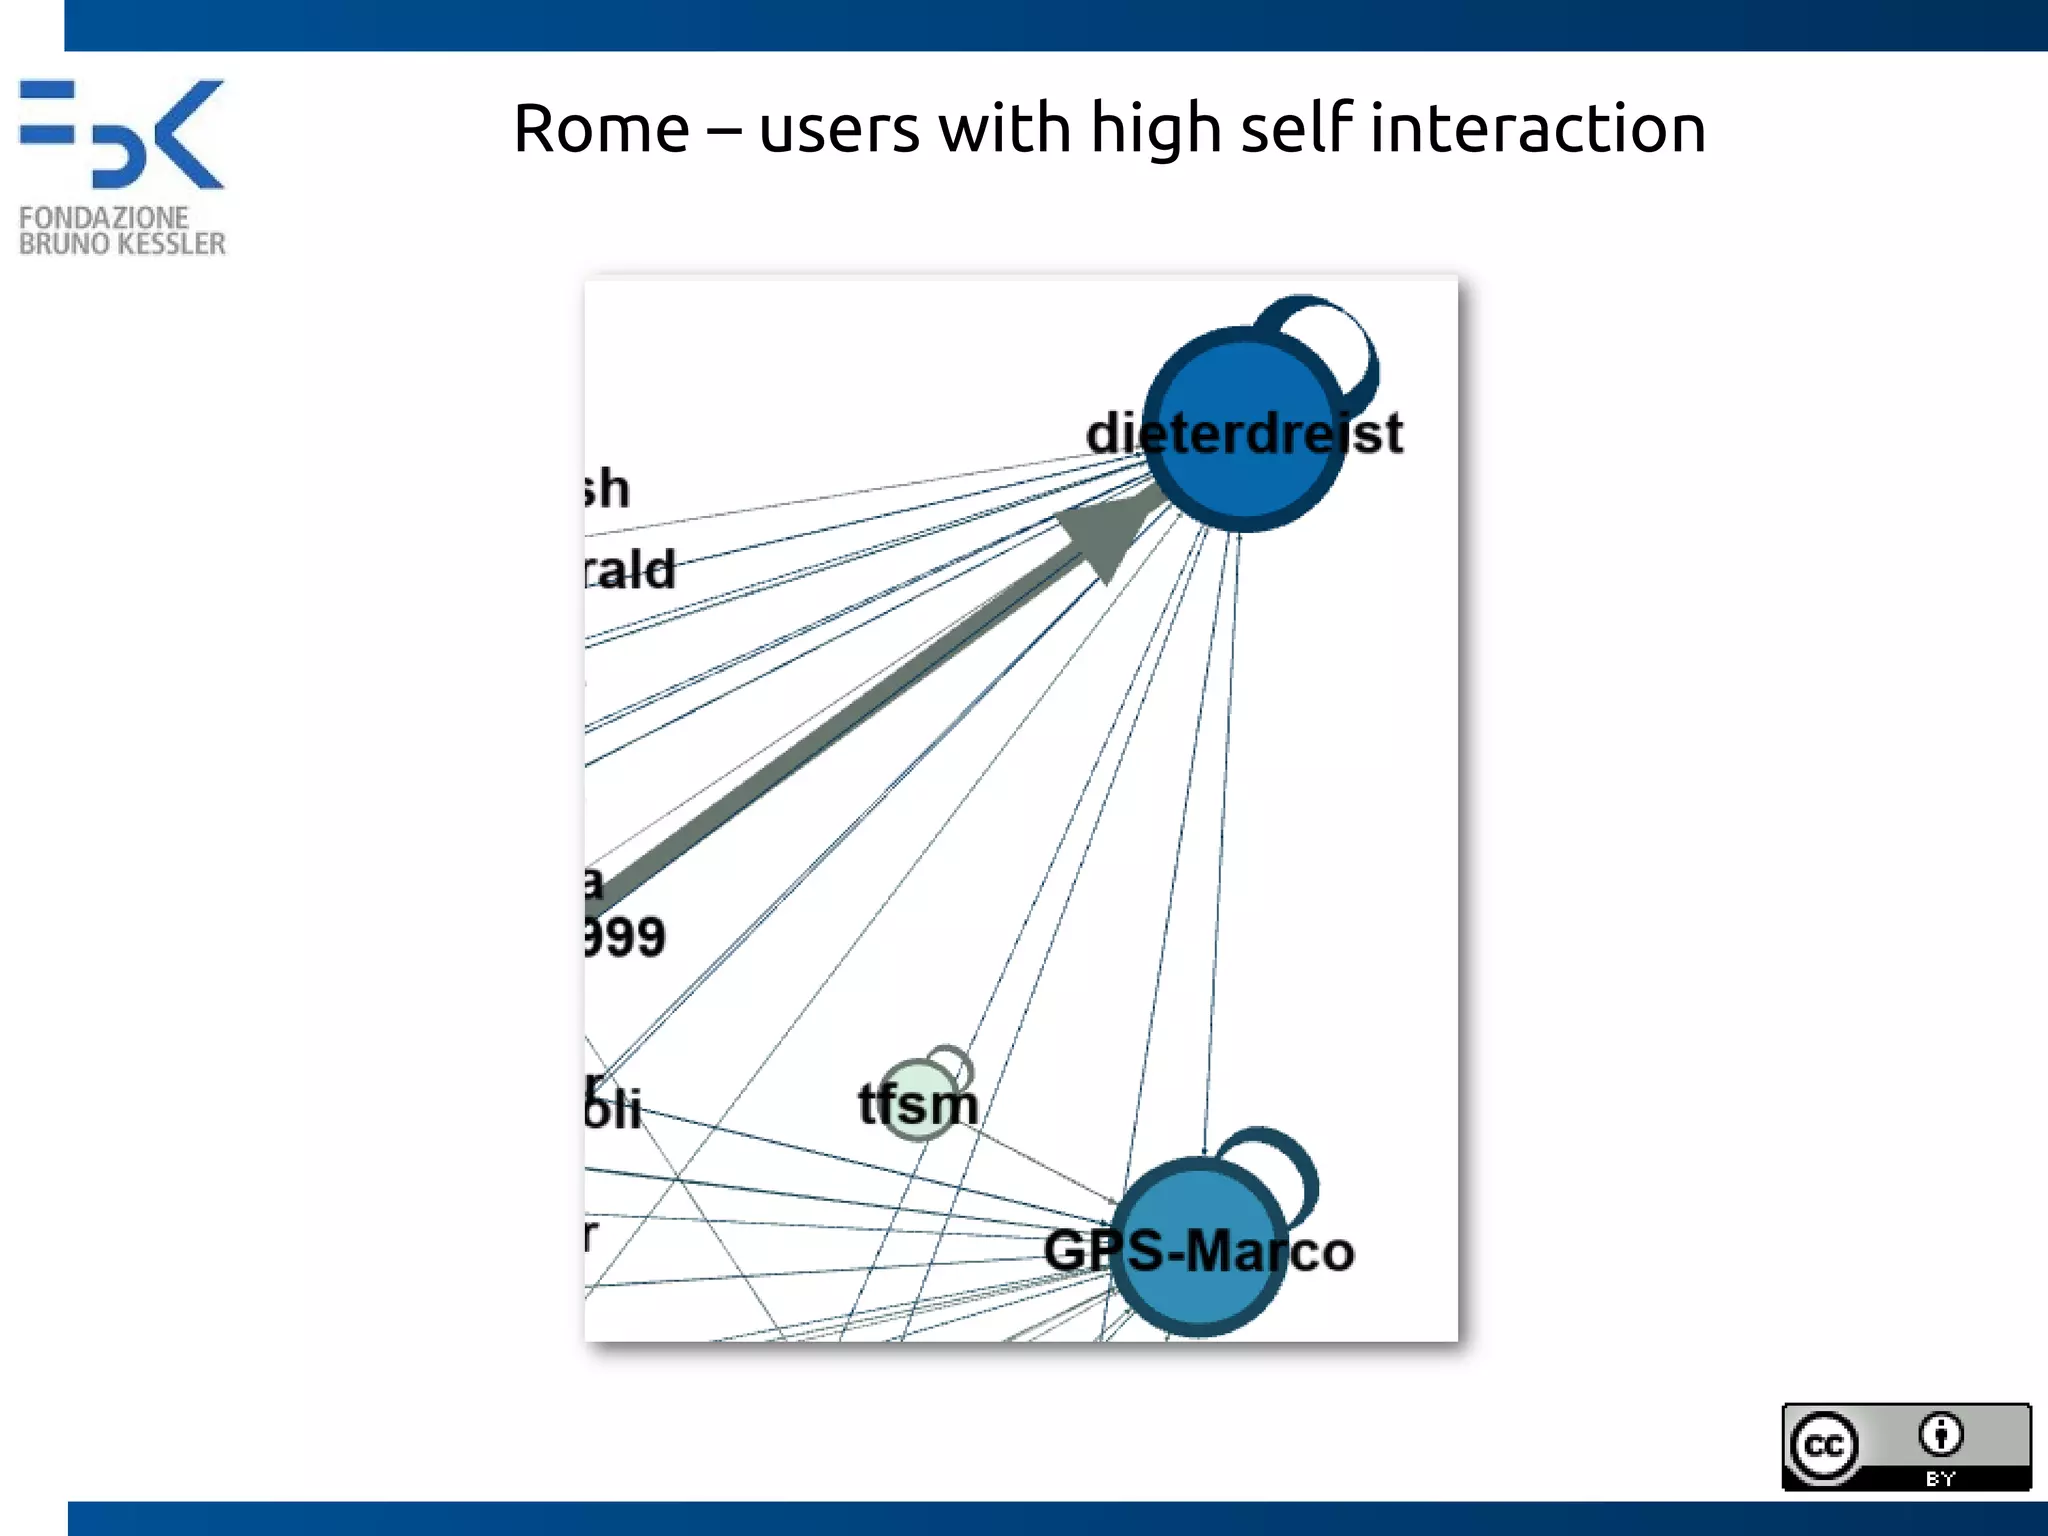
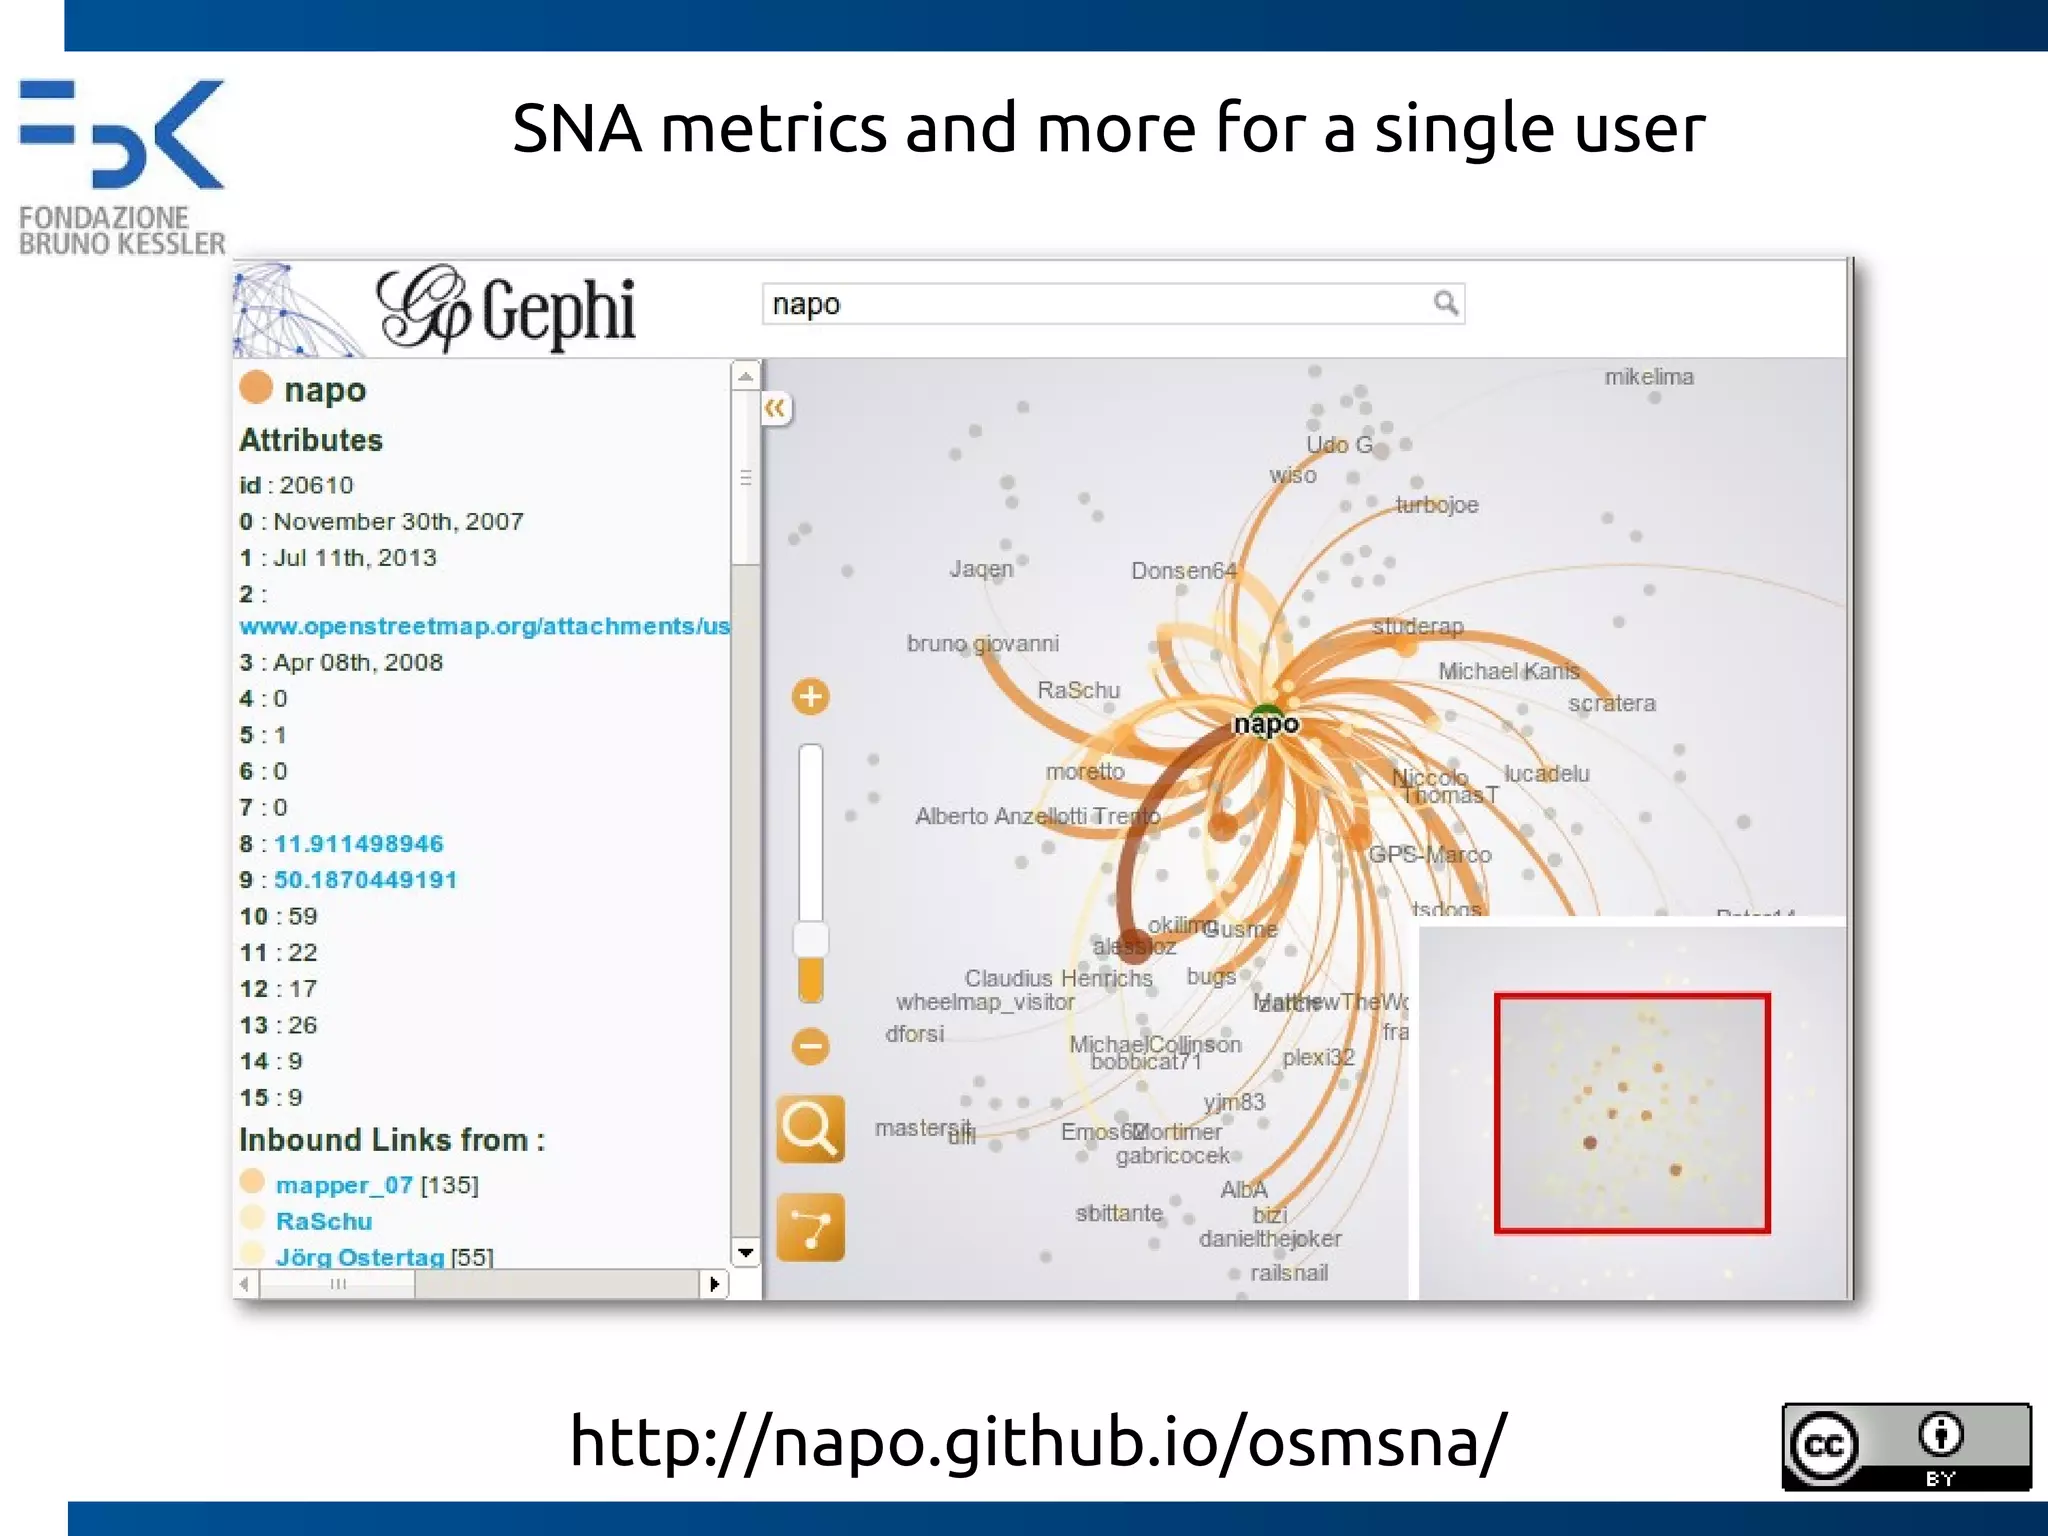

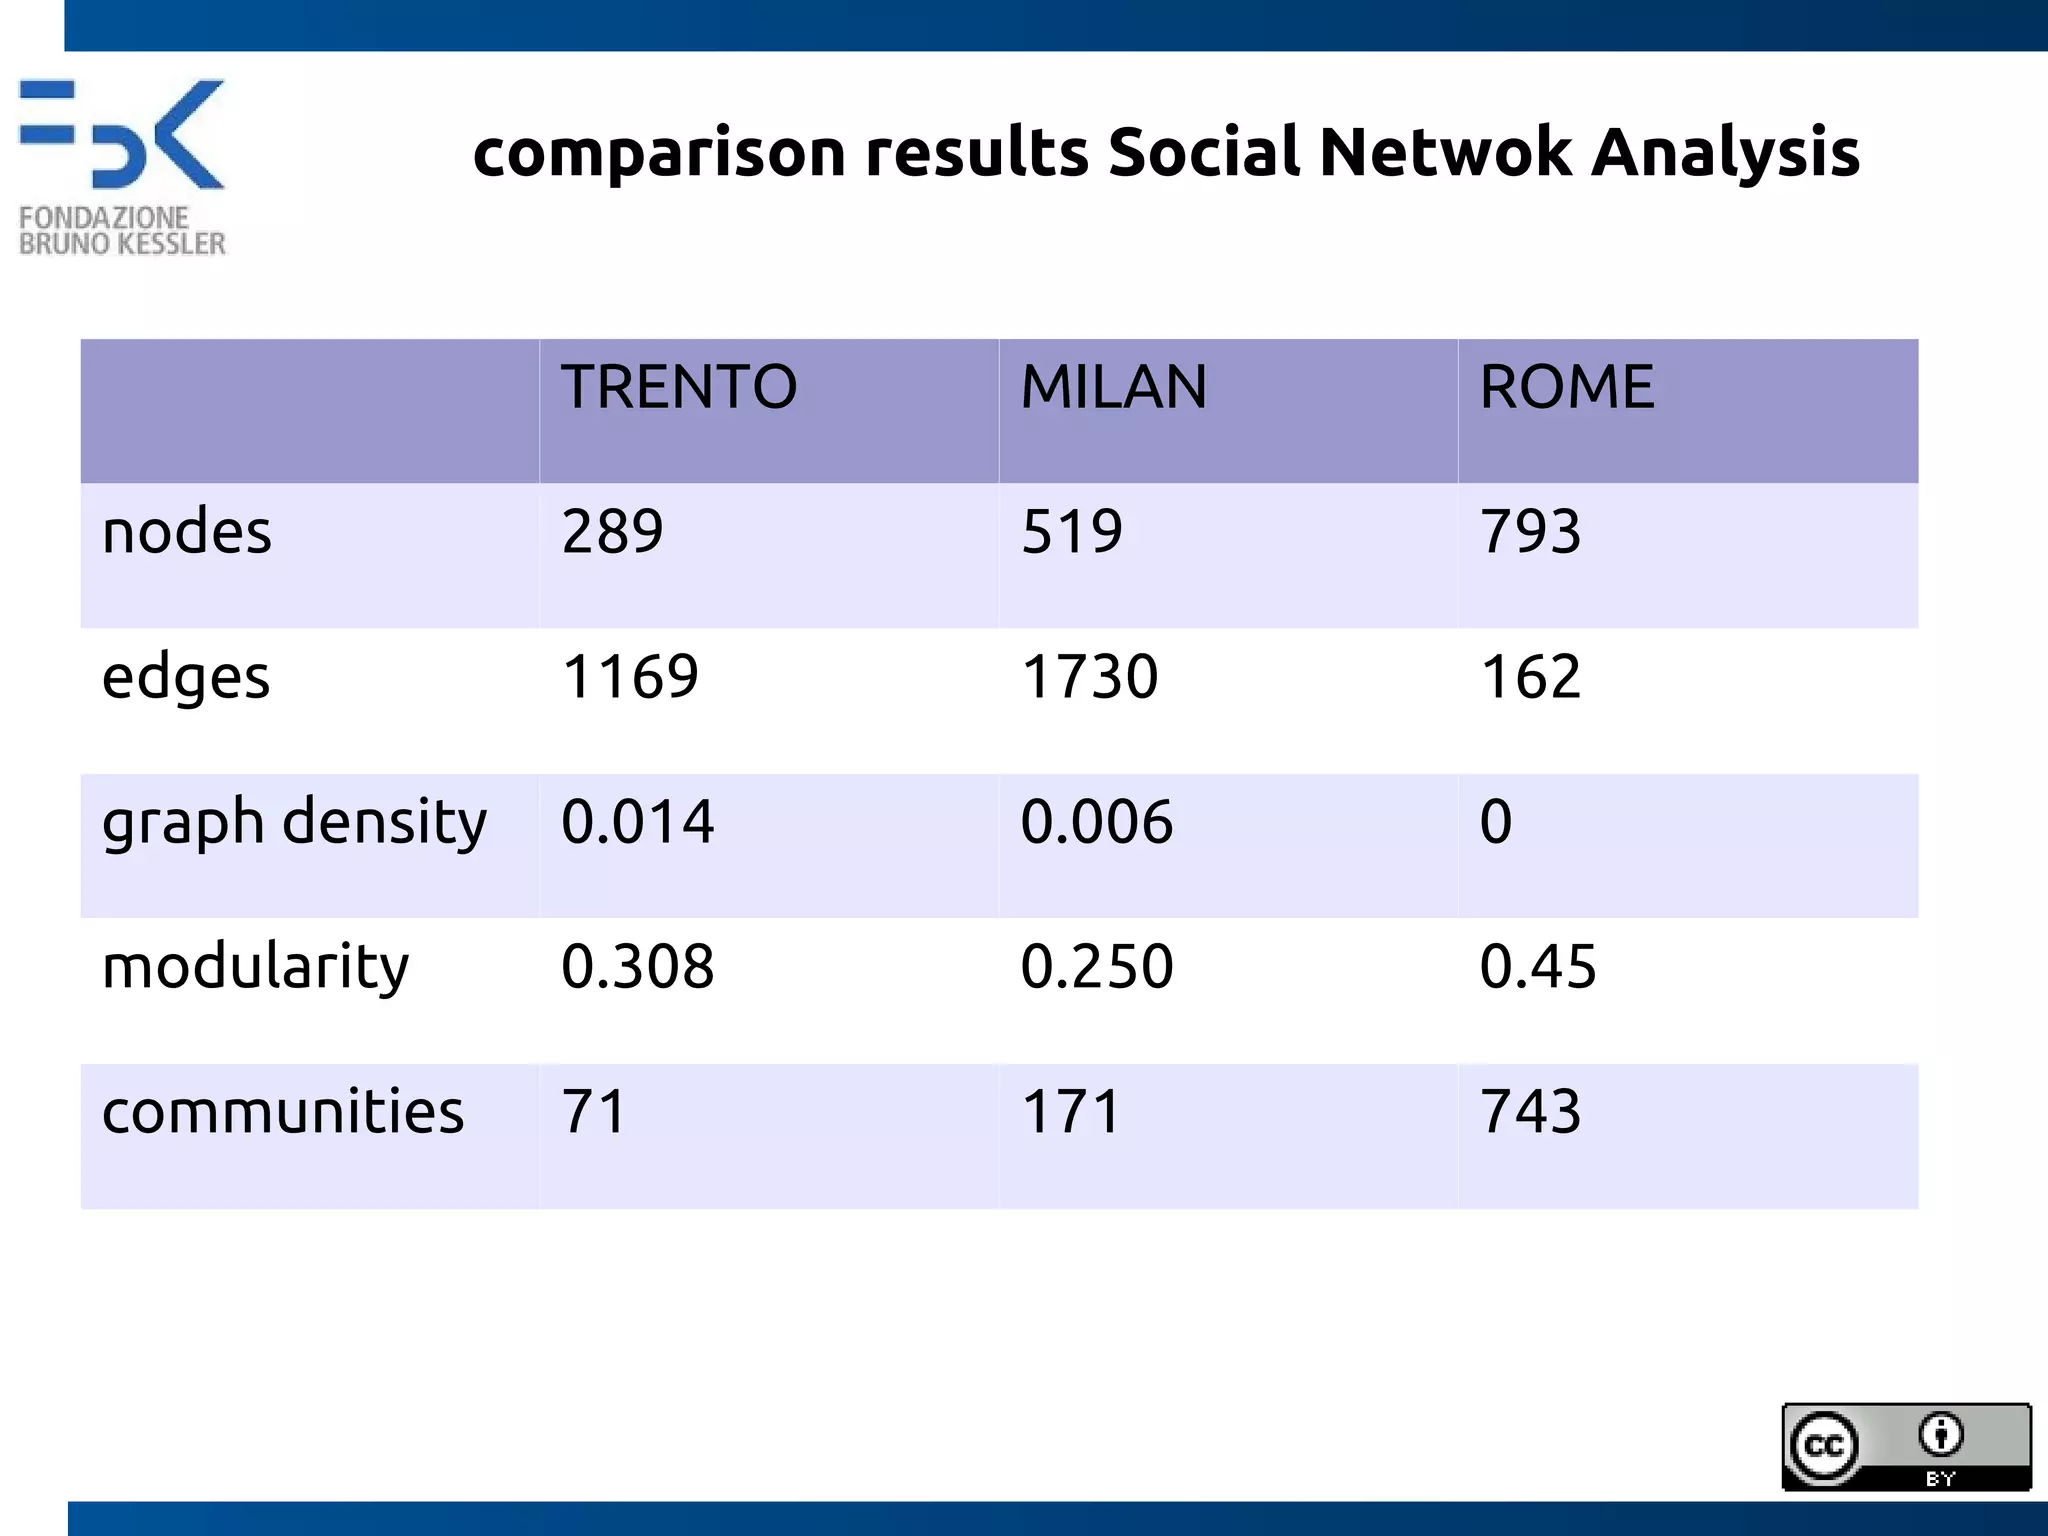

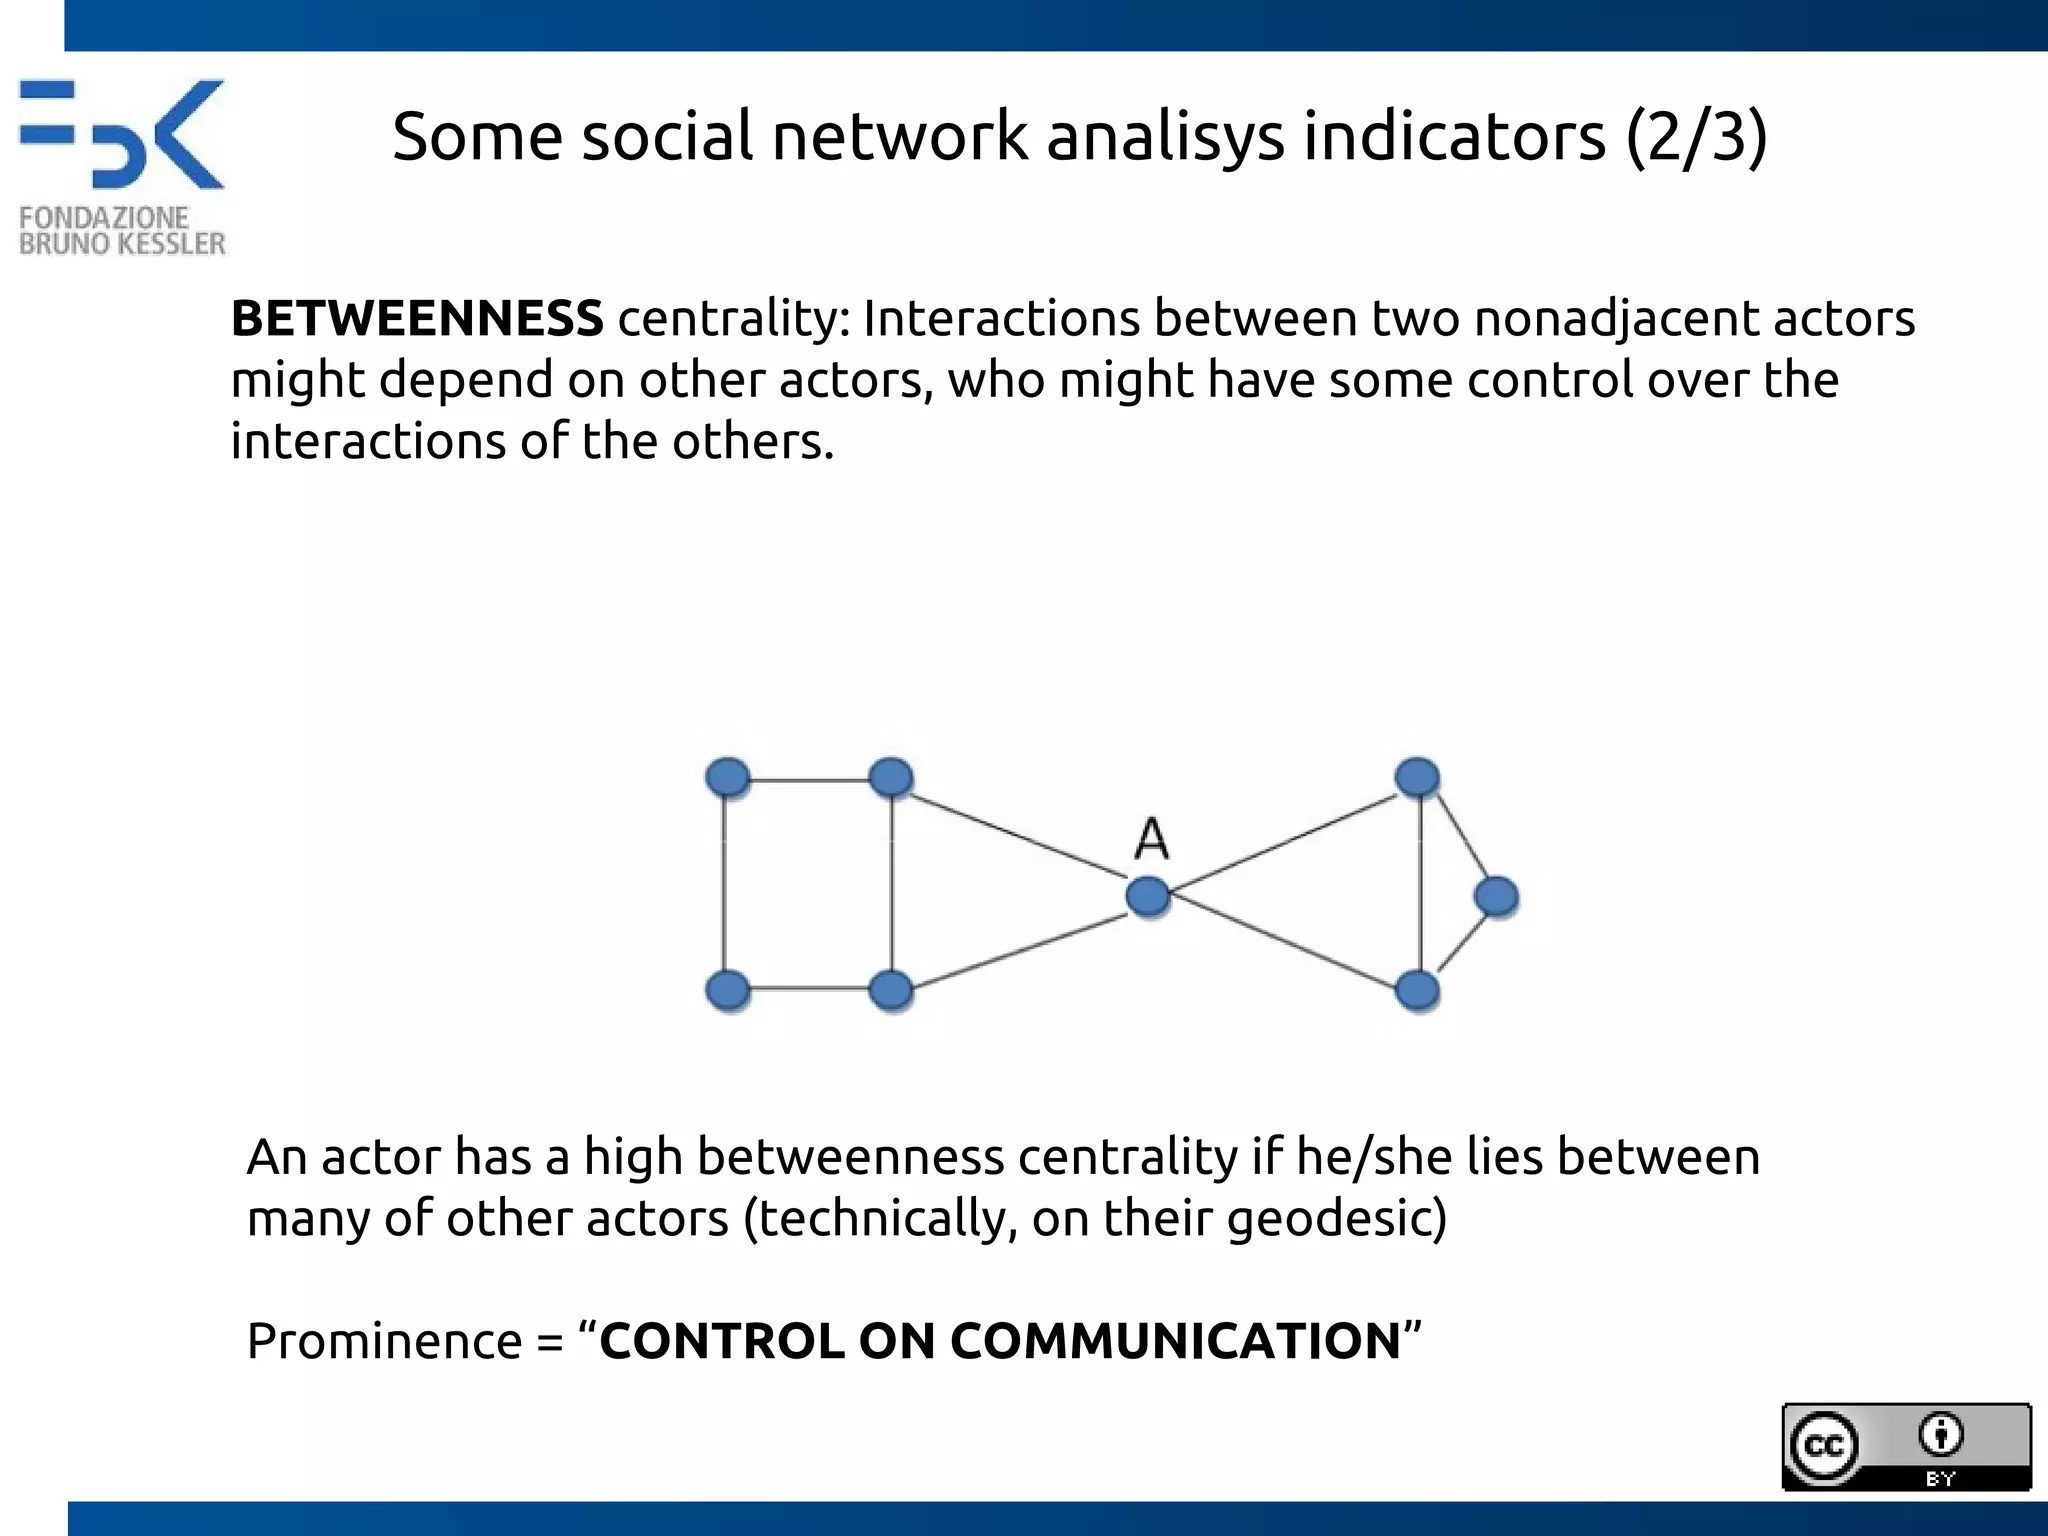
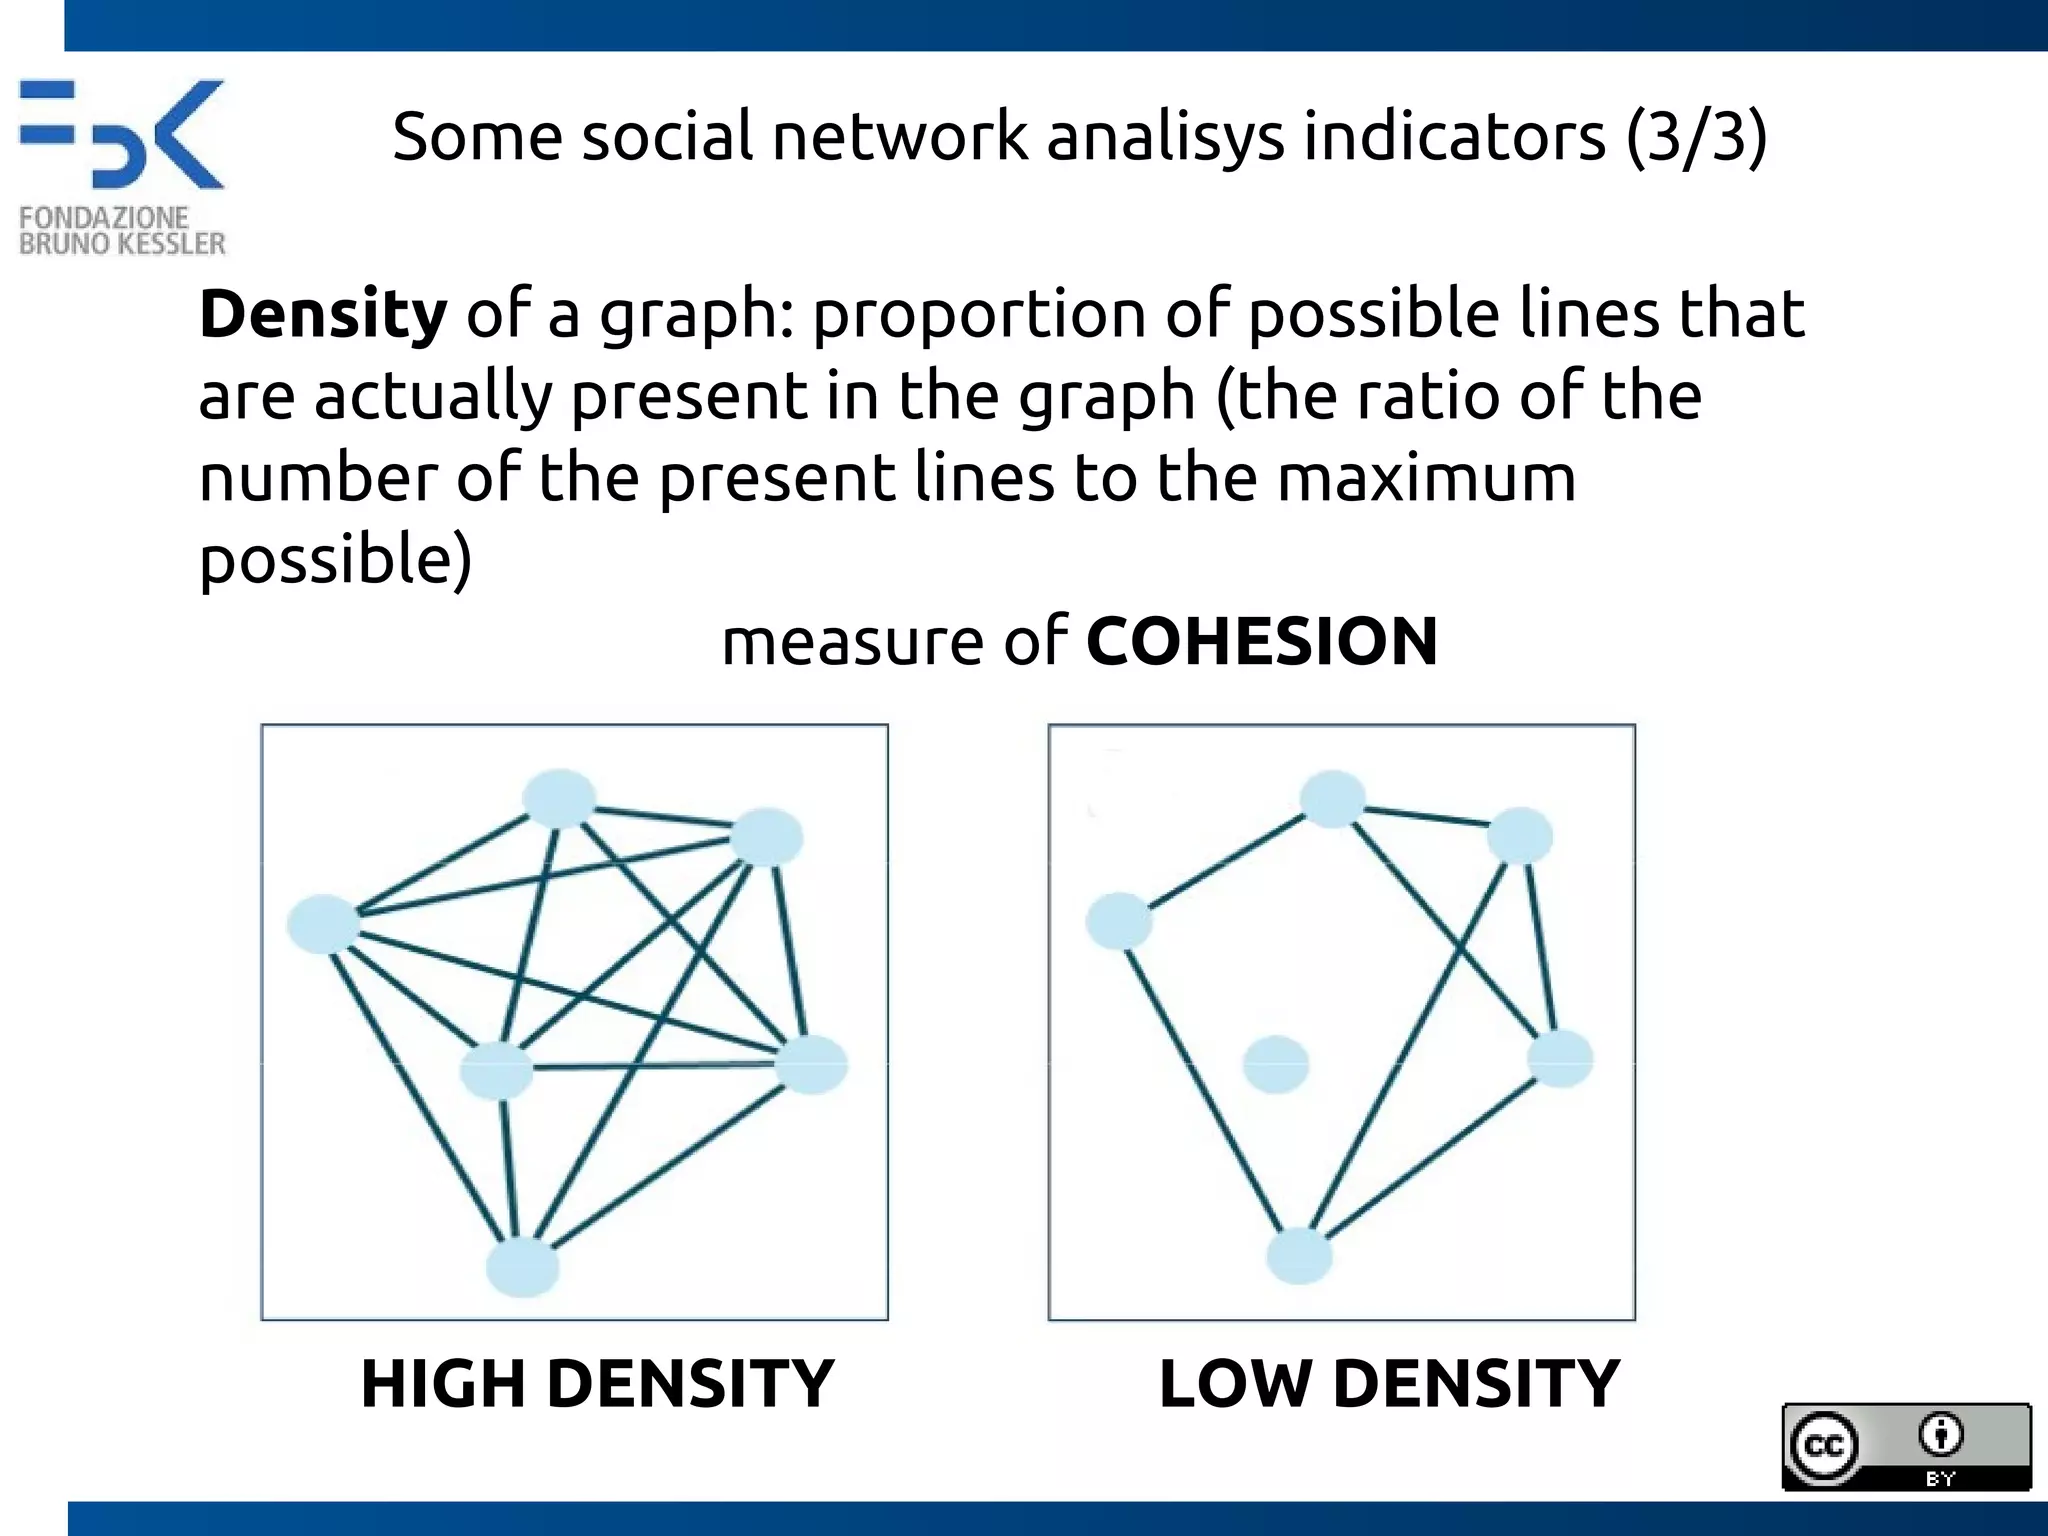

This document discusses the collaboration network within OpenStreetMap (OSM) in Italy, focusing on cities like Trento, Rome, and Milan. It presents social network analysis indicators to measure user interactions and community cohesion, showcasing data visualizations and metrics derived from the OSM history files. The results aim to enhance understanding of individual and collective behaviors within the OSM community and suggest future steps for deeper analysis and data quality assessment.


