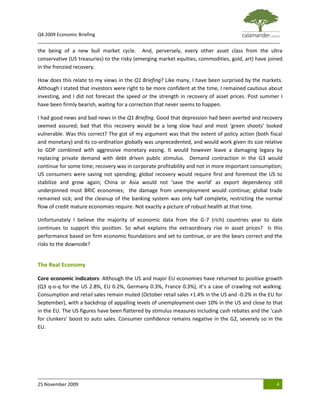
The document provides an economic briefing for Q4 2009. It summarizes that while major economic indicators show the US and EU economies have returned to growth, the recovery is slow and unemployment remains very high. Housing markets especially remain weak with signs of deflation. Trade and industrial activity are starting to recover but consumer spending and confidence remain subdued. While markets have rallied strongly, the underlying economic fundamentals still suggest a long, slow recovery.
The document discusses the global economic outlook for Q1 2011. It notes that advanced economies are experiencing slowing GDP growth rates, some nearing recession levels again, while Singapore continues growing steadily at around 4%. It also shows charts depicting declines in investment spending, industrial production, and exports in advanced economies as signs their recoveries are weakening, making these countries like "canaries in the coal mine" warning of broader global economic troubles.
Toscafund Discussion Paper- 1992 It will be deja-vu all over againsavvas savouri
- The document discusses how leaving the EU in 1992 through the UK's exit from the ERM (European Exchange Rate Mechanism) led to a weaker pound, stronger GDP growth, and rising stock markets, and argues a similar outcome will occur again.
- It argues the UK economy is stronger now than in 1992, with higher employment and a more service-oriented economy. Global conditions also favor the UK, with emerging markets like China now major trading partners.
- The author believes inflation will remain stable, predicted GDP growth of 1.8-2.2% in 2017, and that the UK will see the strongest economic growth in the EU after leaving the bloc.
September 2016 Toscafund Economic Update Issue 38savvas savouri
1. Long-term loose monetary policy can become seriously addictive if the underlying economic problems are not addressed. Japan initiated ultra loose money over 20 years ago but failed to restructure industries or implement other policies, resulting in addiction to monetary fixes. The US has also relied on loose money for a long time without structural reform. Nations must address fundamental issues, not just treat symptoms with short-term monetary policies, or risk dangerous addiction to cheap money.
Years ago, the seeds were sown.
Governments began an untenable trend of consistently spending more money than they collected in taxes. The difference of course, was made up by borrowing. As the years and deficits rolled along, so too did the amount of money owing. Governments responded by borrowing even more.
Meanwhile, global economies inevitably experienced varying crises. Governments and central banks always responded the same way - even more spending (and borrowing), and lower interest rates to stimulate growth.
Today, we've reached a dead-end.
Governments continue to borrow, but only because interest rates have been reduced to 0% AND because they are borrowing from themselves by printing money.
This dead-end is also compounded by a slowing global economy caused by the reluctance of private investors to spend.
In this issue of the IceCap Global Outlook, we prepare investors for a collision between:
a slowing economy,
0% and negative% interest rates,
an unsustainable debt binge.
What happens next hasn't occurred before in our lifetime - and this is why many investors will be blindsided.
The document discusses the growth of tourism within the UK. It provides information about popular UK tourist destinations and reasons for their popularity. It also discusses factors that can affect the number of tourists visiting the UK, such as currency exchange rates, terrorism, economic conditions, and media coverage. Popular locations mentioned include London, coastal resorts, national parks, and cities like York, Edinburgh, and Oxford. The Butler tourist resort cycle model is also explained, showing the typical stages of exploration, involvement, development, consolidation, and potential decline or rejuvenation of tourist destinations.
July 2016 Toscafund Economic Update Issue 37savvas savouri
1. Purchasing managers have cut stock purchases due to fears over Brexit hurting demand, as they were repeatedly warned, even though final demand has held up better than expected. This has negatively affected supply chains and poor PMIs. However, like after 2008, the UK economy has had inventories drained, which will spur a rebuilding and boost activity, as lower inventories mean pricing power for those with stock. The current situation may not be as bad as feared and could help avoid deflation.
The document discusses the impacts and implications of Brexit on global markets and the economy. It argues that while markets have largely recovered from the initial shock of Brexit, underlying economic issues remain. Central banks have helped prop up markets through monetary policies like low interest rates and liquidity injections. However, Brexit highlighted growing unrest with the current economic system as inequality and low-wage jobs increase. The long-term stability of the global economy remains precarious as repeated shocks continue to weaken its foundations, similar to a unstable game of Jenga. Precious metals like gold benefited as a safe haven investment following Brexit. The full consequences of Brexit will only become clear as the UK's exit negotiations with the EU progress.
In this issue, IceCap shows how the Toronto housing bubble has been created and what will make it break - the answer may surprise you.
In addition, we detail how the European Central Bank has applied all sorts of financial make-up to convince the world that Italy, Spain, Portugal and others are in solid, financial shape.
Of course, the problem with make-up is that eventually it wears off, and then what is left exposed is not pretty.
Point break A LT Technical Analysis Approach by investlogicClaude Gaudin
This document provides a summary of trends that may lead to major economic breakdown by the end of 2015, according to cycles analysis. It identifies issues like debt saturation, resource shortages, and geopolitical tensions. The consequences could include fiat currency failures, currency wars, and increased statism. Several financial and economic cycles, including a Kondratieff wave cycle, suggest that a downturn may begin in late 2012 and worsen through 2015. Precious metals may hold value better than other assets in the coming turbulent period.
This document summarizes a presentation about investing in property markets. It discusses the slowing UK property market and suggests investing in faster growing international markets. Specific options mentioned include land, development projects, buying off-plan properties, and buy-to-let in places like newer EU countries experiencing strong economic growth and increasing foreign investment. The presentation aims to help investors protect and grow their wealth by diversifying into higher returning markets.
This document describes a simulation that will examine the temperature dependence of the internal energy and radius of gyration of a coiling polymer strand. The simulation will involve modeling a polymer as a chain of spherical beads connected by springs. It will be subjected to Langevin dynamics simulation at different temperatures to observe how the internal energy and radius of gyration change with temperature. The results of the simulation could provide insight into the coil-to-globule transition of polymers in solution as temperature varies.
CELTICGOLD is based on the Isle of Man but provides buying and selling services for over 90 countries worldwide.Celticgold is one of very few bullion companies in the world that next to best prices and a fast and secure service provides knowledge for you to become a gold-insider.
The document discusses various topics related to the stock market including stocks, growth stocks, value stocks, daily volatility in markets, rookie stock market investors, the stock market crash of 1929, and technology and the stock market. It provides background on stocks and categories of stocks. It also discusses the impact of increased responsibility on investors from a shift away from reliance on stockbrokers.
Everyone enjoys a nice surprise - especially the ones that cause you to grin ear to ear, smile non-stop and wish the moment will never end.
There can also be bad surprises - and these are not the least bit enjoyable.
In this issue of the IceCap Global Outlook, we explain how governments are about to experience a bad surprise. And their reaction to these surprises will be significantly higher taxes for everyone.
There will also be a good surprise - adjusting your portfolios in anticipation of the bad surprise will allow you to not only preserve your capital, but also have you grinning ear to ear.
We invite you to read more.
1. Business cycles involve periods of economic expansion and recession. During expansions, GDP, employment, and confidence rise while inflation and unemployment fall. The opposite occurs during recessions.
2. A recession is defined as a decline in real GDP for two consecutive quarters. A depression involves an eight quarter decline in GDP. Recessions are caused by decreases in consumption and investment due to factors like falling income and orders.
3. The document analyzes past US recessions and their causes, focusing on the Great Depression and 2008 Financial Crisis. Risky lending practices contributed to housing market collapses that precipitated these two major downturns.
Copper A Brief History Of Peaks, Valleys, and Trends In PricesJohn E. Gross
The document discusses the history of copper prices over the past 50 years, analyzing the bull and bear markets. It identifies 10 major bull markets since 1970, with price gains ranging from 44-495% over 15-55 months. The 5 most recent bull markets lasted 18, 55, 15, 26, and 27 months respectively, with price increases of 46%, 495%, 53%, 224%, and 54%. Shorter bull markets tended to be cut short by global surplus, economic crashes, or financial crises. Given the current absence of such issues and ongoing global growth, the analysis predicts the current bull market will continue its run.
How To Write A Thesis Statement For A Research PaperNancy Ideker
The document provides instructions for writing a thesis statement for a research paper in 5 steps:
1. Create an account and provide login credentials.
2. Complete a form with paper details, sources, and deadline to request a paper be written.
3. Review bids from writers and choose one based on qualifications to start the assignment.
4. Review the completed paper and authorize payment if satisfied, with free revisions available.
5. Choose this service confidently knowing needs will be fully met, with refunds for plagiarized work.
Stirring Introductory Paragraph Examples For ELuz Martinez
The document discusses the establishment of Mission San Juan Bautista in California by the Spanish in the late 18th century. It was one of the missions built by the Franciscans to convert Native Americans to Christianity and extend Spanish colonial rule. The mission was located near a river and built according to a standard plan with buildings around a central courtyard. It housed several Native American tribes who lived and worked there, though conflict sometimes arose. The missions had influence on the culture and way of life of the indigenous peoples.
Master Investor Magazine February 2016 - What NowMaria Psarra
This document is a February 2016 issue of the Master Investor magazine. It includes articles on various investment topics such as commodities, oil, shale, lithium, currencies, and junior mining stocks. One article interviews Justin Urquhart Stewart of Seven Investment Management to get his views on the recent market downturn. Another article profiles trader Robbie Burns and what stocks he has been buying in the sell-off. The issue also includes the regular sections on trading diaries, opportunities, economics, and company profiles.
She adores hats. She is always very polite and respectful of others. She waves to everyone, and consistently avoids conflict. She is a lady; she is The Queen.
Without a doubt, Queen Elizabeth lives a life quite unlike everyone else in the World – after all, royalty does have its privileges. Yet, when it comes to investing, the Queen is swimming in the same pool of stock market sharks as us common people.
Like everyone else, she pours through her quarterly statements to see how she’s fared. And like everyone else, she loves to make money and simply deplores negative returns. It was rumored that the 2008 crisis hit her particularly hard – over USD 40 million in stock market losses.
This experience must have jilted something, as when The Queen was visiting the esteemed London School of Economics she asked the professor a rather “un-queen” like question – why did economists fail to predict the biggest global recession since the Great Depression?
The document discusses the economic effects of the UK's decision to leave the EU, known as Brexit. It argues that predictions of negative economic consequences are overblown. It notes that since the Brexit vote, the UK has seen a decline in the pound which boosts competitiveness, lower bond yields, and indications of lower interest rates - all of which could benefit the economy. It dismisses concerns about a "J-curve" effect from currency depreciation, arguing the modern UK economy is better positioned than in the past. The author believes reliable economic data has yet to emerge but the initial signs have been encouraging rather than concerning for the UK.
The document summarizes the major themes from the Davos 2010 conference. The five major themes discussed are:
1) Bank bashing, with Sarkozy leading criticism of banks. Banking stocks appear high risk.
2) Rise of China, which is redefining rules for commoditized businesses. China's influence and growth is a major trend.
3) Mounting problems in Europe, with issues around debt, corruption, and competitiveness coming to the forefront.
4) Climate change, where political will is growing due to public concern, and major investment is expected in renewable energy alternatives.
5) African economic growth, with the continent attracting serious investment and forecast as the third
The document provides instructions for writing a 500 word essay, outlining a 5 step process: creating an account, completing an order form to request a paper, reviewing writer bids and selecting one, reviewing and authorizing payment for the completed paper, and having the option to request revisions to ensure satisfaction. The steps describe the process for requesting and receiving a custom written paper through the writing service described on the site HelpWriting.net.
The document provides instructions for writing a 500 word essay, outlining a 5 step process: creating an account, completing an order form to request a paper, reviewing writer bids and selecting one, reviewing and authorizing payment for the completed paper, and having the option to request revisions to ensure satisfaction. The process is described to help students obtain high-quality original content writing assistance through this service.
Chris Gurnee • Foresters Equity Services Inc.
- 85,000 on the Dow: Pipedream or realistic possibility? Book review by David Wismer
- European stocks continue on torrid pace
- Risk on, until it isn’t by Jeanette Schwarz Young
- Managing 403(b) referrals in a tight-knit academic setting (Johnathon Davis, Retirement Tax Advisory Group)
1. Economic Briefing Q4 2009
2 December 2009
alternative investments in the world’s fastest growing markets
2009
The Cheshire Cat
“Cheshire Puss,” Alice began,
“Would you tell me, please, which way I
ought to go from here?”
“That depends a good deal on where you
want to get to”, said the Cat.
“I don’t much care where –” said Alice.
“Then it doesn’t matter which way you
go”, said the Cat.
Roman Scott
Managing Director
Calamander Capital
Economic Spokesman
British Chamber of Commerce Singapore
Issue XI
25 November 2009
Q4 2009 Economic Briefing
British Chamber of Commerce Singapore
2. Q4 2009 Economic Briefing
_____________________________________________________________________________________________
Calamander Capital
London and Singapore, 25 Nov 2009
The Cheshire Cat
I have just returned from a short trip to London, which coincided with the time I had to prepare my year
end ‘Economic Briefing’. This seemed apt, having ended the April 2009 Q1 Briefing with a gloomy
prognosis for the UK economy. Several months of increasingly poor economic data since then had only
reinforced my conviction Britain was in trouble, and recovery a long way off. I confess I expected
widespread signs of economic distress-shuttered shops, ‘sale’ signs on every corner, empty restaurants
and un-crowded streets; under grey skies and Britain’s perpetual winter drizzle. The perfect backdrop to
write my brand of gloomy economics, with a mug of Tetley tea and The Smiths playing in the
background.
The reality was shocking. Everything appeared exactly as I left it on my prior visit in August 2008, before
the collapse of Lehman. The Tube was still jammed with people from all corners of the world, Regent
Street was thronged with shoppers, and it was business as usual at every office we visited. My sister
treated me to the theatre-it was packed. ‘I thought there is a recession on?’ I said to the maitre d’ when
a meeting at Claridges turned into a long wait for a table at the lobby café. ‘Not at Claridges’ was his
sniffy reply.
I felt like I had accidently hopped into the ‘Back to the Future’ DeLorean. London appeared more
concerned about a phenomenon dubbed ‘Jedward’, seventeen year old twins who had made it into the
finals of a reality TV talent contest called the X-factor, the British ‘American Idol’. The twins couldn’t
sing, couldn’t dance, and sported a ridiculous hairstyle that looked as if they had just received a 5,000
volt shock, and yet somehow they kept on going regardless. A perfect proxy for the UK economy.
25 November 2009 2
3. Q4 2009 Economic Briefing
_____________________________________________________________________________________________
Figure I: ‘Jedward’: Recession chic in Britain.
Source: Mirror.co.uk
Markets versus Economics
So much for the ‘The Great Recession’. And therein lies the paradox. The global economy has been
through the biggest contraction in economic and trade activity, asset prices, and banking system credit
worthiness for seventy years. Normal market mechanisms vital to the proper functioning of the banking
system that are trust and confidence based, such as interbank lending and short term credit markets,
completely froze. Only prompt and massive central bank intervention prevented the potential
catastrophic collapse of the financial system in the West. Yet if you had just arrived today on earth and
landed in London, or Singapore, you would not have guessed anything was amiss.
Anyone who has forgotten just how close we came to economic Armageddon were reminded last week
by the stunning admission by the Bank of England that The Royal Bank of Scotland and HBOS, two of
Britain’s largest banks, had come so close to collapse the BOE had extended over 60 billion pounds of
emergency liquidity in a covert ‘lender of last resort’ operation last October, and kept it secret until
now. Most economic forecasters saw a long and difficult recovery given the extent of the contraction
and the fact that banking systemic crises invariably lead to deeper and longer recessions, a position I
have argued repeatedly in previous briefings.
That is not what the asset markets have been saying. Since April all major stock indices have smashed
records, well beyond the expected recession recovery bounce. Some market strategists have announced
25 November 2009 3
4. Q4 2009 Economic Briefing
_____________________________________________________________________________________________
the being of a new bull market cycle. And, perversely, every other asset class from the ultra
conservative (US treasuries) to the risky (emerging market equities, commodities, gold, art) have joined
in the frenzied recovery.
How does this relate to my views in the Q1 Briefing? Like many, I have been surprised by the markets.
Although I stated that investors were right to be more confident at the time, I remained cautious about
investing, and I did not forecast the speed or the strength in recovery of asset prices. Post summer I
have been firmly bearish, waiting for a correction that never seems to happen.
I had good news and bad news in the Q1 Briefing. Good that depression had been averted and recovery
seemed assured; bad that this recovery would be a long slow haul and most ‘green shoots’ looked
vulnerable. Was this correct? The gist of my argument was that the extent of policy action (both fiscal
and monetary) and its co-ordination globally was unprecedented, and would work given its size relative
to GDP combined with aggressive monetary easing. It would however leave a damaging legacy by
replacing private demand with debt driven public stimulus. Demand contraction in the G3 would
continue for some time; recovery was in corporate profitability and not in more important consumption;
US consumers were saving not spending; global recovery would require first and foremost the US to
stabilize and grow again; China or Asia would not ‘save the world’ as export dependency still
underpinned most BRIC economies; the damage from unemployment would continue; global trade
remained sick; and the cleanup of the banking system was only half complete, restricting the normal
flow of credit mature economies require. Not exactly a picture of robust health at that time.
Unfortunately I believe the majority of economic data from the G-7 (rich) countries year to date
continues to support this position. So what explains the extraordinary rise in asset prices? Is this
performance based on firm economic foundations and set to continue, or are the bears correct and the
risks to the downside?
The Real Economy
Core economic indicators: Although the US and major EU economies have returned to positive growth
(Q3 q-o-q for the US 2.8%, EU 0.2%, Germany 0.3%, France 0.3%), it’s a case of crawling not walking.
Consumption and retail sales remain muted (October retail sales +1.4% in the US and -0.2% in the EU for
September), with a backdrop of appalling levels of unemployment-over 10% in the US and close to that
in the EU. The US figures have been flattered by stimulus measures including cash rebates and the ‘cash
for clunkers’ boost to auto sales. Consumer confidence remains negative in the G2, severely so in the
EU.
25 November 2009 4
5. Q4 2009 Economic Briefing
_____________________________________________________________________________________________
Figure II: US economy core indicators.
Housing, one of my key US indicators because the housing related economic ‘eco-system’ accounts for
about 30% of GDP, remains in the doghouse. A brief summer recovery died in the autumn. Housing
starts are back to 45,000 a month, compared to my long run average measure (from 1963) of 129,000. I
cannot find any silver lining in that very dark cloud. Worse, signs of deflation appeared in the US in
September for consumer prices (-0.2%). Both the US and the EU are only just keeping their heads above
water for consumer prices (US: +0.3%, EU: +0.2% in October). Trade and industrial activity is only now
starting to recover in the EU (manufacturing +2.8% September m-o-m), and in the US (+6.0% October m-
o-m), after a very poor summer. The EU data appears worse, partly because it entered the recession
later, and because corporate earnings have not been boosted by severe cost cutting as in the US.
Finally, for all the low interest rates, bank credit is still contracting in the US and the EU G2 economies.
The pile of toxic collateralized mortgage paper remains on bank’s balance sheets, impairing the
extension of new credit. Bankers remain cautious, a well established post financial crisis reaction, as
credit officers regain power over salesman and want to ensure they don’t make mistakes.
25 November 2009 5
6. Q4 2009 Economic Briefing
_____________________________________________________________________________________________
Figure III: EU economy core indicators.
Retail sales: My view remains unchanged that real global recovery requires US consumption to return.
Even more so for us in Asia-I still think Asian ‘decoupling’ is nonsense at this stage, a reality for 2030
mistakenly applied to today. US corporations can, and have, flattered the earnings reports this season
by comparison with a very low base as the year view moves into October 2008’s collapse, and are seeing
the benefits of severe cost cutting. But corporate profits are not the key driver for a developed
consumer economy, they simply make stockholders happy. It is overall consumption, retail sales and
employment that are the real drivers of recovery. Retail shops, and their sales figures, are the frontline
of the battle. Here there is some way to go (see Figure IV-V below).
25 November 2009 6
7. Q4 2009 Economic Briefing
_____________________________________________________________________________________________
Figure IV: US key retailer’s revenues 1999 - 2009.
The majority of the US stalwarts-Home Depot, Macy’s, Safeway, JC Penney, Neiman Marcus, and Target-
are only now seeing sales stabilize after twelve month declines averaging over 20% (with a range from -
6% to -80%). The same applies to my European sample. As expected, home related stuff has plummeted
(The US’s Home Depot). Luxury discretionary purchases have been hit hard, represented in our data by
the EU’s LVMH (luxury clothes, watches and liquor) and the US’s Limited Brands (lingerie, beauty
products, accessories with Victoria’s Secret, Bath & Body Works, and LaSenza). Only Wal-Mart has done
well and, in Europe, IKEA. Cheap wins when times are hard, although surprisingly MacDonald’s has not,
and expensive M&S in the UK has held up.
25 November 2009 7
8. Q4 2009 Economic Briefing
_____________________________________________________________________________________________
Figure V: EU key retailers revenues 1999 - 2009.
Poor consumption contrasts with the positive noises coming out on the economy as a whole. This is the
‘wealth effect’ kicking in-a sense of caution and a reduction in economic activity by consumers because
their reference point for the value of their household balance sheet is the value of their home. This has
declined markedly in the US and in house price bubble markets in the EU (UK, Spain, Ireland etc). Add in
employment concerns and wallets stay closed. The return of high oil prices also helps ensure that
recovery will remain muted. Energy prices act like a tax for consumers, so the brief collapse in prices
early in the year functioned like a cash return for crisis stricken households that almost matched the
government’s stimulus. That is now gone forever. So despite consumers hearing that the recovery has
started, they feel they are poorer and are more insecure. Perhaps G2 consumers, like the Japanese for
the past two decades, sense that their future liabilities (in the form of government debt) have risen also.
Household debt: US and some EU household debt levels remain high, and consumers are deleveraging.
At debt levels of 129% of post tax household income for the US they have to. The UK continues to hold
the shocking record of 163% for the same. As consumers spend less, they are saving more to rebuild
their balance sheets. Savings levels jumped up to over 5% in the US, are now down to 4.7%, but show all
indications that Americans are starting to save again. They need a minimum of savings level of 5-7%
going forward to restore health.
25 November 2009 8
9. Q4 2009 Economic Briefing
_____________________________________________________________________________________________
Autos: My other favourite measure for G3 consumption is auto sales. It is the ultimate consumer high
end spend, desirable but discretionary for replacements. A five year old vehicle can always be run for
several more years. Headline data again has been misleading here. Monthly auto sales are a closely
watched indicator and I believe the market gets lost in the latest month on month (m-o-m). The big
picture is lost. Hence all the positive noises about the demand boost from Government stimulus via the
‘cash for clunkers’ scheme applied in the US, UK, Germany and other G7 countries. Summer autos sales
in the US climbed from the sub 10 million level (annualized) they had been at in the first half to 14
million units, feeling like the good old days. The market recognized that a relapse was likely, and indeed
US sales have returned to just over 10 million.
But it would be wrong to think the 14 million units of stimulated demand was a good result. The long
run trend data gives a stable US market trend range of 17 million (range 17.0-17.8) units per year for a
decade, up to 2006. The first time this dipped below 17 million units was in 2007 (16.5 million). What
this means is that the US auto industry is likely built for an 18-20 million capacity. If 14 million was the
best a major stimulus could do, that’s disappointing. If 10 million cars is the new normal for the US, it
means an industry at 50% of capacity, a disaster. Let’s say the industry recovers to 12-13 million, that’s
still at 60-65% capacity and no end to the misery than has already virtually bankrupted Chrysler and
General Motors. Carlos Ghosn (CEO of Renault/Nissan) summed up the auto industry prospects perfectly
answering a question on the prospects of a ‘double-dip’ recession: “I don’t believe in a double dip
because we didn’t come up" in the first place. Quite.
Figure VI: Auto sales in key global markets, ten year trend 1999 - 2009.
25 November 2009 9
10. Q4 2009 Economic Briefing
_____________________________________________________________________________________________
Banks: Finally there remain the banks, where the GFC started. I will not revisit the toxic asset issue and
the efficacy of the bank rescue plans, having covered that in detail in the previous briefing, other than to
remind readers that the toxic assets remain toxic, the drag effect on bank balance sheets and thus on
fresh lending remains, and that despite the huge recapitalization efforts the G2 banking system remains
fragile. This also means that the financial sector will not rebuild its employment base that fast,
suppressing services employment growth; neither will its tax contribution rise to former levels for some
time. That’s a further drag on the US and UK economies in particular, which built an unhealthy
dependent on finance in New York and London for both taxes and white collar jobs. Neither financial
centre has a ready replacement for either the taxes or jobs lost.
What I do want to highlight is the next problem- the consumer, and commercial real estate. Given the
GFC has moved beyond its financial crisis roots and taken down the consumer, banks with large books of
consumer loans, auto and credit cards loans are in the frontline for the next wave of rising defaults.
Historically, consumer loan defaults have followed unemployment closely, and given the dire
unemployment situation that’s a worry. The largest US banks most at risk here are Bank of America, JP
Morgan (having acquired Washington Mutual’s large consumer portfolio), and Citibank (see Figure VII);
but of course there are many more smaller banks as exposed. Most UK banks are heavily exposed to the
consumer. I have not looked at Spain and Ireland, but I would assume the same. In addition,
commercial real estate is only now beginning to suffer, as debt is rolled over and landlords face
problems with severe drops in yields and occupancy.
25 November 2009 10
11. Q4 2009 Economic Briefing
_____________________________________________________________________________________________
Figure VII: US major banks, Q3 2009 net income and composition of loan book.
In conclusion, our tour of core economic indicators in the G3 economies does little to support the
extraordinary performance of the markets and continued optimism. The GFC was not just a bad dream.
Signs are that recovery will indeed be slow and painful. Yes, emerging markets and the broader G-20
base looks healthier, particularly in the BRIC countries, but their overall impact on world growth remains
limited by export dependency on the G3.
Given the data hasn’t improved much, neither has my cautious view. The world really is not that much
more of a better place, as an economy, than it was in April. But events since April have proven it is
possible to have asset prices rise, whilst economic activity declines. This is the real ‘decoupling’. The
core question is why, which gets us to whether this is healthy, and whether this is sustainable. Such a
divergence from underlying fundamentals usually signals price bubbles, particularly when the
fundamentals are so weak, and the range of assets so uncorrelated.
25 November 2009 11
12. Q4 2009 Economic Briefing
_____________________________________________________________________________________________
The Unreal Asset Markets
Given the collapse of investment confidence only a short while back, one would expect investors would
return to low risk assets when they finally let go of their cash positions. Perversely, the riskiest assets
have performed the best, a correctly labeled ‘dash for trash’ from early summer onwards. Punters didn’t
seem to find my previous jokes about buying Citibank funny-they actually went and bought it-along with
every other technically insolvent bank. Risky emerging markets equities have almost doubled, along with
everything else.
Bonds: That’s not to say low risk assets haven’t done well. The US treasury market has attracted large
flows-80 billion USD from US retail investors alone this year. Just as well, given the volume of debt the
US has had to issue to fund its stimulus. Despite the bluster about the rising risks of holding the dollar,
foreigners including the Chinese have continued to buy treasuries. Demand has been so strong for the
latest issue of short duration treasuries their yield has turned negative!
Figure VIII: Bond market performance, 2009.
25 November 2009 12
13. Q4 2009 Economic Briefing
_____________________________________________________________________________________________
But investors have also piled into risky bonds, particularly emerging markets sovereigns. The JP Morgan
Emerging Markets Bond Index is up 24% and Indonesia 35%. The VIX, the traders favourite indicator of
equity market volatility and a good proxy for risk aversion, has declined to almost normal levels from the
meltdown status in Q1, signalling a return to risk assets. The risk investors perceive for emerging
markets bonds have dropped to the same level as those of the best blue chips of corporate America (as
measured by the spread or extra yield investors demand for holding riskier bonds over US treasuries-see
Figure IX). The spreads for AAA rated US corporations remain high by historic standards. In 1994 there
were fourteen AAA rated corporations in the US, today there are only four, so investors may have a
point. But to see an emerging market bond priced the same as Exxon or Microsoft makes little sense. I
have used the spread on Indonesian Sovereigns (BB rated), versus US Corporate AAA’s below.
Figure IX: Risky bonds spread to US treasuries, 2009
Investors are saying that they don’t trust the best of the US much anymore, but now view risky
emerging market countries as equivalent or better-countries they used not to be able to place on a map.
The world has changed indeed. If you are looking for signs of a bubble, emerging markets bonds may be
a good place to start (and EM equities a good place to follow).
25 November 2009 13
14. Q4 2009 Economic Briefing
_____________________________________________________________________________________________
Equities have rocketed on the rebound. Again, investors have driven up all markets on the risk spectrum
simultaneously. As with EM bonds, the least liquid and most risky ‘casino’ markets, such as Russia and
China, and tiny new frontier markets such as Sri Lanka, have been bid up the most (see Figure X). For the
emerging equity markets, 50% is the minimum rise. Many are over a 100% up, including Brazil, Russia,
China and Indonesia. Even Citibank stock is up 14% and Barclays 181%.
Figure X: Equity markets performance, 2009.
Flow data indicates that US retail investors, who traditionally buy US equities, are still burnt from the
second major US market meltdown in a decade and have yet to rejoin the new party on the US markets.
The US rally has been driven by institutional investors. Retail US investors, never known for straying too
far from home, have discovered the emerging markets. They have bought over 50 billion dollars of EM
equities this year. If this is a permanent ‘discovery’ of the new ‘new’ world by Americans it will bode well
for EM equities in the future.
25 November 2009 14
15. Q4 2009 Economic Briefing
_____________________________________________________________________________________________
Real assets and commodities, usually an inflation hedge and on the riskier side, have done exceptionally
well. Residential real estate has recovered, with Asian residential surpassing peak prices achieved in late
2007. Gold has reached new peaks, up 40% year to date. Oil (+84%) has recovered strongly. The metals
have rocketed, with Copper (+93%), Aluminum (+32%), and Nickel (+61%) as examples. Agri or soft
commodities have also provided supernormal returns, with Tea (+32%), Coffee (+20%), Sugar (+96%),
Orange (+49%), and Rubber (+58%), as examples. And to remind us economic fundamentals may not be
behind this frenzy, the best performing asset of the year turns out to be Chinese Garlic, which has more
than quadrupled since March. Now you know what you have been missing!
Figure XI: Real assets markets performance – commodities 2009.
The riskiest and most illiquid of markets, the art market, was in cardiac arrest at the beginning of the
year. Both major auction houses were facing major financial difficulties, caught short on price
guarantees they offered in 2007/8. Come the latest New York autumn sales and it’s another ‘recession-
what recession?’ real asset market. Estimates were not just beaten, but often by multiples, capped by a
boom era USD 43.8 million for a Warhol silkscreen appropriately titled ‘200 One Dollar Bills’. That’s one
bill for every 10 billion dollars in fiscal and QE stimulus the US government has spent to keep the US
economy afloat, so that Sotheby’s and Christies could live again.
25 November 2009 15
16. Q4 2009 Economic Briefing
_____________________________________________________________________________________________
The strongest phenomenon here is the return of gold as an asset class. Gold demand for actual use is
dominated by India (as jewellery, especially for marriages). But India has been a net seller this year.
Demand is being driven by investors, not users. Prices are tracking the rise of the physical holdings of
gold bought by exchange traded funds-the easiest way for small investors to enter the market.
Figure XII: Real assets markets performance - real estate, gold and art 2009.
Liquidity Not Fundamentals
Are these market performances justified? I think not. Economic logic has been defied because of
liquidity. A rush of cash to the head can turn around the most depressed of markets, if that cash has
nowhere else to go. Three factors combined for this rush. The first is the ‘cash effect’ of recessions: all
economic actors, be it households, corporate, or banks, freeze spending and hoard cash. The US has
been in technical recession for two years, time enough to build up a considerable cash mountain. It is
what we recommended our chamber of commerce members do last year. Yes, some of this has paid
down debt, but that’s about 10-20% to date. So far, so normal.
25 November 2009 16
17. Q4 2009 Economic Briefing
_____________________________________________________________________________________________
Meanwhile, governments have pushed an extraordinary volume of money through the economy. The
size of this stimulus and its partner in quantitative easing I covered in detail in the April Q1 briefing, but
in essence I estimate it totals the equivalent of 2-3 years of trend rate growth in global GDP. The fiscal
stimulus is over 3 trillion dollars, and quantitative easing the same again-the Fed alone having bought
2.2 trillion dollars of assets. Given the roughly 60 trillion dollar world economy GDP grows about 2.5-3
trillion in a good year, that is some stimulus.
Finally, the most aggressive monetary easing in history made holding cash a fools game, with real
interest rates zero or negative in most OECD countries. All this cash had to go somewhere, and not stay
on deposit. After a period out cold, investors have returned to the markets, any markets, with a
vengeance. This is not a return to fundamentals; this is a return to liquidity, with few alternatives.
Is this a dollar carry trade, i.e. a boom financed by cheap borrowed dollars, as Roubini, the Chinese
leadership and others claim? I think not. There is a difference between a liquidity driven bubble (as
appears to be this case), and a leverage driven bubble. There is little evidence that investors are gearing
up again dramatically. The repo market, where banks lend against securities, remains muted. Cheap
borrowed dollars are not funding the current boom. Cash is.
Investment logic suspended: Liquidity may be driving the asset boom, but it is directionless. Investors
do not know what they are doing. The most risk averse, protective assets (treasuries) are rising at the
same time as the riskiest assets (emerging market equities, commodities). Investors are loading up on
assets that support a benign view of inflation (government bonds) at the same time as they are loading
up on gold-the ultimate inflation hedge. This does not make sense. If you believe inflationary risks are
high and go long gold you should be shorting bonds. I have tested that logic and looked at the
correlation between gold prices and inflation as measured by 3 month US treasury yields over time
(Figure XIII, for those unfamiliar with previous briefings I use 1963 as the base for long time series, a
great year for port).
25 November 2009 17
18. Q4 2009 Economic Briefing
_____________________________________________________________________________________________
Figure XIII: Gold prices versus inflation/US Treasuries 3 month yield, 1963 - 2009.
For most of this period, 36 years, the relationship was pretty strong, with an R-squared (a measure of
correlation) of 53%, i.e. gold rises with inflation, and declines when rates decline. Of note is the strong
rise in gold prices during the 1970’s, exactly matching the hyperinflation of the time. For the past
decade, the relationship has reversed, particularly since the 2007 recession. Gold has risen as inflation
declines, with a negative correlation of -45%. One explanation is gold has risen purely due to risk
aversion and loss of faith in the dollar, but that doesn’t fully match the facts. Investors have also bought
treasuries as a safe haven when risk averse, and if lack of faith in the dollar is the problem why buy
dollar treasuries?
This is a big problem for investment theory, and by default investment advisors. For most of this
century modern investment concepts have been underpinned by two core beliefs. The first is the notion
of efficient, rational markets; and the second is portfolio diversification, with well established patterns
of correlation and non-correlation between defined asset classes. Both suffered a near death experience
after the September 2008 Lehman Crisis, as did the oft recited nonsense of the ‘buy and hold school’ for
equities. Diversification and ‘efficient frontiers’ in asset allocation proved utterly useless, as all assets
classes collapsed in tandem.
25 November 2009 18
19. Q4 2009 Economic Briefing
_____________________________________________________________________________________________
The diversification concept, although logical, remains seriously damaged. What went down together is
rising together. How can this be explained? Else standard investment logic remains suspended, or
investors are confused, uncertain as to which of the competing alternative scenarios-from extreme bear
to charging bull-to chose. In essence, we have stupidity or confusion. Ever hopeful, I believe it’s the
latter. My view is that widespread uncertainty, and the contradictory views of ‘the experts’, has created
large populations of believers in completely contradictory asset strategies. As a result everything-black
or white-that is theoretically uncorrelated has gone up simultaneously. It’s Alice’s Cheshire cat. If you
don’t know where you want to go, any direction will take you there.
Market sustainability: Given this boom has been liquidity driven, asset class neutral, and ignores
fundamentals, is it sustainable? I, like many observers, have been sitting waiting patiently for the
autumn correction. October showed signs of a return to sanity. A few better than estimate earnings
reports, and a G-20 meeting reaffirming governments will keep the stimulus taps on and ultra cheap
money for a good while longer, and the bulls were off again. Investors were looking for an excuse to
keep the party going, and there is enough liquidity in reserve with those US retail investors I mentioned.
Their cash money market funds peaked at 3.8 trillion dollars this year. They have since deployed only
500 billion, leaving 3.3 trillion-a huge sum. This liquidity remains a strong argument for the bulls who
believe the market will be sustained despite being fairly valued. I remain convinced this year has been
an temporary bull period within the longer term US bear market that is now two years old, and will age
for some time. Many such intermediate bulls will come and go. Fundamental economics remain poor,
recovery weak, prospects for an easy monetary exit uncertain, and structural debt and fiscal issues dire.
I will continue to sit firmly on the sidelines with fellow Vulcans waiting for it to end badly, and no doubt
be proven wrong, again. That’s why gloomy economists don’t make any money.
The Great Debate: Inflation vs. Deflation
Keynes would be proud. The world’s policymakers and central bankers have found a new consensus for
government intervention and demand stimulation in the event of a major recessionary drop in demand.
Add in the kind of social welfare and unemployment ‘stabilisers’ invented by the Europeans, and
governments believe they can flatten out the extremes of cyclicality and avoid the damage, much like an
insurance company flattens out investment cycles using reserves for guaranteed policies.
The problem with this model is that public demand steps in to substitute for private demand, and public
debt takes over from private debt. In short, the problem is nationalized for the long term.
The G3 have just done exactly that. This creates two key risks. Firstly, the threat of potential long term
inflation and debt repayment burdens when growth recovers, as governments have to raise interest
rates to ensure demand for public debt is sustained. As soon as private demand returns, private sector
investment and demand for credit returns with it. The sea of government debt has to compete.
Meanwhile, the national currency has been weakened by the deterioration in state finances, damaging
25 November 2009 19
20. Q4 2009 Economic Briefing
_____________________________________________________________________________________________
the attractiveness of their debt to foreigners if they smell a depreciating holding currency. In short,
investors have better things to be buying, and higher rates are the only inducement. This was Britain in
the seventies.
The second risk is the opposite-a market of damaged consumers who shift to saving and reducing credit
rather than spending, creating a deflationary spiral in a world with far too much capacity for just about
everything. The economy stagnates, continuously flirts with deflation, and piles on more public debt as
the state regularly tries another stimulus package to persuade weak consumers to spend. Over time, it
takes more and more public debt to produce less and less GDP growth, with fewer real jobs. Consumers
work out that the public debt is actually their long term liability, and turn even more cautious. The only
hope for limited growth then becomes exports. It is the economic equivalent of permafrost. This was
Japan in the nineties. This remains Japan now, twenty years after its own GFC in 1989.
Both of these scenarios are real risks, hence a lot of the confusion in the markets and in asset buying
patterns. I don’t have the space to go into a discussion of the merits of both arguments. And given the
state of flux in the economy at present, either scenario is plausible. So I will instead focus here on where
my views are at present.
I worry much more about deflation than inflation risks now, and will for at least the next two to three
years. By inflation risks I mean an inflation and dollar crisis, not a gradual, very slow tightening back to a
‘normal’ range of 2-3.5% in the G2 (US and EU), which is to be expected. Whilst inflationary risks are out
there, it will be a medium term problem unless the Fed does something completely stupid with virtually
no tightening at all.
For the deflation scenario, we need only look at Japan. Japan is the best case study for three core issues
now facing the US, and by default the world economy. Firstly, how they handled the banking crisis (or
how not to handle one). Secondly, what happens when you end up with a generation of permanently
damaged consumers, and by extension damaged private demand. Finally, the result of following a
policy of continuous government demand stimulation, paid for by public debt. Could the US turn into
Japan, with a permanent loss of output and a conservative, less active consumer? It’s a scary thought,
but lies at the heart of assessing what form the recovery will take and how long.
I have to admit a bias, in that I worked in Japan for several years, have monitored their economy ever
since, and been un-relentlessly critical and bearish. For the record, Japan remains one of my favourite
countries-great culture, food and aesthetics-just lousy economics and demographics. My second bias
results from working on the wreckage of the Indonesian banking system for six years after their crisis,
and witnessing the level of damage to an economy a bank crisis leaves as legacy. I may therefore be over
gloomy, but the lessons of Japan are still worth heeding.
25 November 2009 20
21. Q4 2009 Economic Briefing
_____________________________________________________________________________________________
Damaged Banks
I have covered this in the last Briefing, to which the reader should refer. In summary, financial crises are
simply bad news. Normal recession recovery patterns don’t apply; a three to five year cycle to return to
trend rate growth is standard; credit extension takes time to return to normal while both banks and
consumers work through bad debts and deleverage; and impaired assets take a long time to clear.
Again, as went Japan, there goes the US, minus the prop of 1990’s Japanese savings.
Rogoff and Reinhart, two Princeton academics, have analysed the past eighteen post war financial crises
in a recent book (‘this time is different: Eight centuries of financial folly’). They come to the same
conclusions I have summarized above. Rogoff and Reinhart suggest if the US conforms to type, it’s going
to be a four year recovery with a long period of persistent unemployment, restrictive credit, and
continued deleveraging by both households and businesses. That is my vote.
The US has also just repeated Japan’s mistake of leaving their banks with most of the toxic assets on
their balance sheets rather than removing them into a state ‘bad bank’ and nationalizing banks if
required–the Indonesian and Korean crisis model I strongly support. The UK also followed the latter
model-Gordon Brown got it right. The half baked re-capitalization of the banks provided by the US is less
effective, because the poison remains in the system. The Japanese did the same on the assumption that
the banks could slowly grow their way out of the problem. Slow became the operative word-over a
decade was required. There are no short cuts via assisted ‘self recovery’ for bank crises. The US missed
the chance to take the pain, put them in an ICU, and temporarily nationalise. The availability of credit,
and thus economic recovery, will suffer as a result.
Damaged Consumers
Japan’s lost decades: I don’t need to repeat the story of Japan’s so-called ‘lost decades’ following their
own asset and investment bubble collapse in 1989. In essence, the economy was left permanently
shrunken, with a huge level of overcapacity and dramatically reduced credit growth, investment, and
consumption. Faced with the huge decline in private demand, the government resorted to endless
rounds of stimulation, each one less effective than the last. The key issue is that consumers have never
been able to pick themselves up again, so public stimulants had to replace private demand.
When Japan did recover, it found that it was a jobless and weak recovery. This is the risk the US faces. A
quick summary of the data (Figure XIV) shows GDP growth has bumped around -0% to +2%, with bouts
of deeper negatives for 20 years. The net growth is zero. Corporate profitability came back, but new job
creation remained weak. As a result, wage growth in Japan has been negative, and unemployment
climbed from nothing to Western levels of over 5% in a decade, where it remains. Land and house
prices, the reference point for a consumer’s net worth, have never recovered. This leads to a strong
negative ‘wealth effect’. Small wonder that consumer spend has been at a standstill, and the economy
has been in and out of deflation ever since (it is currently back in deflation at -2.2%).
25 November 2009 21
22. Q4 2009 Economic Briefing
_____________________________________________________________________________________________
Figure XI: Japan consumer economic indicators, 1989 - 2009.
US employment: If there is one clear single signal that the US may repeat Japan’s pattern of long term
damage to consumption, it’s the employment picture. The current official US unemployment rate,
10.2%, is dire. But this figure grossly underestimates the problem, because the official numbers exclude
many inconvenient truths (those who have given up job seeking, part timers, new entrants to the
workforce etc.). This total un-and under-employed figure for the US is approaching 18%. A ‘jobless
recovery’, as looks likely, would permanently impair an entire segment of the population and thus their
demand. And for those that doubt the potential of a jobless recovery, the US has already proven the
case. The US has lost all the employment gains it made during the decade long boom. It employs fewer
people today than in 1999.
25 November 2009 22
23. Q4 2009 Economic Briefing
_____________________________________________________________________________________________
Figure XV: Total US unemployment, 2009
The last number in Figure XV is of concern: 2.3 million additional new entrants to the job force.
Assuming that rate continues, this means over 10 million extra jobs need to be created for the young
over the next five years. The highest rates of unemployment in the US are the young: 15% for 20-25 year
olds, and close to 28% for 16-19 year olds. Britain and Europe have the same issue, with 20% ‘youth’
unemployment.
A recent article raised the risk of a generation of young scarred by unemployment at the start of their
careers, which leaves a permanent change in attitude and reduced earnings. Again, the case study was
Japan. This group in Japan has ended up more risk averse than their peers, perfectly happy to work for
the government, cautious on spending, and better savers. They stay at home longer with parents,
lowering new household formation. This does not sound like the kind of high tech start-up
entrepreneurs the US and the EU will require for the next wave of growth. Over the next three years at
least 6 million young people will enter the US workforce, at the worst time since the great depression.
Without policy intervention, they risk becoming a lost generation.
Finally, there is one difference to Japan, and it doesn’t help. The US has superior demographics. Faced
with a jobless slow recovery, population growth becomes a disadvantage. The US population is now 300
million, having grown by 30 million since 1999. It is expected to continue to add 2.5 million people a
25 November 2009 23
24. Q4 2009 Economic Briefing
_____________________________________________________________________________________________
year. The EU and Japan can get away with lower growth because their populations are static or
shrinking, but the US needs its trend rate GDP growth of 3% plus to maintain real growth at a household
level.
So unemployment will be the main drag for the US economy, 70% of which is consumption. There will
be no real recovery until employment recovers. This means back to the 5% trend rate at least. Job
creation has to be high enough to not only absorb the unemployed, but take on young new entrants and
a growing population.
Damaged Public Finances and Debt
During 2009 all OECD countries have followed Japan’s post crisis policy set two decades ago-a major
stimulus package, backed up by quantitative easing (printing money by another form), and very easy
money (i.e. interest rates close to zero percent). Clearly the single biggest structural issue for the next
twenty years will be the US government’s debt mountain, which now stands at 85% of GDP, and rising.
This is the price of substituting public demand for private, a pattern repeated in the UK, and to a lesser
extent in the rest of the EU. Remember the EU limit pre crisis was for national debt of 30% of GDP, a
conservative but fiscally responsible figure.
Figure XVI: National debt % of GDP, 2009
25 November 2009 24
25. Q4 2009 Economic Briefing
_____________________________________________________________________________________________
As with Japan, the US cannot but be poorer as a result. The debt will consume much of the public’s
earning power through taxes, and severely constrain public spending and other budgetary needs. This
has to affect consumption, because consumers ultimately have to pay the debt back through taxes. As
goes the US, so go Britain, most EU nations, and others with high national debts burdens.
Is it possible, as Japan has demonstrated, to have national debt climb to a very high level, yet maintain
low interest rates. This enables low yields on that debt (i.e. low interest), and contains inflation.
Japanese debt more than doubled from 60% to over 140% after a decade, and after 20 years has
reached 219%. Yet yields in Japan collapsed and remain below 1% today.
It is questionable whether the US could repeat that feat, or if it is desirable to do so. Japan’s ultra low
interest rates are part of the problem not the solution. Consumer activity suffered such lasting damage,
Japan has been in and out of deflation ever since. Saving not spending is a good and necessary response
for overstretched households for a few years, but if they never get back to the shops and simply save,
the economy never grows again.
Japan’s ability to absorb all those government bonds (JGB’s) depended on a vast pool of domestic
savings kept onshore. Most of these savings are turned over to the state via the largest deposit taking
institution in the world-the Japan Post Office, which simply rolls it into JGB’s. Deposits in private banks
go the same route. US households are rebuilding savings but will never get to the Japanese levels of the
early nineties. And, we hope, they will go back to spending again at some point. That means that the US
will have to go to the international debt markets, as will the UK and other big EU borrowers. This
reliance of foreign buyers of debt will make it a lot harder for yields to stay this low forever, despite my
leaning in the direction of a muted recovery and therefore low inflation pressure for the medium term.
My deflation scenario is good for three years or so. After that, the world will return to worrying about
inflation.
If the US is to avoid Japan’s fate with a permanently high national debt, higher taxes, and lower demand;
or the alternative in a major inflation problem, it will have to pay down debt to a sustainable level. That
means taxes or budget cuts, and likely both. A recent IMF paper on debt sustainability concludes that
the US will have to increase taxes and reduce spending to the tune of 8% of GDP to get national debt
back in the comfort zone of 60% of GDP, a huge hole to be filled in a 14 trillion dollar economy. It is no
accident that this number is close to the level of cumulative lost output from the US economy, given
that the loss has been plugged by the state using debt. But adding further to the tax burden is politically
unpalatable. Given the Healthcare budget has gone up, that means the savings have to be found in the
rest of the budget. The US simply won’t be able to afford what it used to. This will apply to all areas of
public spending, including investment in infrastructure that the country needs, and in military
expenditure and reach. Again, the same issues, and politically difficult budget cuts, will apply to the EU.
25 November 2009 25
26. Q4 2009 Economic Briefing
_____________________________________________________________________________________________
Conclusions
What are the lessons here? The US, and to a lesser extent the EU, still have some serious problems and
need to continue repair-work. For the next three years minimum, I expect a pattern similar to that of
post crisis Japan:
Corporate profitability will return, but new job creation will remain weak.
This means a jobless recovery, with a disenfranchised, unemployed underclass a permanent
fixture, restraining wages.
Several million baby boomer children will demand entry to the job market, but may struggle to
get a solid start to work-life. This will add pressure on jobs and wages.
A growing population will add even more pressure on jobs and wages.
The public sector will take on a much bigger role to make up for reduced private demand and
lack of private sector employment, Japan style.
Wage growth will be restrained, so household balance sheets won’t grow.
Higher taxes and reduced public services will make consumers feel poorer.
Consumers will continue to deleverage and save, for at least another three years, perhaps
permanently.
Credit will not revert to normal for several years, as the banks remain weak and toxic assets
remain on their balance sheets.
A second wave of bank credit defaults will arise in the consumer loan books (especially credit
cards) and commercial real estate.
The decade long trend for decreasing taxes, direct or indirect, will reverse.
Even if consumer price inflation remains benign, the return of energy inflation will function as an
additional tax on the consumer.
Overcapacity will suppress inflation for some time even as demand returns, as it did in Japan
This is the situation before policy risks. If the Fed responds to concerns about unsustainable
asset price bubbles and tightens early, a double dip recession would ensue.
Those who doubt the parallels with Japan are kidding themselves. The US is already a shrinking economy
in terms of its employment base and household wealth, but unlike Japan has a growing population to
share this among.
25 November 2009 26
27. Q4 2009 Economic Briefing
_____________________________________________________________________________________________
It goes without saying that if this paper is correct, the risks are greater for deflationary pressures than
inflation at this stage. When inflation re-emerges, it is likely to be benign. There is still a huge amount of
overcapacity around the world, and that combined with limited or zero growth in average household
income will restrain inflation. Oil remains, as ever, my only consumer price inflation concern. The
inflation hawks are three years early. Asset prices will behave differently of course, and be driven by
liquidity and speculative interest. They are likely to continue to rise, irrespective of economic
fundamentals which argue for a major correction.
What about the argument that Asia will save the world? It is true that the GFC has accelerated the
relative decline of the US. What was to have been a thirty year rise to global dominance by Asia will now
be done in twenty. But in 2009 we all remain dependent on the health of the fourteen trillion dollar US
economy, Asia more so than ever; and we will do so for some time yet. Asia remains export dependent,
principally on the US and EU. As I have mentioned before, no one else is ready to replace the US
consumer yet: the Europeans will not, the Japanese cannot, and the Chinese don’t know how yet.
For both the US and Asia, a slightly shrinking US has advantages. US households need to restore the
health of their balance sheets by consuming less, paying down debt, and restoring a savings rate of at
least 5-7%. Reduced demand from US consumers is the only way the Asian export driven economic
model will be forced into accelerating self sustaining domestic demand. This requires building up the
social safety nets Asian consumers require to persuade them to relax a little. Only then will they save
less, and spend more.
Will this be a permanent ‘Japan lost decade’ for the US? Fortunately, I don’t think so. Rumours of the
death of the US economic model and the dollar are greatly exaggerated. The austerity period will be
longer and more painful than many imagine, which is what I have tried to convey in this paper. But the
structural strengths of the US economy-its openness, dynamism, availability of finance, and above all
innovation and entrepreneurial risk taking will ensure its resurgence after three to five years of serious
and necessary repairs. The US has a remarkable ability to dig huge holes for itself, and then climb out
again. They then repeat the process, on a seven to ten year cycle in my view, but that’s another story.
25 November 2009 27
29. Q4 2009 Economic Briefing
_____________________________________________________________________________________________
his p
25 November 2009 29
www.calamandergroup.com