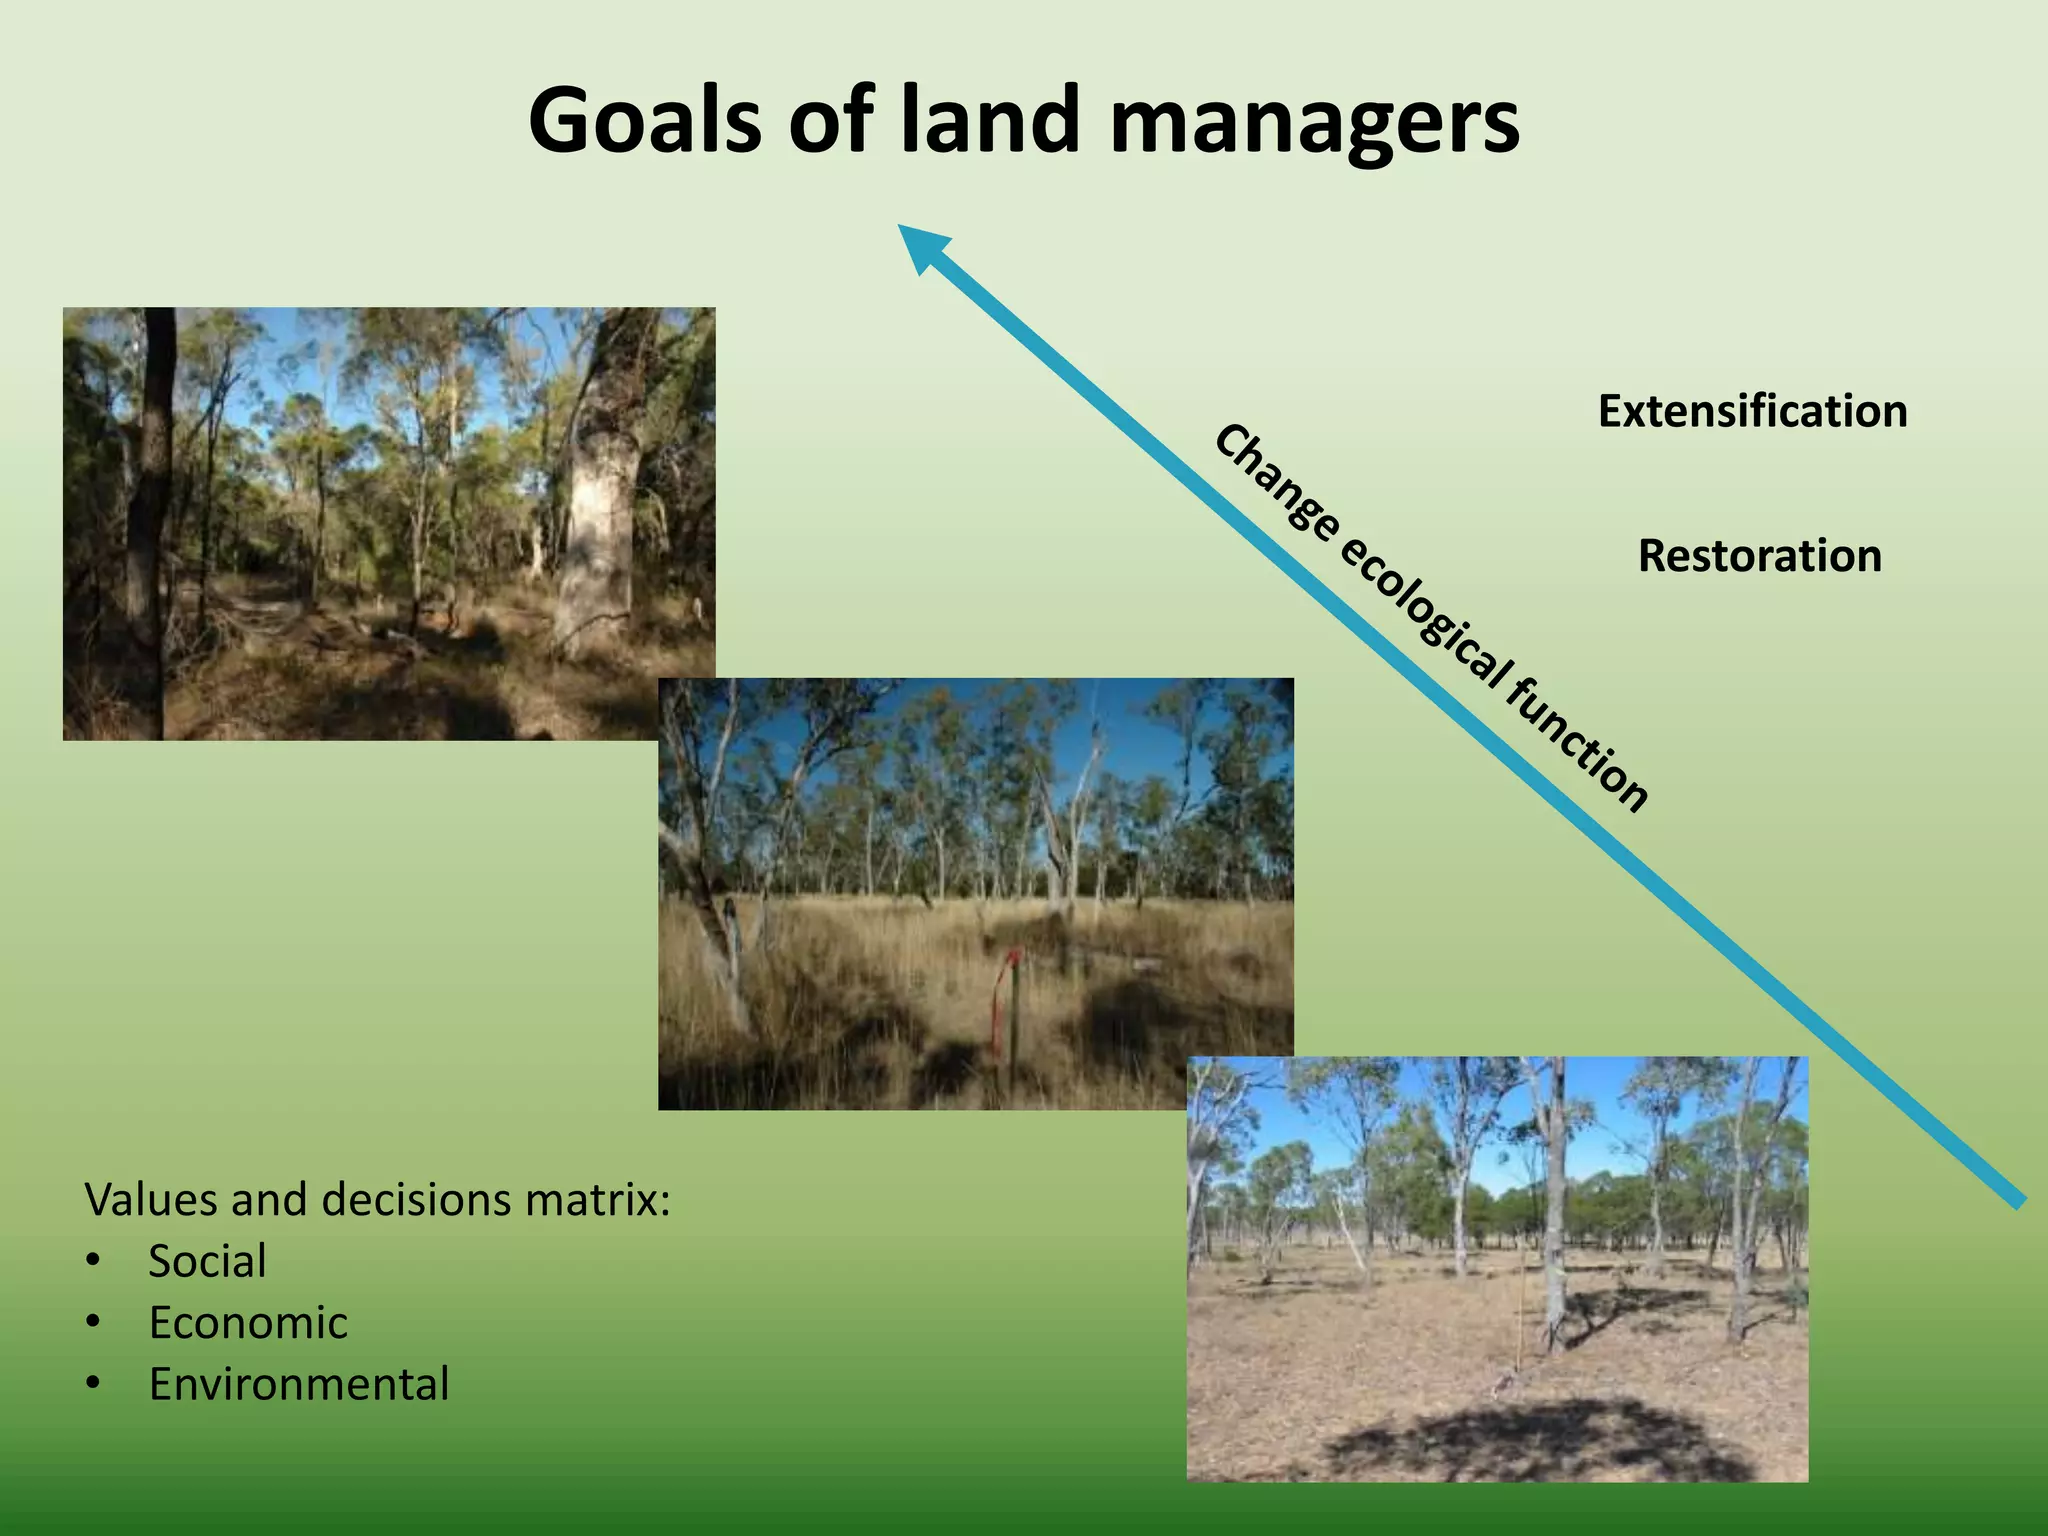
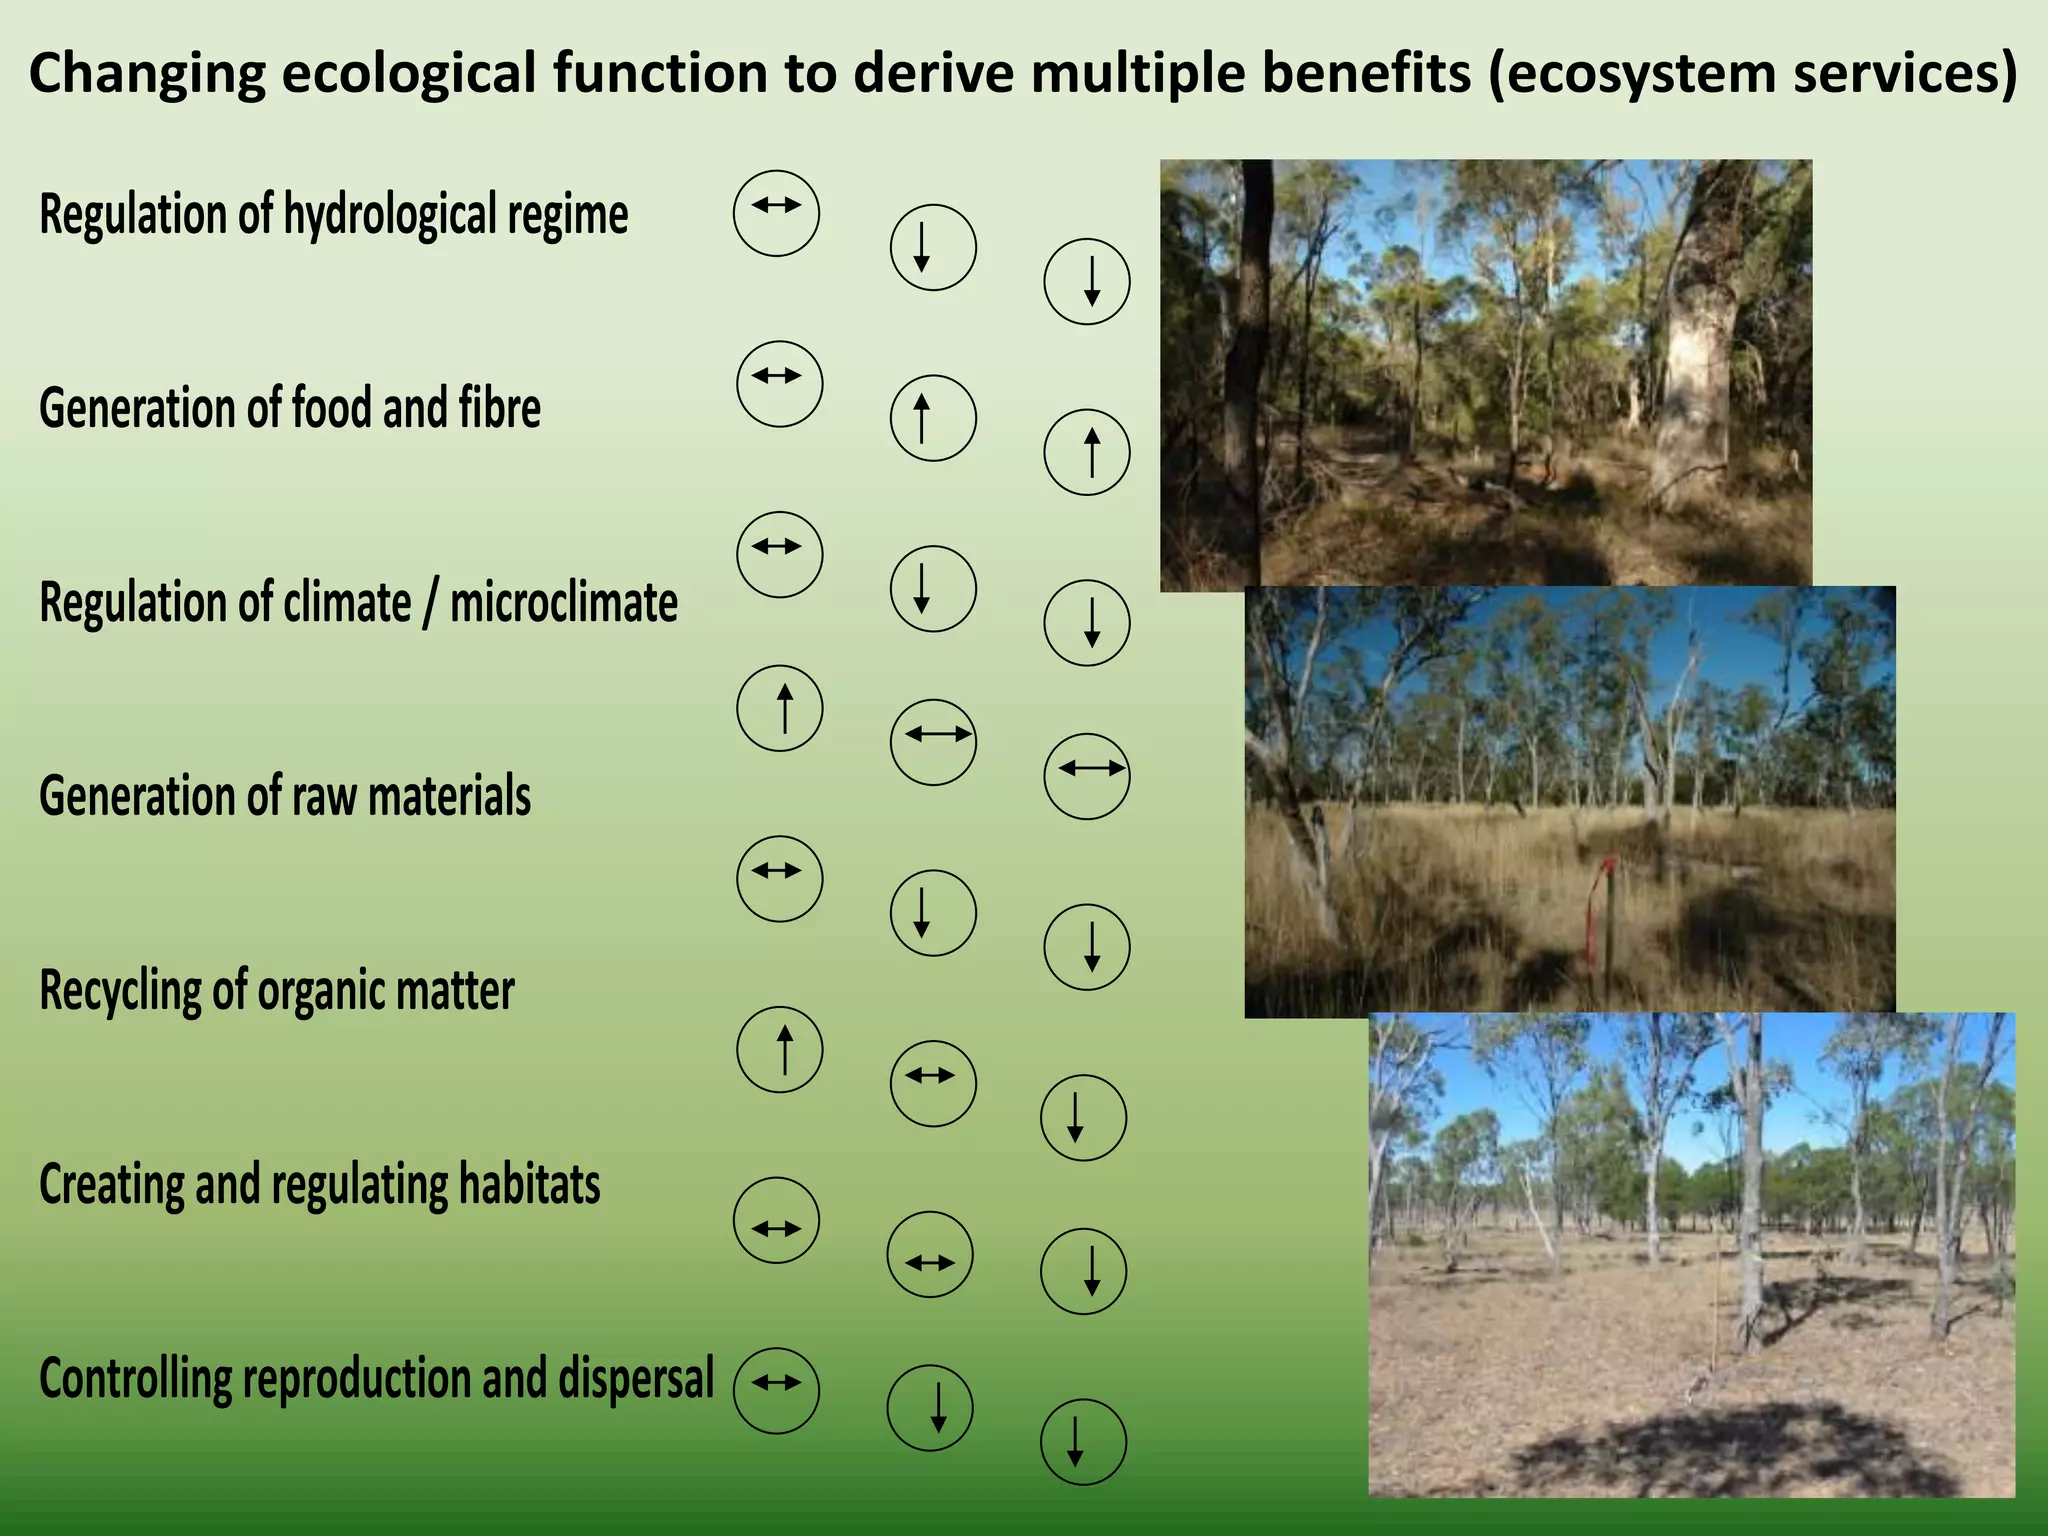
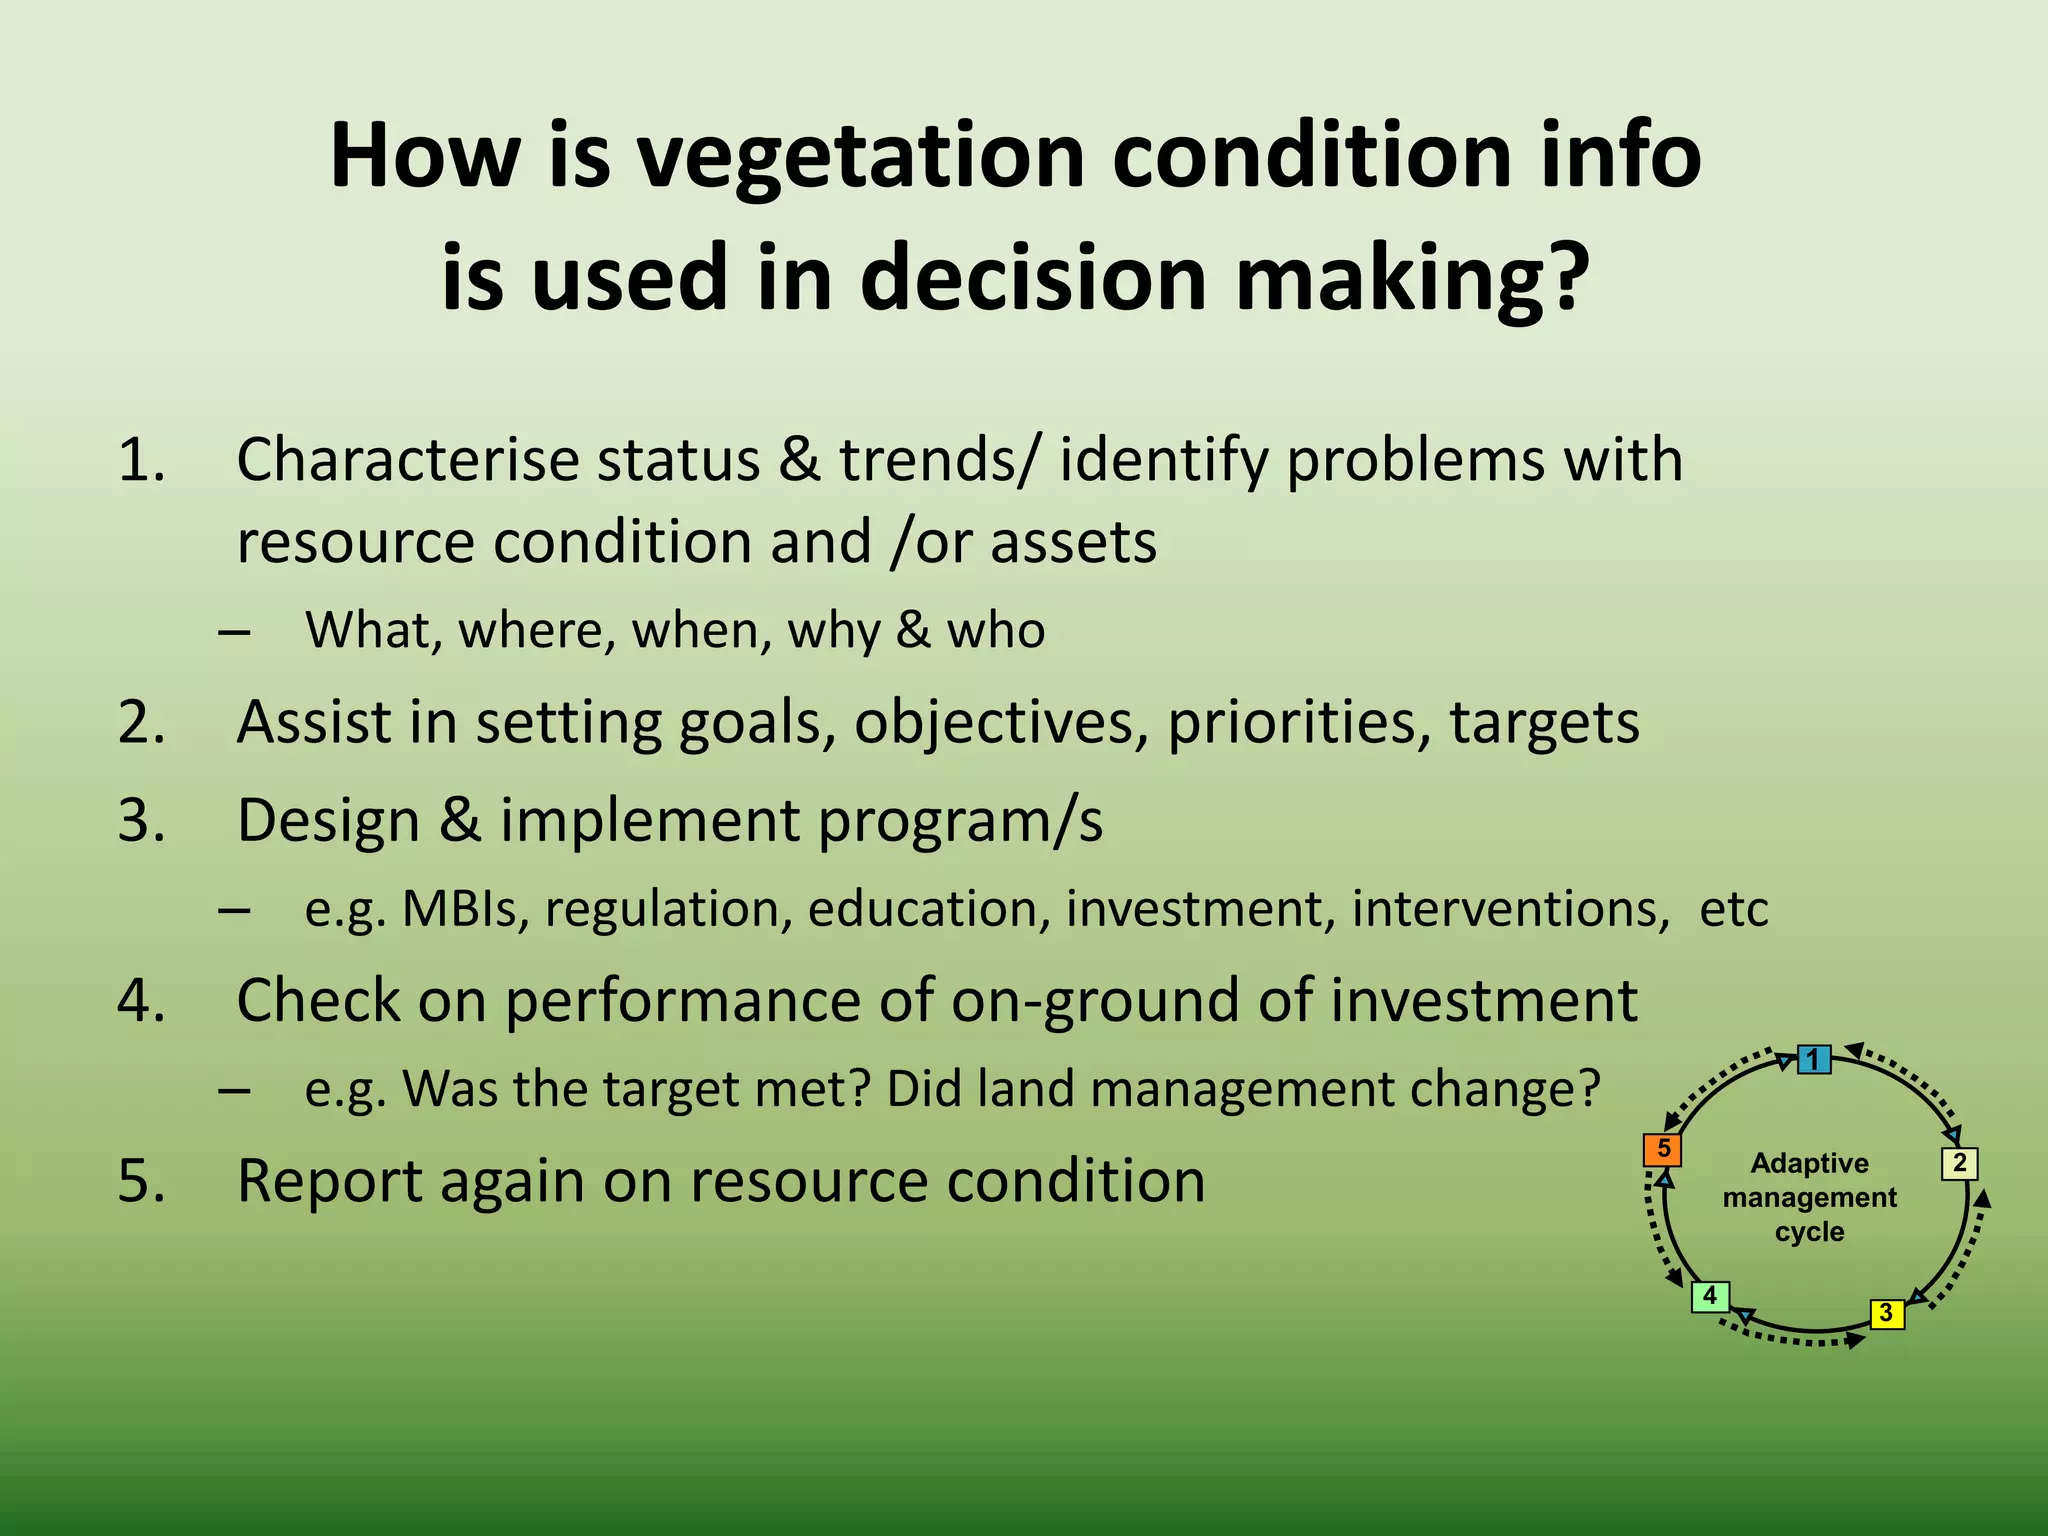
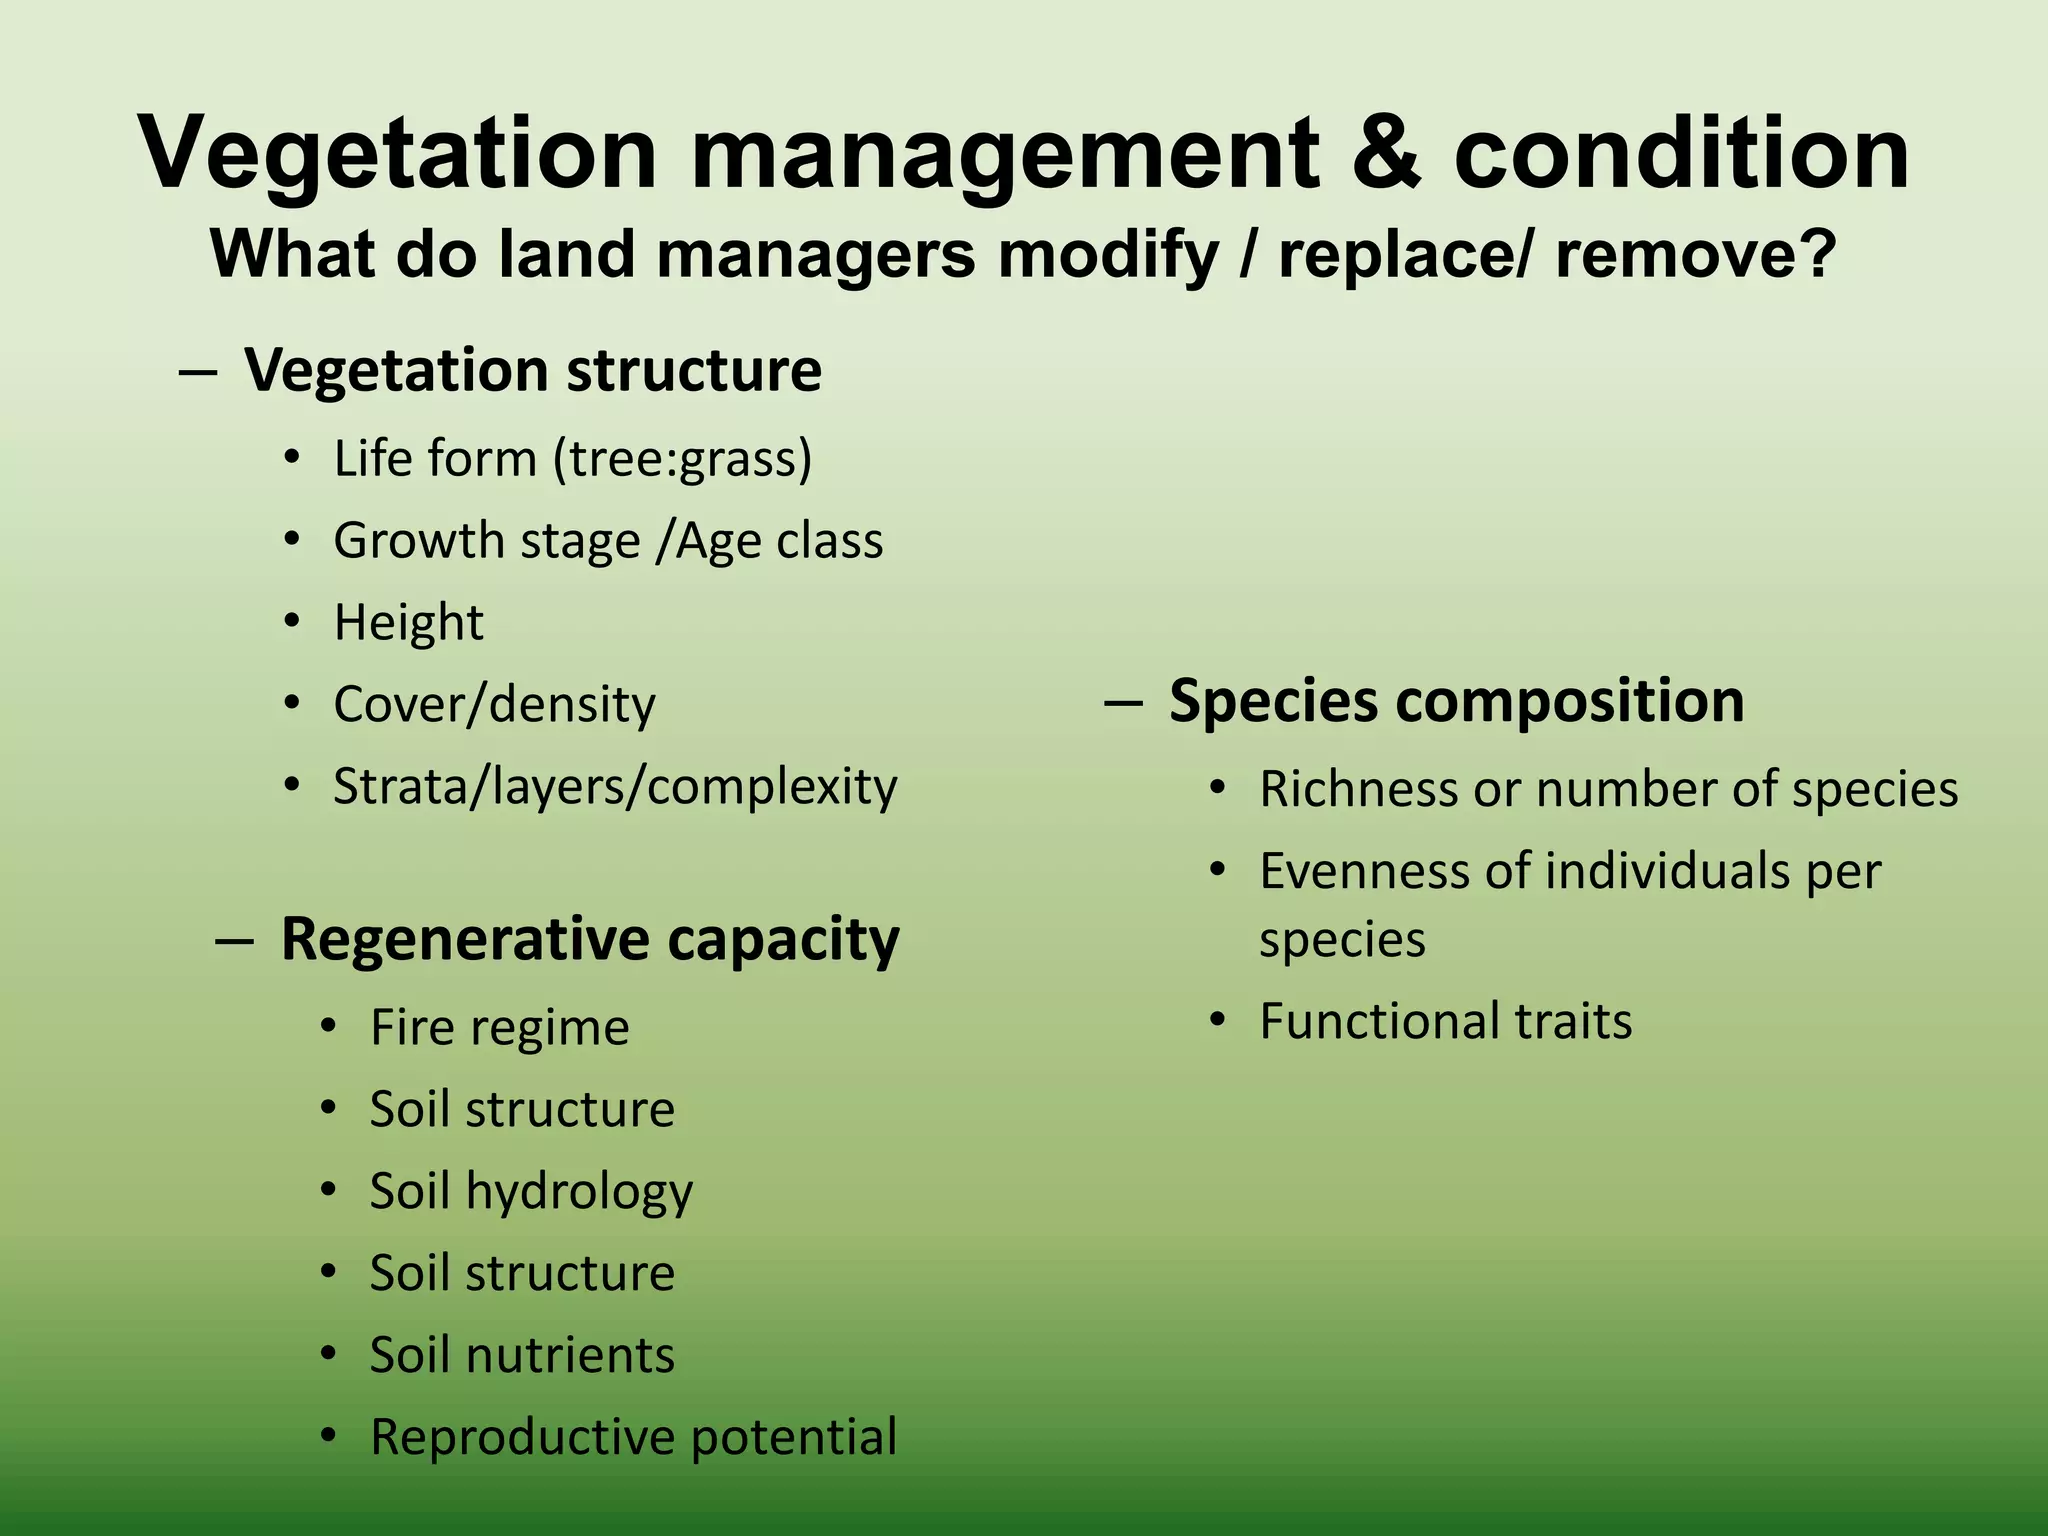
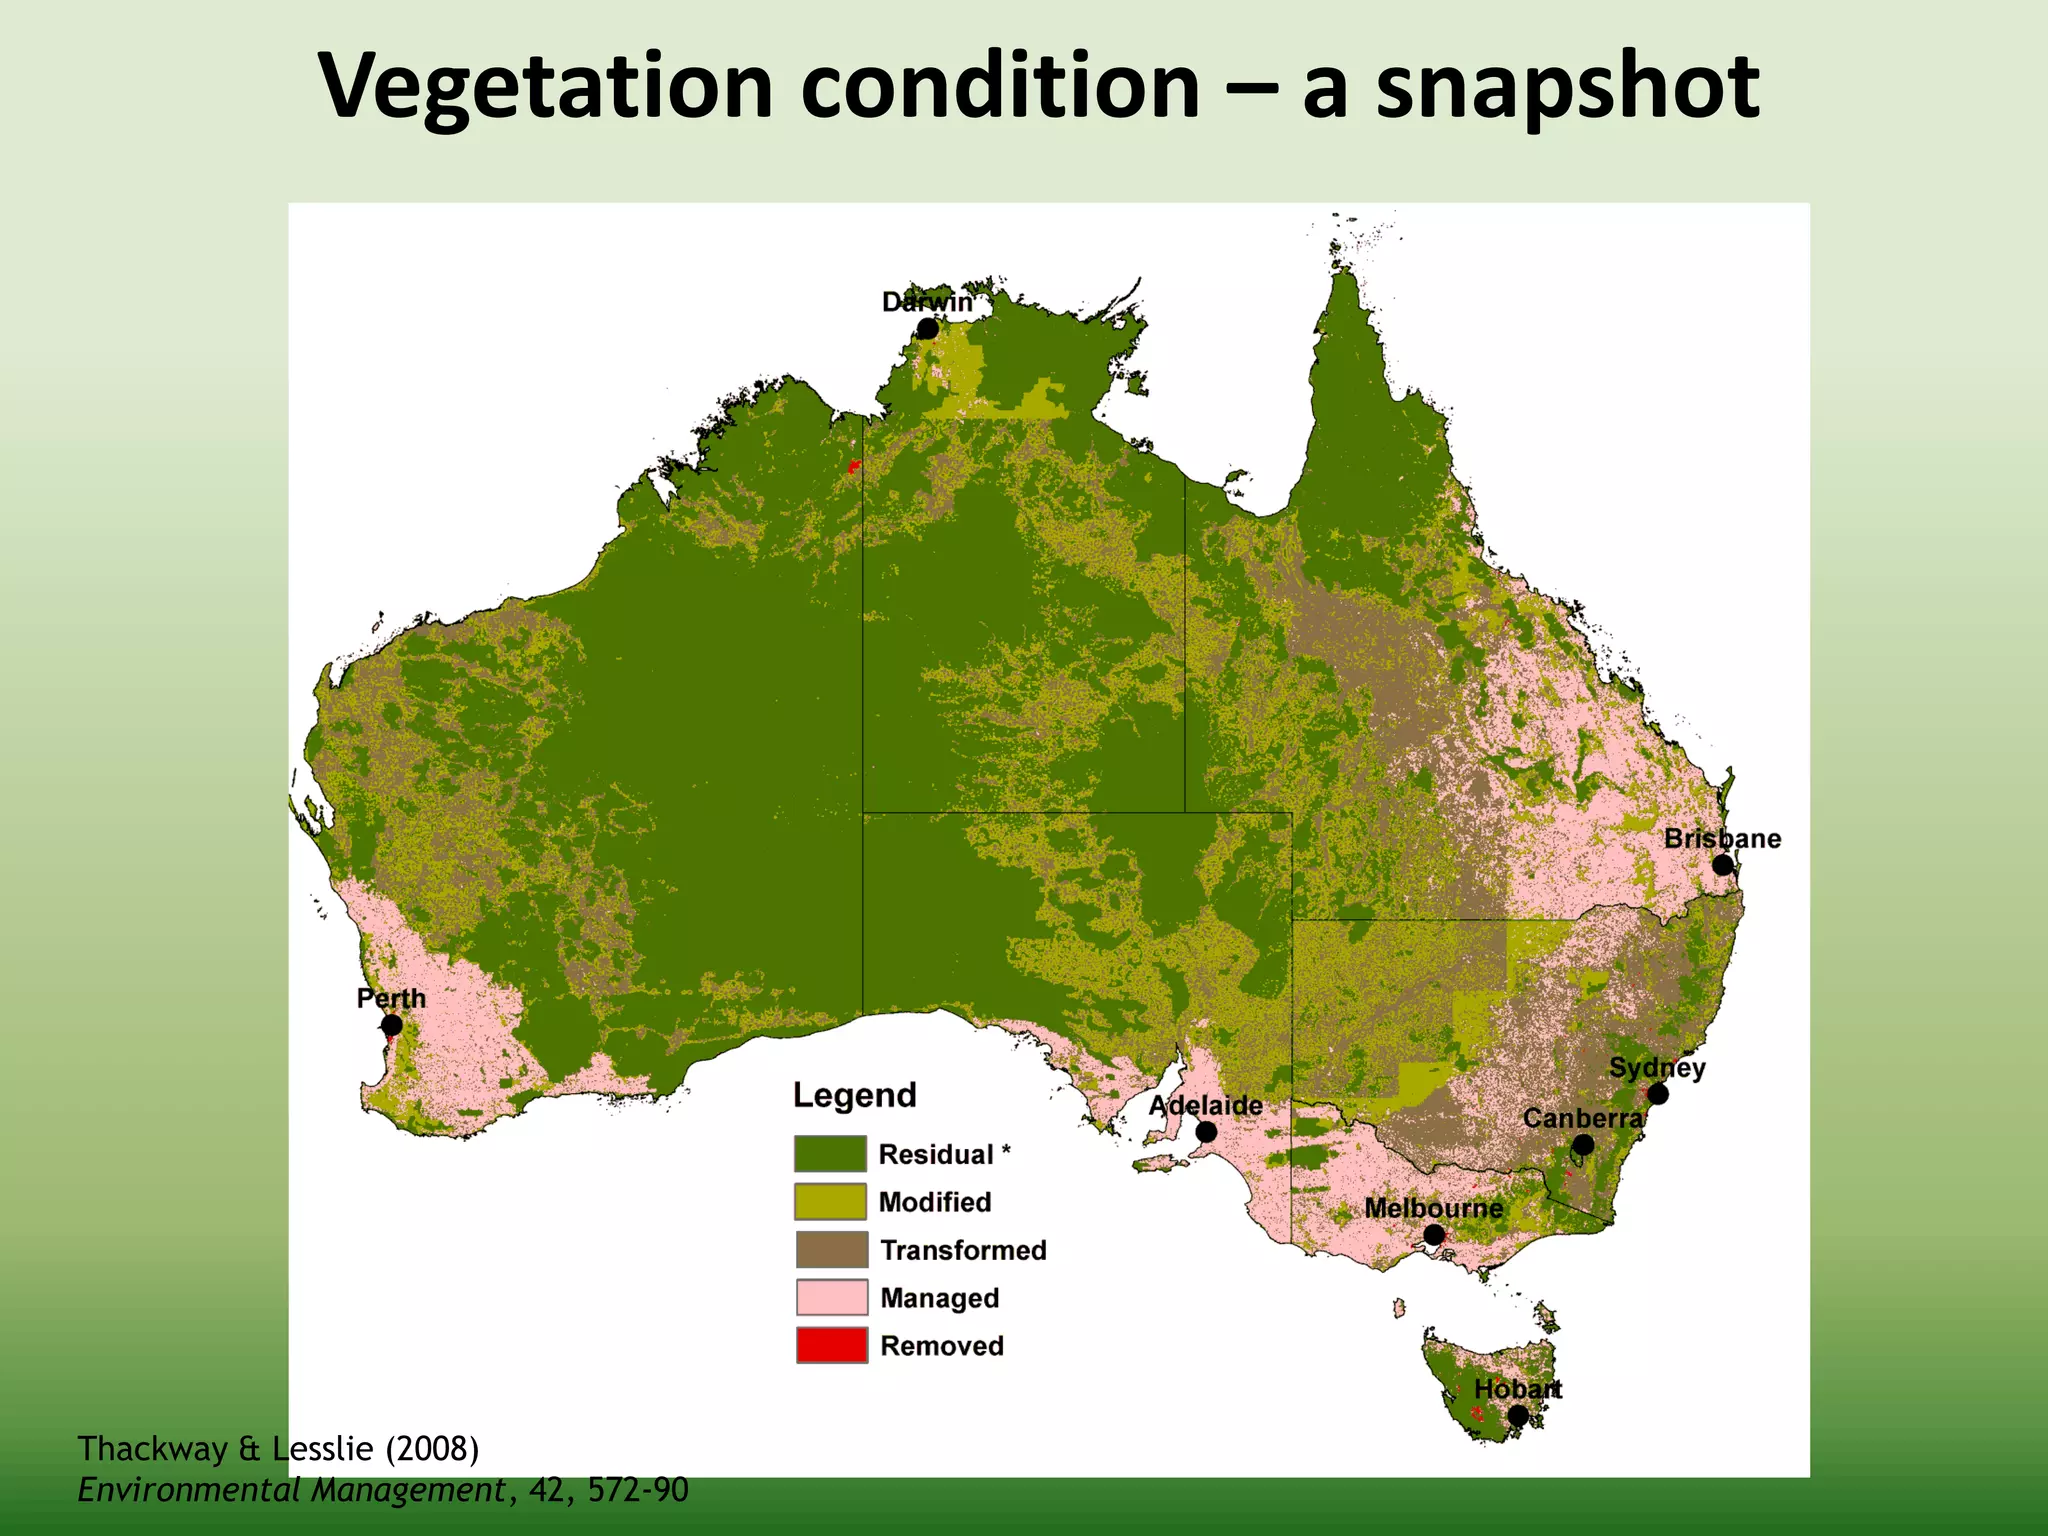
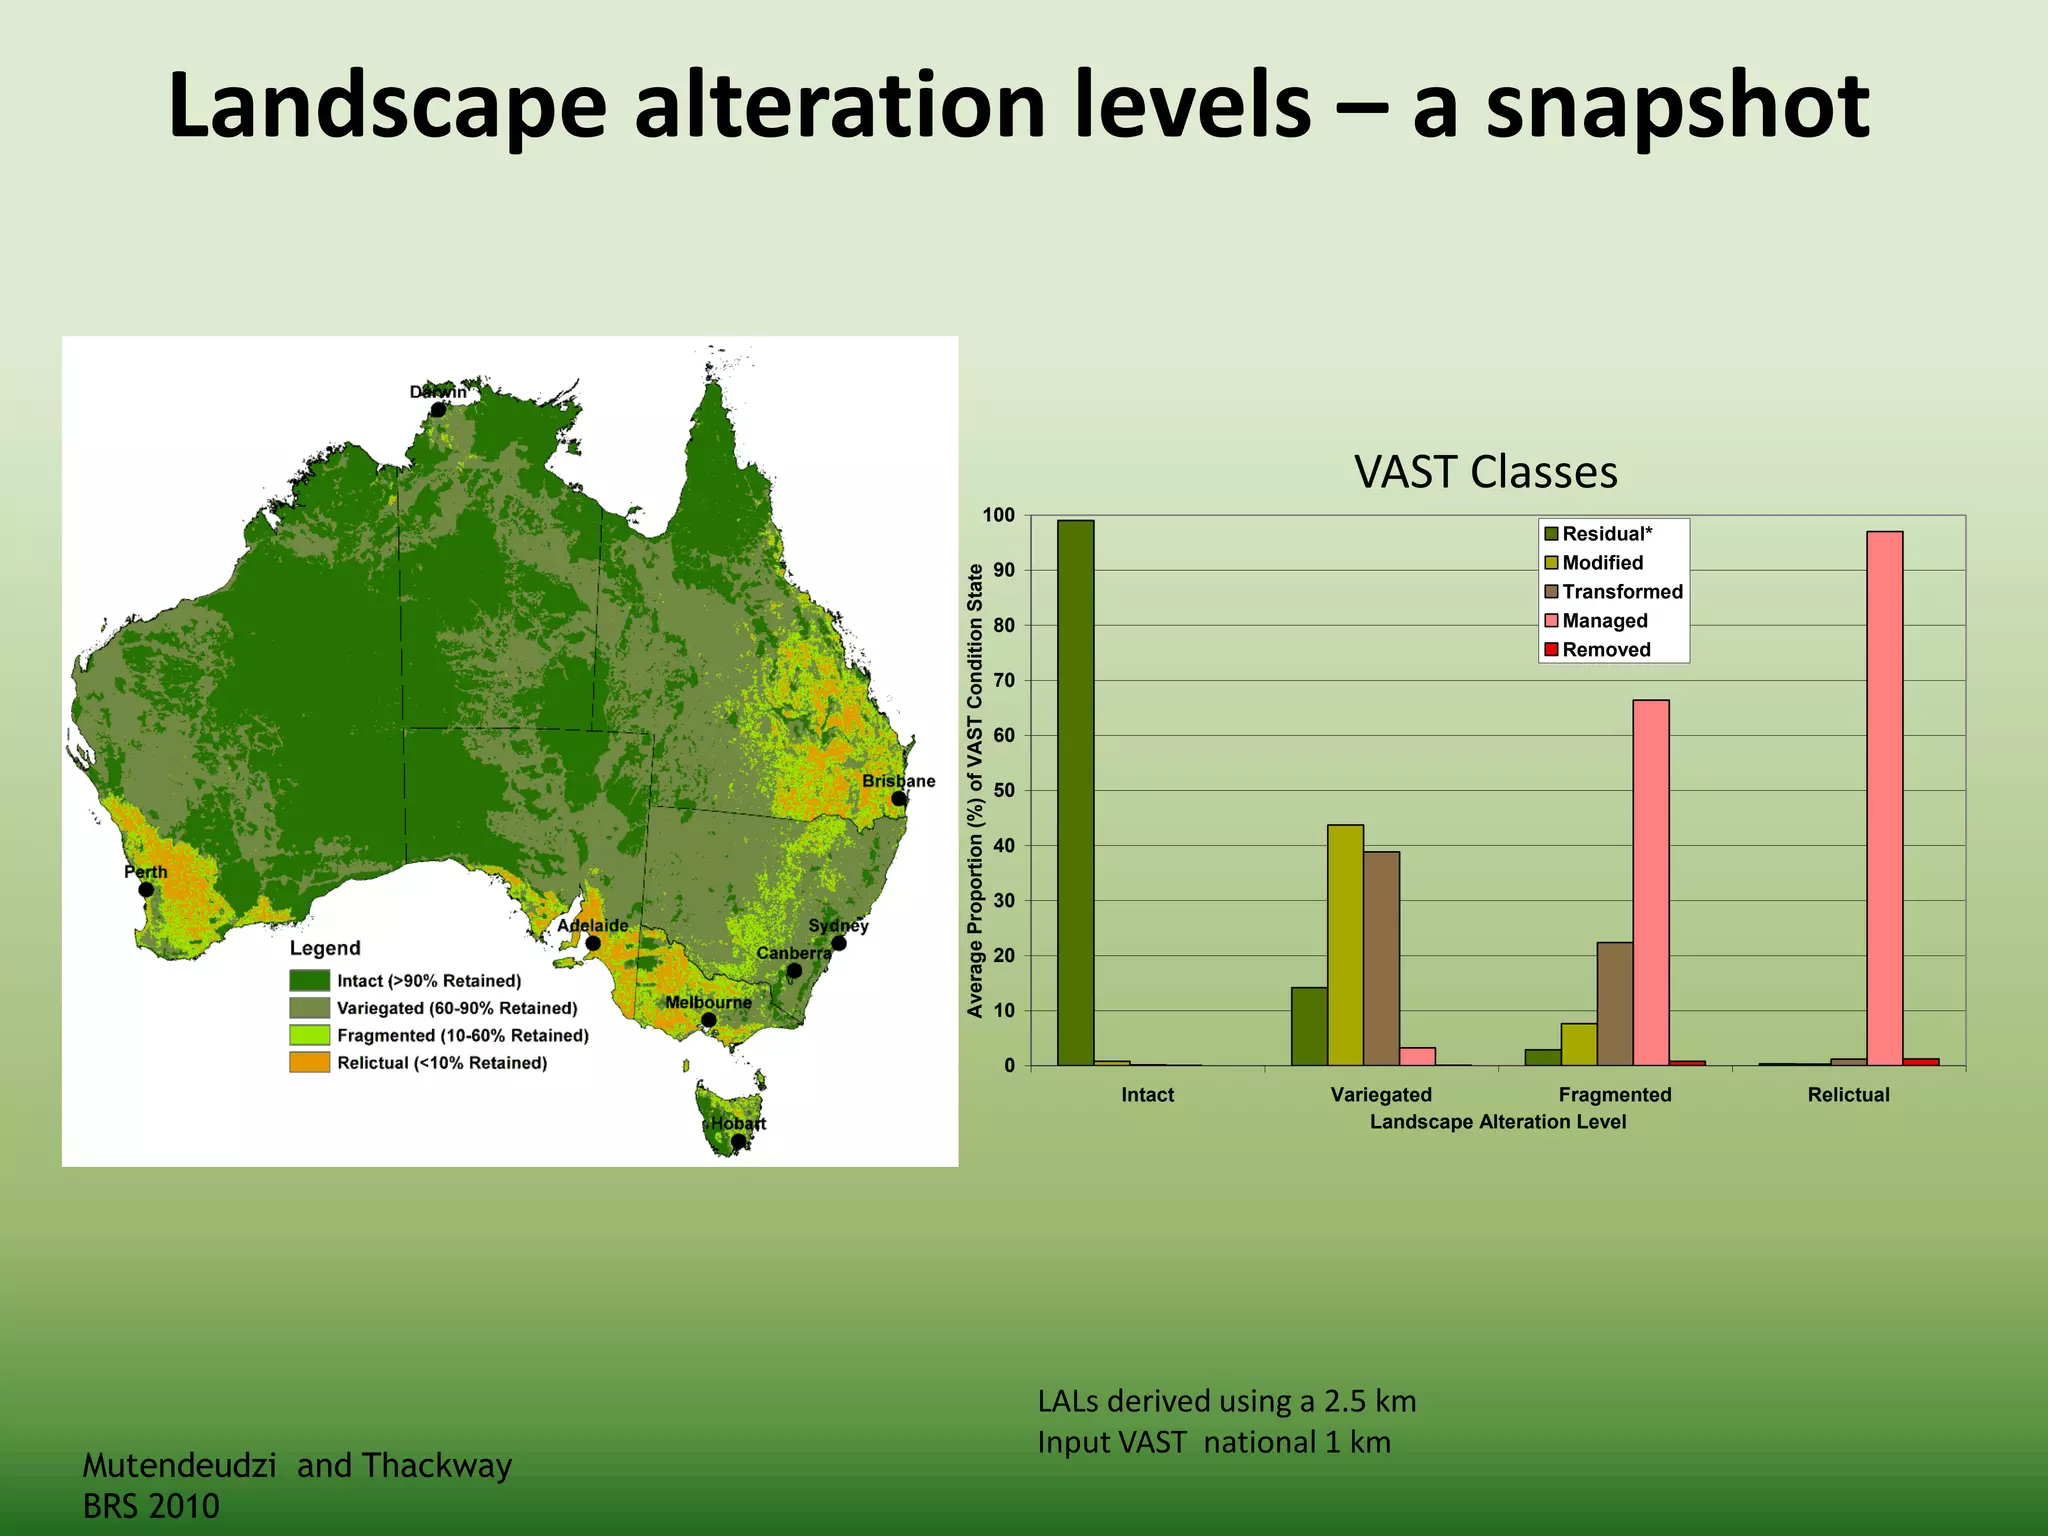
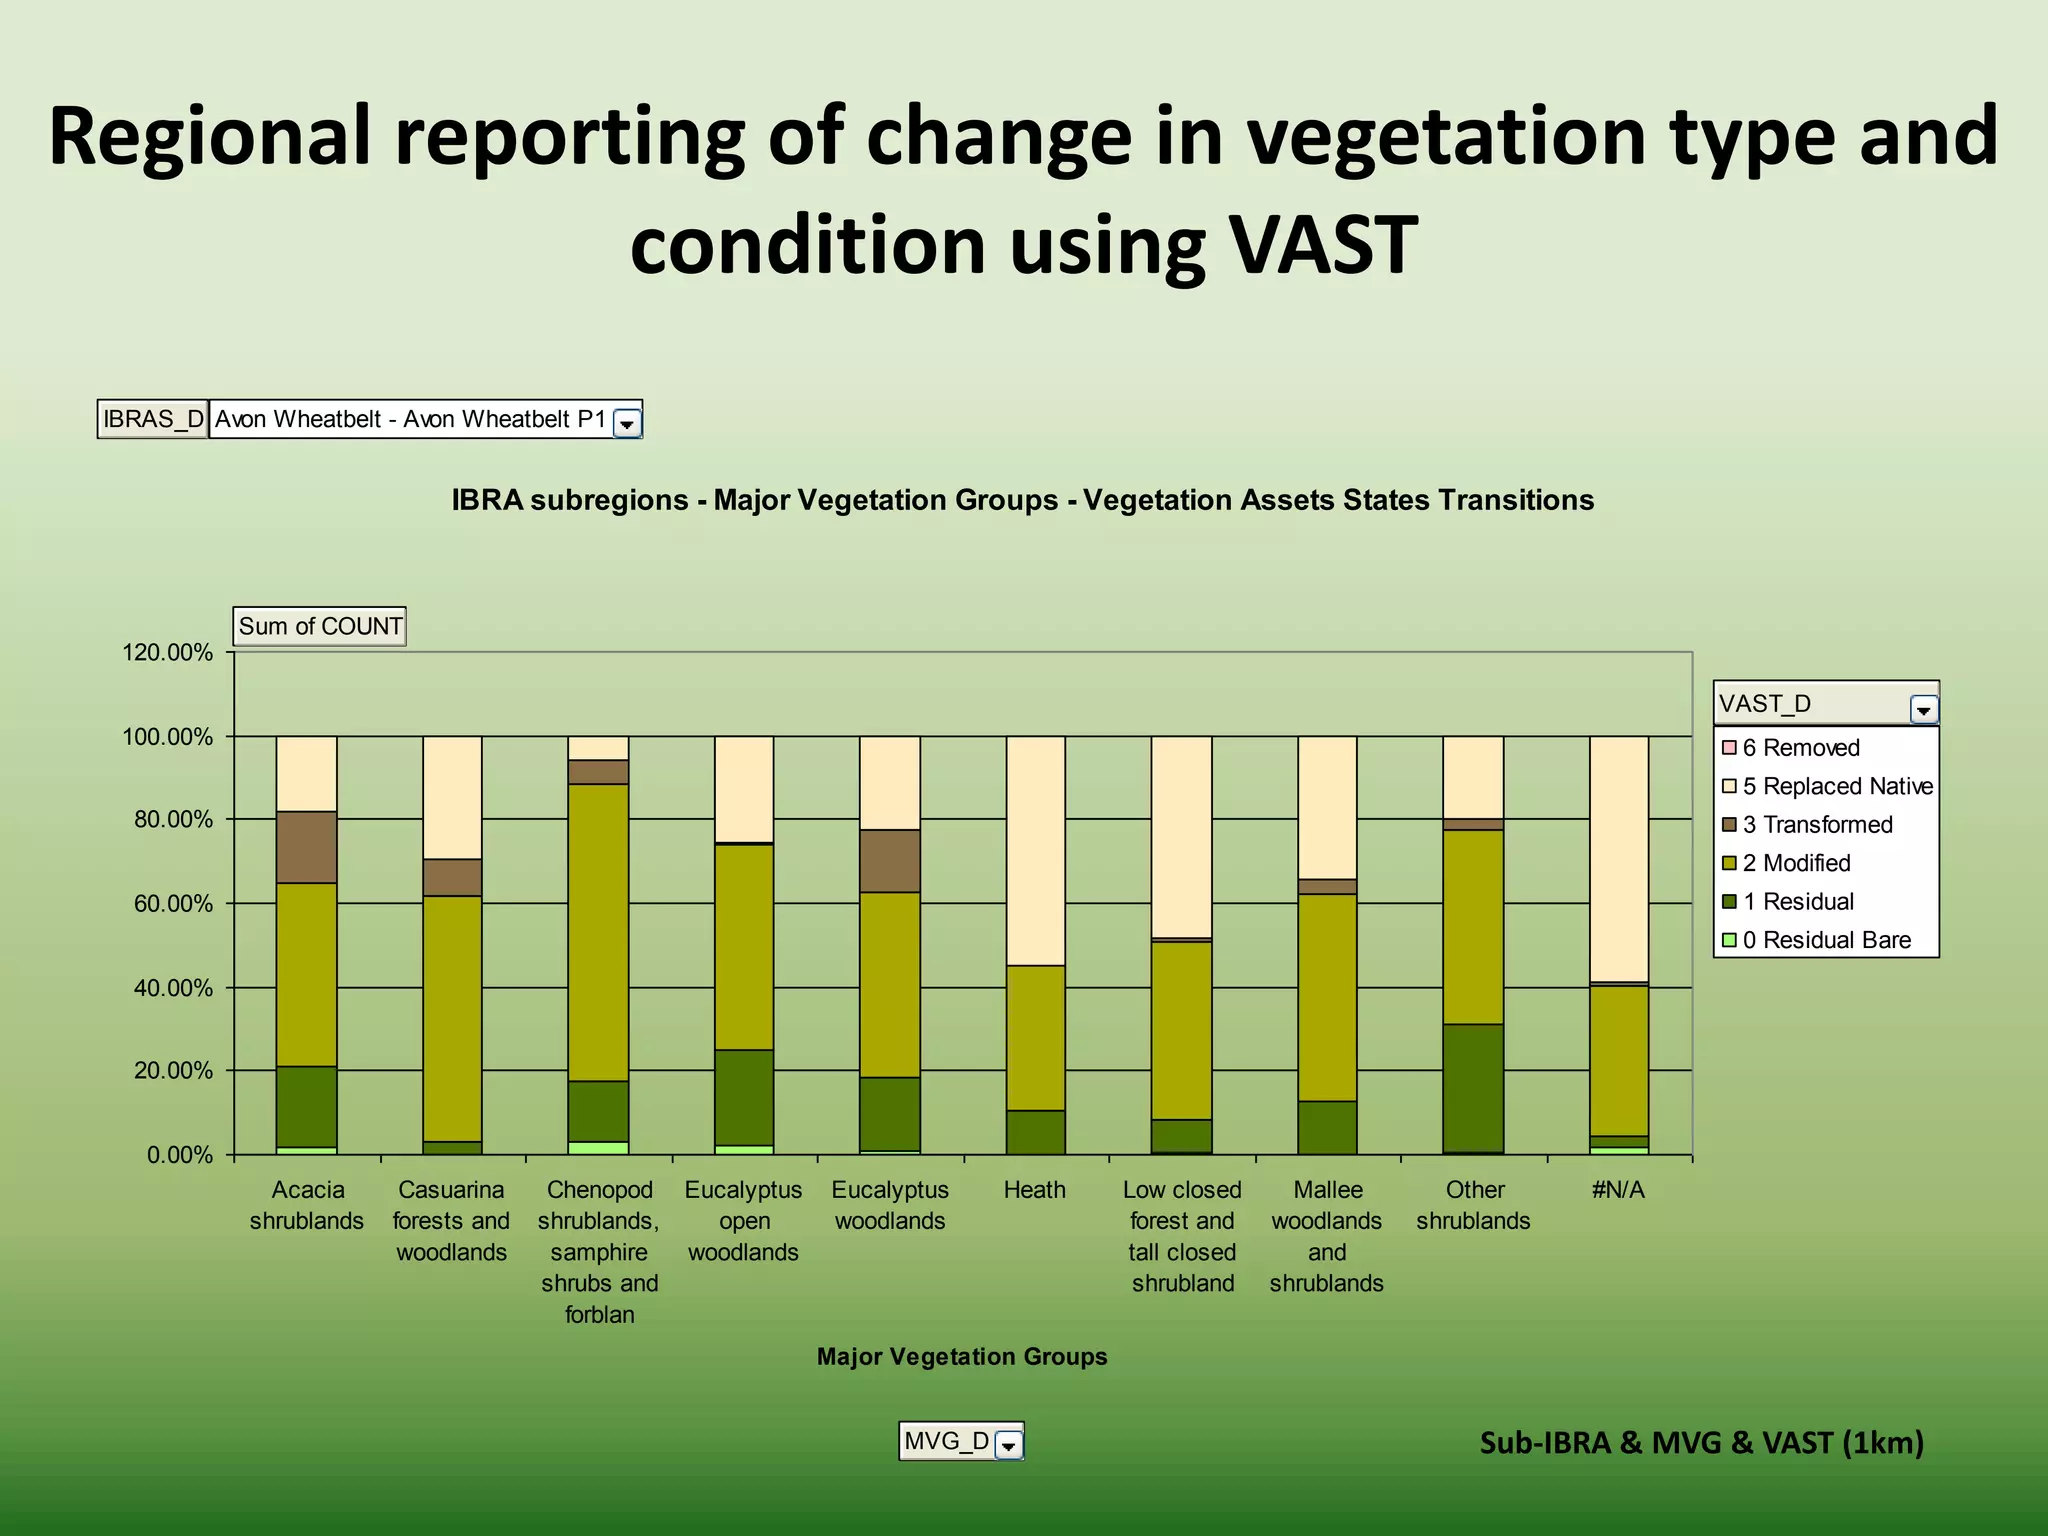
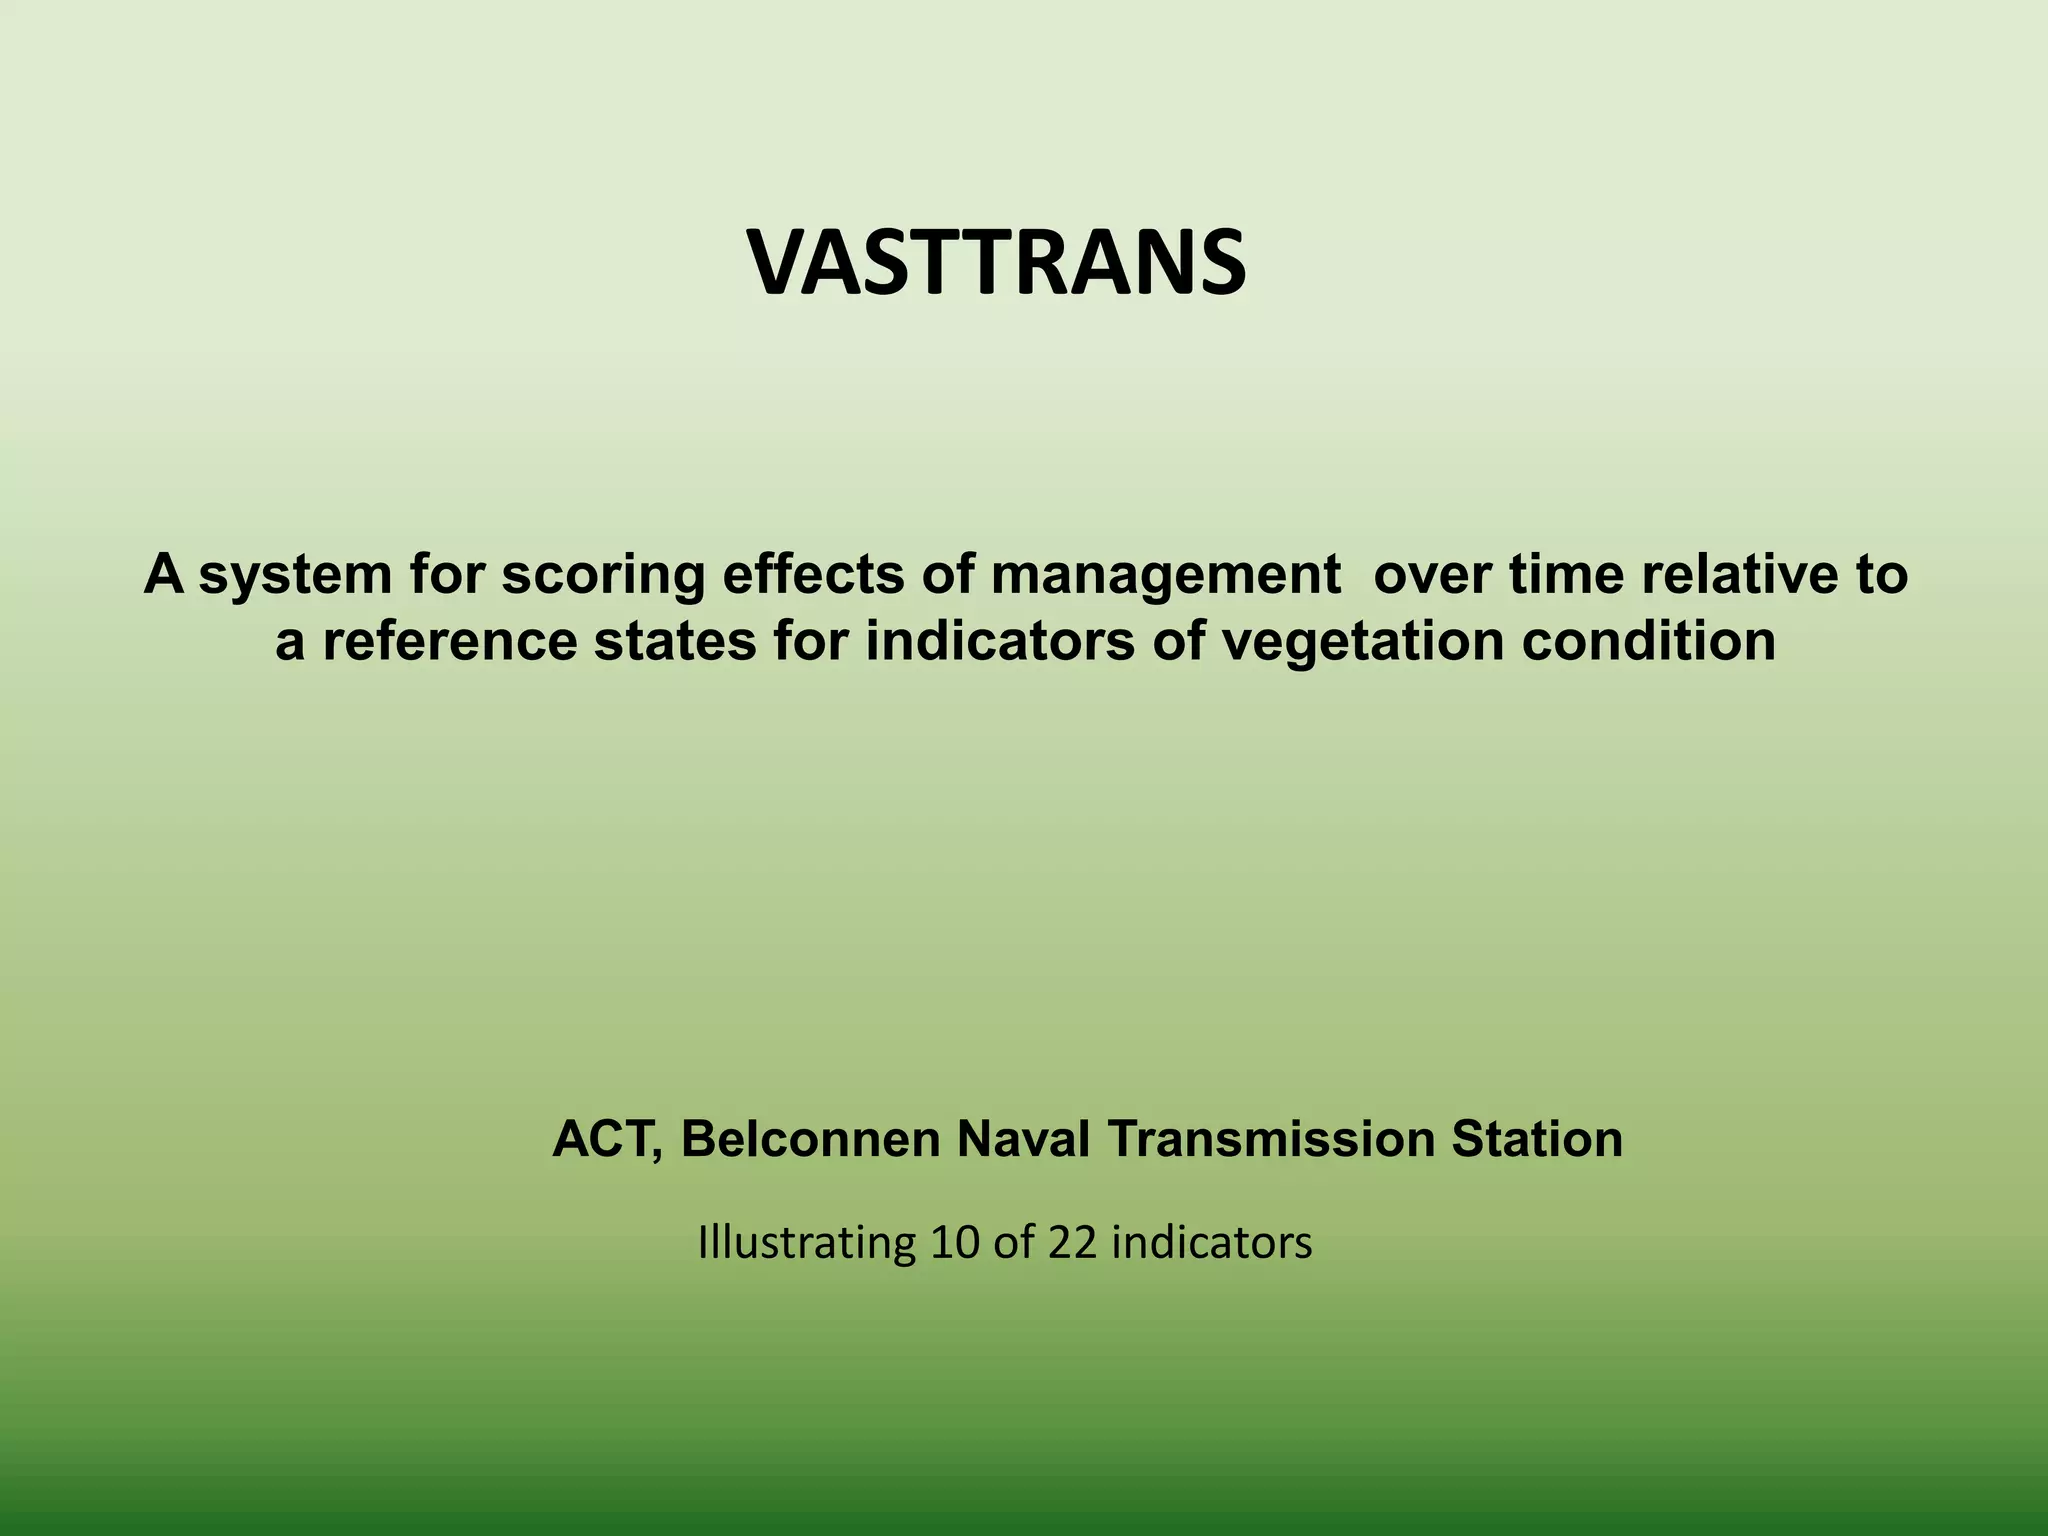
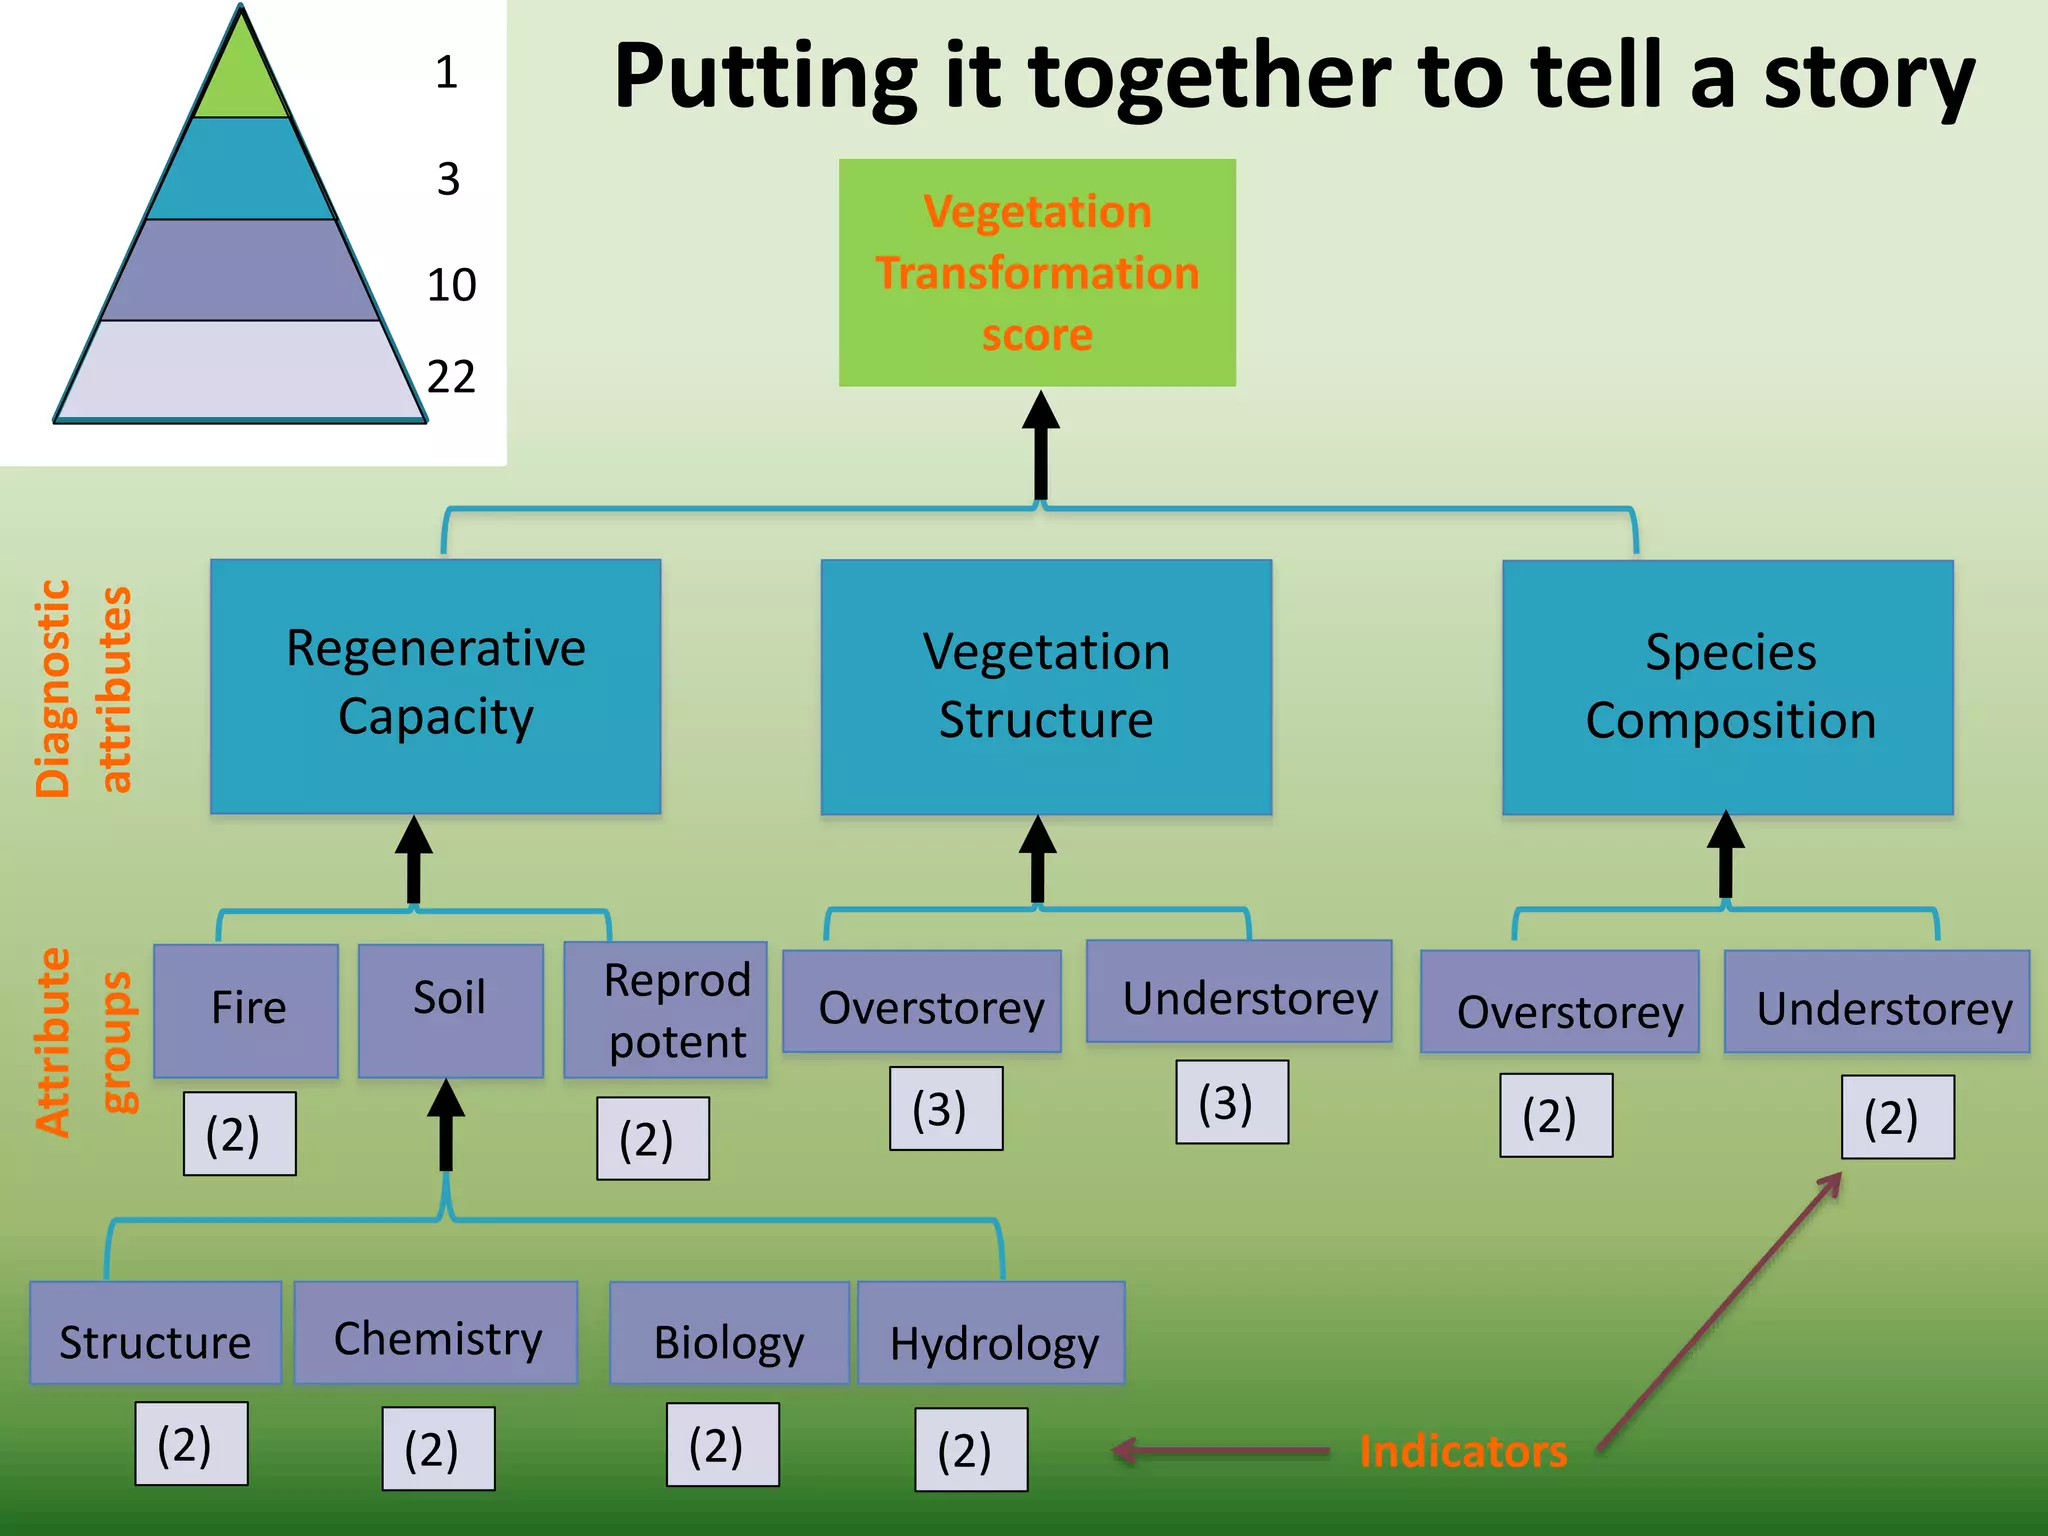
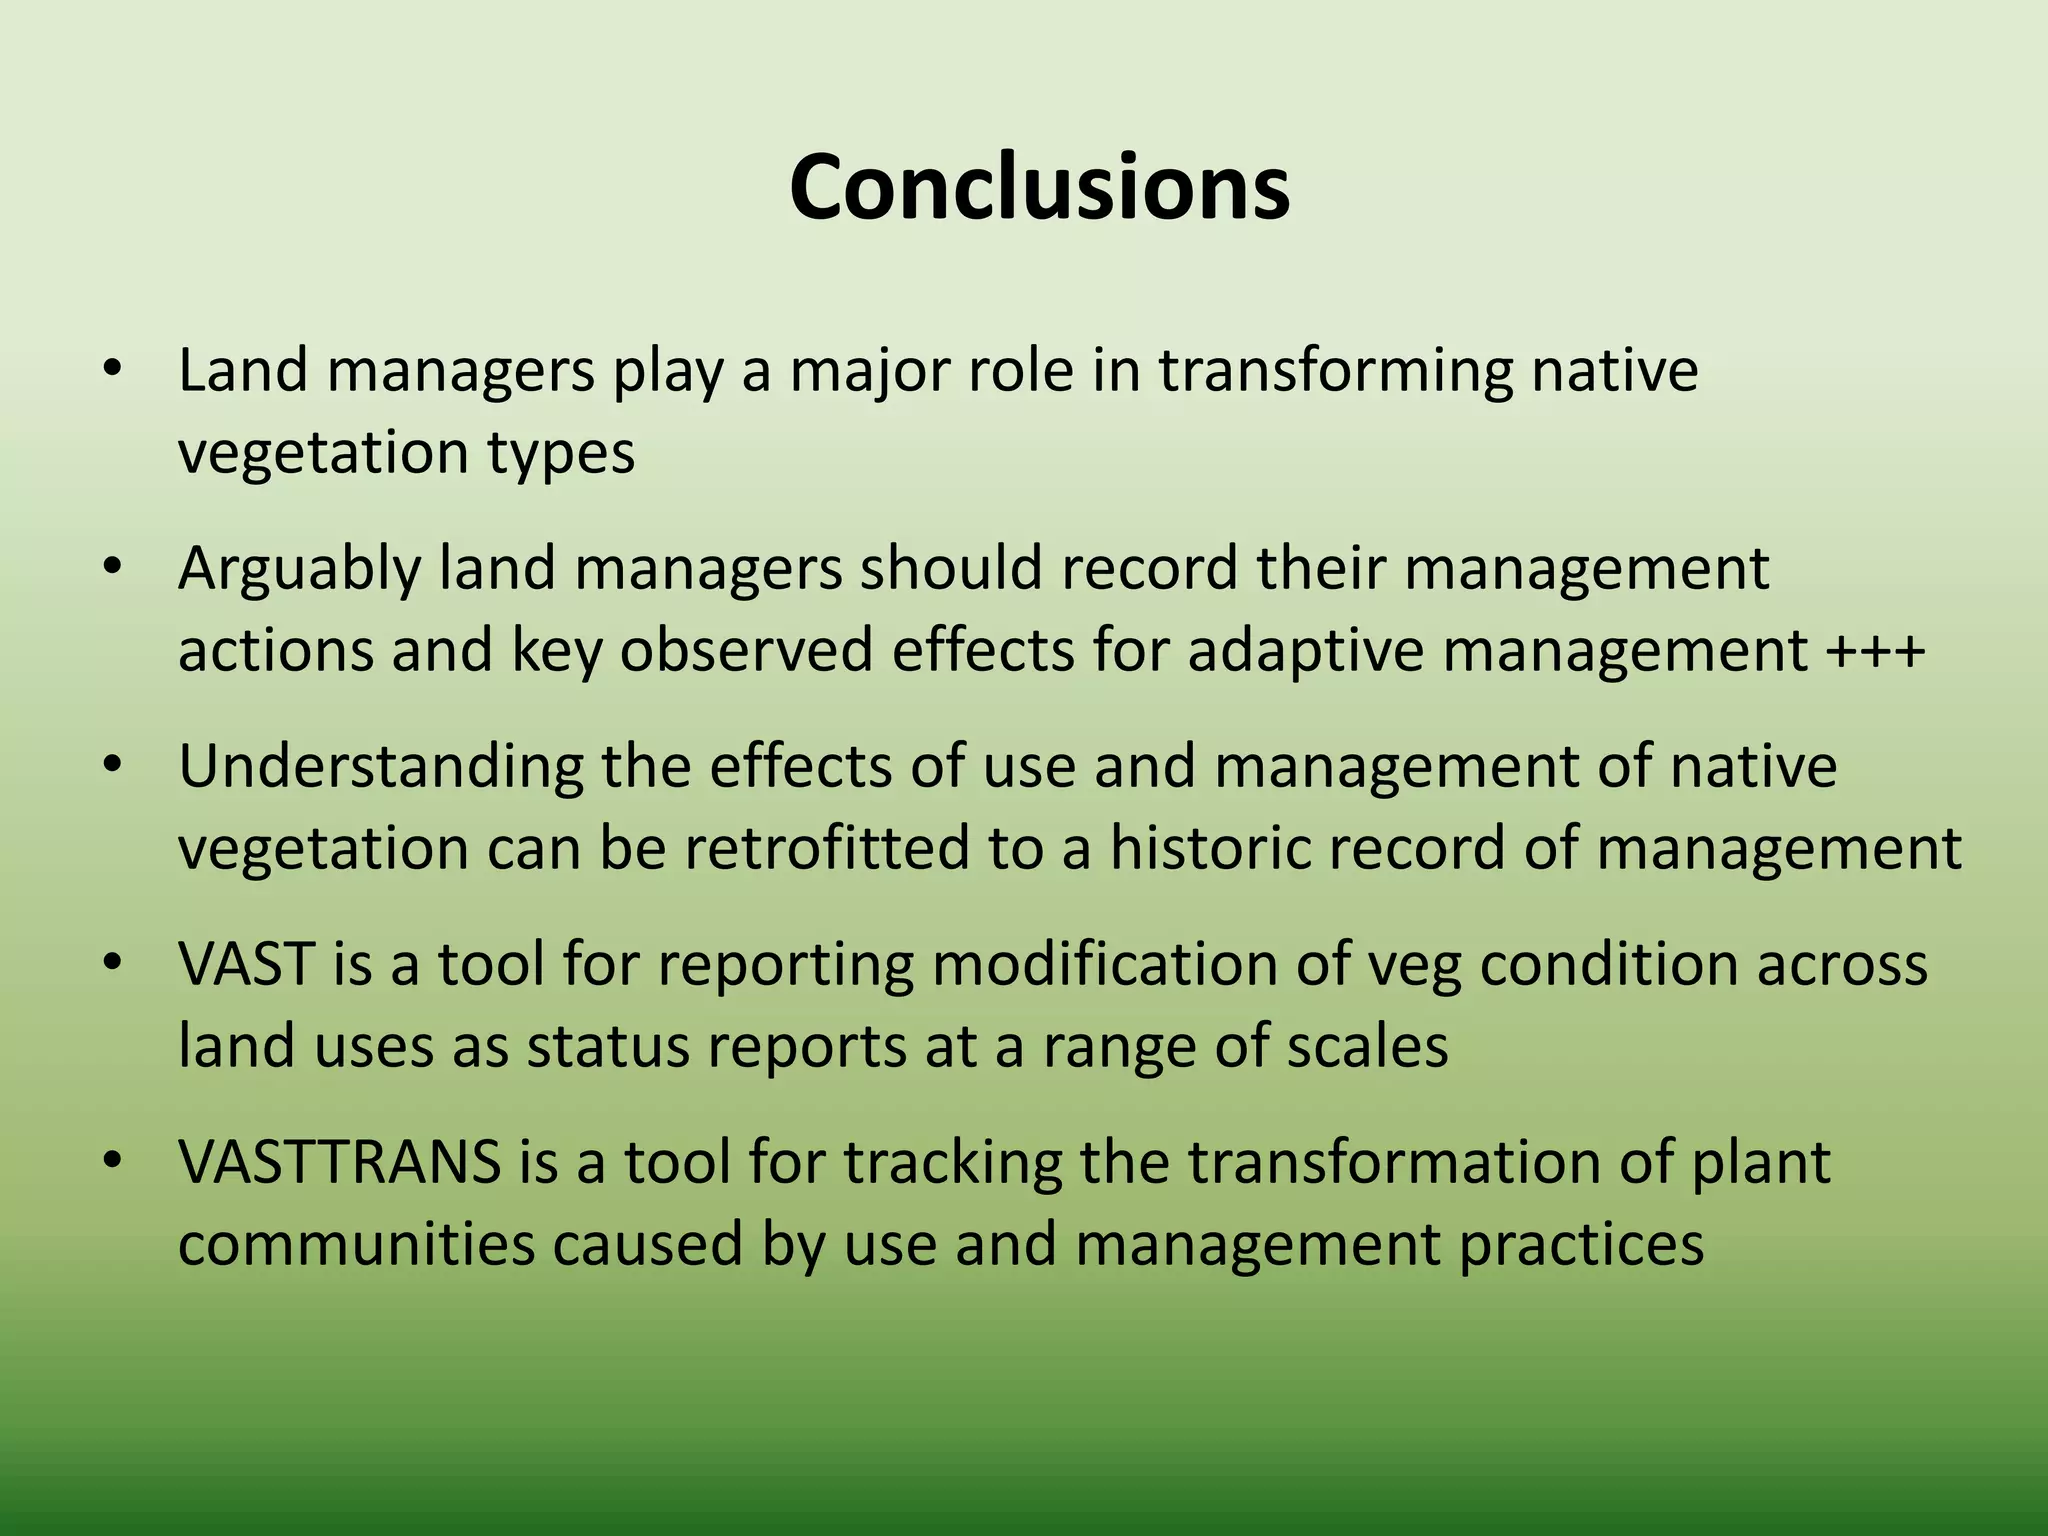
Overview of vegetation
management – VAST as a solution
Richard Thackway
Lecture presented to ADFA Geography students, Canberra on 28 August 2012
School of Physical, Environmental and Mathematical Sciences, University of
New South Wales
Outline
• Perceptions
• Definitions
• Land management and vegetation
• Effects of managing native vegetation
• Reporting change in the condition of vegetation
types
• Reporting the transformation of plant communities
• Importance of collecting information
• Diverse and healthy native vegetation is important
• My vegetation is in good condition
• My water is my asset
• My soil is my asset
• My animals are my asset
• Vegetation is a means to an end – utilitarian
• I want to hand my land in good condition to my children
/future generations
Some perceptions of land managers
(public and private)
What is vegetation use and management?
• Land use determines primary purpose for land cover types e.g.
– Forestry is typified by forest veg cover types
– Cropping is typified by annual veg cover types
– Urban is typified by infrastructure cover types
– Water harvesting is typified by many veg cover types
– Defence training is typified by native veg cover types
• Land management practices (LMP) = the how of land use
What are management practices?
• Remove life form/s &/or species e.g. tree, shrub, grass
– e.g. push out, pull out, cut off and chemically treat
• Replace life form/s &/or species e.g. tree, shrub, grass
– e.g. replant, rehabilitate, re-sow
• Manage health & vitality of life form/s &/or species
e.g. tree, shrub, grass
– e.g. prune, stake, slash, fertilise, graze
• Manage residues from life form/s &/or species e.g. tree,
shrub, grass
– e.g. burn grass, burn fine woody debris, bark, leaves
What is vegetation condition?
• Vegetation condition is relative concept
• Context dependant
– Same patch can be assessed differently for purposes
• Analogous to human health and the ‘norm’
Natural vegetation and the environment
• Environmental patterns and processes
– Environmental gradients
– Climate influencers
• Cycles - seasons, annual and decadal events
– Dust, fires, cyclones, flood, drought, insects, pathogens
– Interactions with other physical influencers
• Landform, relief, aspect, geology, soil, hydrology
• Observed drives veg patterns and processes
– Productivity
– Maintaining life cycles – reproduction, germination, establishment,
growth, and death
– Succession
– Responses to perturbations and disturbances
– Species, communities and ecosystems
Goals of land managers
Values and decisions matrix:
• Social
• Economic
• Environmental
Intensification
Degradation?
Goals of land managers
Values and decisions matrix:
• Social
• Economic
• Environmental
Extensification
Restoration
Regulation ofhydrologicalregime
Generation offood and fibre
Regulation ofclimate / microclimate
Generation ofraw materials
Recyclingoforganic matter
Creating and regulatinghabitats
Controllingreproductionand dispersal
Changing ecological function to derive multiple benefits (ecosystem services)
How is vegetation condition info
is used in decision making?
1. Characterise status & trends/ identify problems with
resource condition and /or assets
– What, where, when, why & who
2. Assist in setting goals, objectives, priorities, targets
3. Design & implement program/s
– e.g. MBIs, regulation, education, investment, interventions, etc
4. Check on performance of on-ground of investment
– e.g. Was the target met? Did land management change?
5. Report again on resource condition Adaptive
management
cycle
1
5
4
3
2
Vegetation management & condition
What do land managers modify / replace/ remove?
– Vegetation structure
• Life form (tree:grass)
• Growth stage /Age class
• Height
• Cover/density
• Strata/layers/complexity
– Species composition
• Richness or number of species
• Evenness of individuals per
species
• Functional traits
– Regenerative capacity
• Fire regime
• Soil structure
• Soil hydrology
• Soil structure
• Soil nutrients
• Reproductive potential
Natural vegetation and land use
• Land use and vegetation
– Single use
– Multiple uses
• Intensification of land use
– Minimal = Nature conservation, Defence training areas
– Moderate = Pulse grazing, Selective logging forestry
– High = Continuous or set stock grazing
– Very high = Plantations, Cropping, Bomb target areas
– Extreme = Water impoundments, Built infrastructure
Species
Composition



Growth
Form



% Foliage Cover
Height
U
M
G
NVIS Data Model
Natural vegetation for nature conservation
Species
Composition



Growth
Form



% Foliage Cover
Height
U
M
G
NVIS Data Model
Natural vegetation for defence training
Species
Composition

Growth
Form

% Foliage Cover
Height
U
M
G
NVIS Data Model
Land management for grazing
Species
Composition

Growth
Form

% Foliage Cover
Height
U
NVIS Data Model
Land management for plantation forestry
How to report vegetation
management at different scales?
• Site modification of plant communities
– species composition
– Vegetation structure
– Regenerative capacity
• Landscape levels
– Patchiness
– Fragmentation and connectivity
Vegetation States Assets and Transitions (VAST) framework
VIVIVIIIIII0
Native vegetation
cover
Non-native vegetation
cover
Increasing vegetation modification
Transitions = trend
Vegetation
thresholds
Benchmark
for each veg
type (NVIS)
VAST a framework – linking land management
and native veg condition
Condition states
ResidualNaturally
bare
Modified Transformed Replaced -
Adventive
Replaced -
managed
Replaced -
removed
Modification
Fragmentation
Conceptual framework for understanding
vegetation condition and landscape change
Intact
>90%
Variegated
60-90% retained
Fragmented
10-60% retained
Relictual
<10% retained
Native
Unmodified
Modified and retained
Highly modified
Destroyed
VAST I Residual
VAST 0 Naturally Bare
VAST II Modified
VAST III Transformed
VAST IV Replaced – Adventive,
VAST V Replaced – Managed
VAST VI Removed
McIntyre and Hobbs
1999
p142-02
p142-18
p143
Monitoring & reporting at sites - poplar box woodlands (Central Qld)
VAST I
• Freehold no grazing
• Multiple strata, some emergents
• Biomass ~120 t/ha
• FPC ~ 52%, Max height ~ 24m
• Spp OverS 3-5, MidS 5+, GroundS 5-10
• Regen - good
VAST II
• Freehold - grazing
• Two strata
• Biomass ~68 t/ha
• FPC ~ 25%, Max height ~ 17m
• Spp OverS 3, MidS 1, GroundS ~1-4
• Regen – Low-Moderate
VAST III
• Freehold - heavy grazing - mechanical thinning
• Single, low height strata
• Biomass ~42 t/ha
• FPC ~ 20%, Max height ~ 13m
• Spp OverS 3, MidS 0, GroundS ~1-4
• Regen – very low, > % bare ground
Vegetation condition – a snapshot
Thackway & Lesslie (2008)
Environmental Management, 42, 572-90
Landscape alteration levels – a snapshot
LALs derived using a 2.5 km
Input VAST national 1 km
Continental 2.5k Moving Window Radius
0
10
20
30
40
50
60
70
80
90
100
Intact Variegated Fragmented Relictual
Landscape Alteration Level
AverageProportion(%)ofVASTConditionState
Residual*
Modified
Transformed
Managed
Removed
Mutendeudzi and Thackway
BRS 2010
VAST Classes
Regional reporting of change in vegetation type and
condition using VAST
IBRA subregions - Major Vegetation Groups - Vegetation Assets States Transitions
0.00%
20.00%
40.00%
60.00%
80.00%
100.00%
120.00%
Acacia
shrublands
Casuarina
forests and
woodlands
Chenopod
shrublands,
samphire
shrubs and
forblan
Eucalyptus
open
woodlands
Eucalyptus
woodlands
Heath Low closed
forest and
tall closed
shrubland
Mallee
woodlands
and
shrublands
Other
shrublands
#N/A
Major Vegetation Groups
6 Removed
5 Replaced Native
3 Transformed
2 Modified
1 Residual
0 Residual Bare
IBRAS_D Avon Wheatbelt - Avon Wheatbelt P1
Sum of COUNT
MVG_D
VAST_D
Sub-IBRA & MVG & VAST (1km)
A system for scoring effects of management over time relative to
a reference states for indicators of vegetation condition
ACT, Belconnen Naval Transmission Station
Illustrating 10 of 22 indicators
VASTTRANS
VASTTRANS uses the historical record to track
the effects of managing native vegetation
• Site modification of plant communities
– species composition
– Vegetation structure
– Regenerative capacity
• History of use and management
– Minimal = unmodified native veg & land cover
– Moderate = modified native veg & land cover
– High = transformed native veg & land cover
– Very high = replace native veg & land cover
– Extreme = remove native veg & land cover
Approximate
year
Source:
Year
LU & LMP Source:
LU & LMP
Effects of use and
management on vegetation
condition and ecological
function
Source:
Effects
1800
1840
2010
VASTTRANS - compiling the historical record
Pre-contact
First contact
Current year
LU = Land Use, LMP = Land Management Practices
1
3
10
22
VAST
Diagnostic
attributes
Vegetation
Transformation
score
Attribute
groups
Vegetation
Structure
Overstorey
(3)
Understorey
(3)
Species
Composition
(2)
UnderstoreyOverstorey
(2)
Regenerative
Capacity
Fire
(2)
Reprod
potent
(2)
Soil
Hydrology
(2)
Biology
(2)
Chemistry
(2)
Structure
(2) Indicators
Indicators affected by managing native vegetation
RC_fire_burnt_area RC_soil_hyd_surf_water RC_soil_biol_organ_matt
RC_reprod_potent_OS RC_reprod_potent_US
VS_OS_height VS_OS_fpc VS_OS_div_age_class
SC_US_fnl_groups SC_US_richness
1
3
10
22
Diagnostic
attributes
Vegetation
Transformation
score
Attribute
groups
Vegetation
Structure
Overstorey
(3)
Understorey
(3)
Species
Composition
(2)
UnderstoreyOverstorey
(2)
Regenerative
Capacity
Fire
(2)
Reprod
potent
(2)
Soil
Hydrology
(2)
Biology
(2)
Chemistry
(2)
Structure
(2) Indicators
Putting it together to tell a story
0
10
20
30
40
50
60
70
80
90
100
1750 1800 1850 1900 1950 2000 2050
score(%)
year
Belconnen Naval Transmitter Station
Regenerative Capacity
Vegetation Structure
Species Composition
Vegetation status
0
10
20
30
40
50
60
70
80
90
100
1750 1800 1850 1900 1950 2000 2050
score(%)
year
Belconnen Naval Transmitter Station
Regenerative Capacity
Vegetation Structure
Species Composition
Vegetation statusSheep grazing commenced
Commenced continuous sheep grazing
Sheep grazing ceased
Limited management by
Ngunnawal people
Kangaroo population culled
Kangaroo population increasing
Woodland trees ringbarked
Grass mowing started and stopped
NSW, Big Scrub, Rocky Creek Dam
Reference pre-European Complex Notophyll Vine Forest
Unmodified
and intact
Clearing and
conversion to
pasture
Start of
grazing exotic
pasture
End
grazing
pastures
Removal
of weeds
Lantana -
Privet
Commenced
monitoring of
regeneration
VAST classes
25 ha of dense
Lantana
NSW, NC Bioregion, ‘Tintenbar’
Reference pre-European Complex Notophyll Vine Forest
Unmodified
and intact
rainforest
Clearing and
conversion
Start of
grazing
exotic
pasture
End of
grazing
pastures
Rainforest
seedlings under
dense Camphor
forest
Start of
ploughing
& cropping
VAST classes
28 ha of dense
Camphor laurel
forest
Source: John Ive 2006
‘Talaheni’ 250 ha property near Murrumbateman, NSW
1962 1983 1986 1997 2004
Reporting VASTTRANS using VAST classes
‘Talaheni’ 250 ha property near
Murrumbateman, NSW
Reporting VAST condition states ‘Talaheni’
0
50
100
150
200
250
300
1962 1983 1986 1997 2004
Year of VAST assessment
hectares
2
31
32
33
5
6
H
e
ct
a
r
e
s
• Land managers play a major role in transforming native
vegetation types
• Arguably land managers should record their management
actions and key observed effects for adaptive management +++
• Understanding the effects of use and management of native
vegetation can be retrofitted to a historic record of management
• VAST is a tool for reporting modification of veg condition across
land uses as status reports at a range of scales
• VASTTRANS is a tool for tracking the transformation of plant
communities caused by use and management practices
Conclusions
Acknowledgements
Many people have helped in developing VAST
including staff from SEWPAC, DAFF, ABARES, state
and territory agencies, CSIRO, Greening Australia
and regional bodies

Overview of vegetation management – VAST as a solution

  • 1.
    Overview of vegetation management– VAST as a solution Richard Thackway Lecture presented to ADFA Geography students, Canberra on 28 August 2012 School of Physical, Environmental and Mathematical Sciences, University of New South Wales
  • 2.
    Outline • Perceptions • Definitions •Land management and vegetation • Effects of managing native vegetation • Reporting change in the condition of vegetation types • Reporting the transformation of plant communities • Importance of collecting information
  • 3.
    • Diverse andhealthy native vegetation is important • My vegetation is in good condition • My water is my asset • My soil is my asset • My animals are my asset • Vegetation is a means to an end – utilitarian • I want to hand my land in good condition to my children /future generations Some perceptions of land managers (public and private)
  • 4.
    What is vegetationuse and management? • Land use determines primary purpose for land cover types e.g. – Forestry is typified by forest veg cover types – Cropping is typified by annual veg cover types – Urban is typified by infrastructure cover types – Water harvesting is typified by many veg cover types – Defence training is typified by native veg cover types • Land management practices (LMP) = the how of land use
  • 5.
    What are managementpractices? • Remove life form/s &/or species e.g. tree, shrub, grass – e.g. push out, pull out, cut off and chemically treat • Replace life form/s &/or species e.g. tree, shrub, grass – e.g. replant, rehabilitate, re-sow • Manage health & vitality of life form/s &/or species e.g. tree, shrub, grass – e.g. prune, stake, slash, fertilise, graze • Manage residues from life form/s &/or species e.g. tree, shrub, grass – e.g. burn grass, burn fine woody debris, bark, leaves
  • 6.
    What is vegetationcondition? • Vegetation condition is relative concept • Context dependant – Same patch can be assessed differently for purposes • Analogous to human health and the ‘norm’
  • 7.
    Natural vegetation andthe environment • Environmental patterns and processes – Environmental gradients – Climate influencers • Cycles - seasons, annual and decadal events – Dust, fires, cyclones, flood, drought, insects, pathogens – Interactions with other physical influencers • Landform, relief, aspect, geology, soil, hydrology • Observed drives veg patterns and processes – Productivity – Maintaining life cycles – reproduction, germination, establishment, growth, and death – Succession – Responses to perturbations and disturbances – Species, communities and ecosystems
  • 8.
    Goals of landmanagers Values and decisions matrix: • Social • Economic • Environmental Intensification Degradation?
  • 9.
    Goals of landmanagers Values and decisions matrix: • Social • Economic • Environmental Extensification Restoration
  • 10.
    Regulation ofhydrologicalregime Generation offoodand fibre Regulation ofclimate / microclimate Generation ofraw materials Recyclingoforganic matter Creating and regulatinghabitats Controllingreproductionand dispersal Changing ecological function to derive multiple benefits (ecosystem services)
  • 11.
    How is vegetationcondition info is used in decision making? 1. Characterise status & trends/ identify problems with resource condition and /or assets – What, where, when, why & who 2. Assist in setting goals, objectives, priorities, targets 3. Design & implement program/s – e.g. MBIs, regulation, education, investment, interventions, etc 4. Check on performance of on-ground of investment – e.g. Was the target met? Did land management change? 5. Report again on resource condition Adaptive management cycle 1 5 4 3 2
  • 12.
    Vegetation management &condition What do land managers modify / replace/ remove? – Vegetation structure • Life form (tree:grass) • Growth stage /Age class • Height • Cover/density • Strata/layers/complexity – Species composition • Richness or number of species • Evenness of individuals per species • Functional traits – Regenerative capacity • Fire regime • Soil structure • Soil hydrology • Soil structure • Soil nutrients • Reproductive potential
  • 13.
    Natural vegetation andland use • Land use and vegetation – Single use – Multiple uses • Intensification of land use – Minimal = Nature conservation, Defence training areas – Moderate = Pulse grazing, Selective logging forestry – High = Continuous or set stock grazing – Very high = Plantations, Cropping, Bomb target areas – Extreme = Water impoundments, Built infrastructure
  • 14.
  • 15.
  • 16.
  • 17.
    Species Composition  Growth Form  % Foliage Cover Height U NVISData Model Land management for plantation forestry
  • 18.
    How to reportvegetation management at different scales? • Site modification of plant communities – species composition – Vegetation structure – Regenerative capacity • Landscape levels – Patchiness – Fragmentation and connectivity
  • 19.
    Vegetation States Assetsand Transitions (VAST) framework VIVIVIIIIII0 Native vegetation cover Non-native vegetation cover Increasing vegetation modification Transitions = trend Vegetation thresholds Benchmark for each veg type (NVIS) VAST a framework – linking land management and native veg condition Condition states ResidualNaturally bare Modified Transformed Replaced - Adventive Replaced - managed Replaced - removed
  • 20.
    Modification Fragmentation Conceptual framework forunderstanding vegetation condition and landscape change Intact >90% Variegated 60-90% retained Fragmented 10-60% retained Relictual <10% retained Native Unmodified Modified and retained Highly modified Destroyed VAST I Residual VAST 0 Naturally Bare VAST II Modified VAST III Transformed VAST IV Replaced – Adventive, VAST V Replaced – Managed VAST VI Removed McIntyre and Hobbs 1999
  • 21.
    p142-02 p142-18 p143 Monitoring & reportingat sites - poplar box woodlands (Central Qld) VAST I • Freehold no grazing • Multiple strata, some emergents • Biomass ~120 t/ha • FPC ~ 52%, Max height ~ 24m • Spp OverS 3-5, MidS 5+, GroundS 5-10 • Regen - good VAST II • Freehold - grazing • Two strata • Biomass ~68 t/ha • FPC ~ 25%, Max height ~ 17m • Spp OverS 3, MidS 1, GroundS ~1-4 • Regen – Low-Moderate VAST III • Freehold - heavy grazing - mechanical thinning • Single, low height strata • Biomass ~42 t/ha • FPC ~ 20%, Max height ~ 13m • Spp OverS 3, MidS 0, GroundS ~1-4 • Regen – very low, > % bare ground
  • 22.
    Vegetation condition –a snapshot Thackway & Lesslie (2008) Environmental Management, 42, 572-90
  • 23.
    Landscape alteration levels– a snapshot LALs derived using a 2.5 km Input VAST national 1 km Continental 2.5k Moving Window Radius 0 10 20 30 40 50 60 70 80 90 100 Intact Variegated Fragmented Relictual Landscape Alteration Level AverageProportion(%)ofVASTConditionState Residual* Modified Transformed Managed Removed Mutendeudzi and Thackway BRS 2010 VAST Classes
  • 24.
    Regional reporting ofchange in vegetation type and condition using VAST IBRA subregions - Major Vegetation Groups - Vegetation Assets States Transitions 0.00% 20.00% 40.00% 60.00% 80.00% 100.00% 120.00% Acacia shrublands Casuarina forests and woodlands Chenopod shrublands, samphire shrubs and forblan Eucalyptus open woodlands Eucalyptus woodlands Heath Low closed forest and tall closed shrubland Mallee woodlands and shrublands Other shrublands #N/A Major Vegetation Groups 6 Removed 5 Replaced Native 3 Transformed 2 Modified 1 Residual 0 Residual Bare IBRAS_D Avon Wheatbelt - Avon Wheatbelt P1 Sum of COUNT MVG_D VAST_D Sub-IBRA & MVG & VAST (1km)
  • 25.
    A system forscoring effects of management over time relative to a reference states for indicators of vegetation condition ACT, Belconnen Naval Transmission Station Illustrating 10 of 22 indicators VASTTRANS
  • 26.
    VASTTRANS uses thehistorical record to track the effects of managing native vegetation • Site modification of plant communities – species composition – Vegetation structure – Regenerative capacity • History of use and management – Minimal = unmodified native veg & land cover – Moderate = modified native veg & land cover – High = transformed native veg & land cover – Very high = replace native veg & land cover – Extreme = remove native veg & land cover
  • 27.
    Approximate year Source: Year LU & LMPSource: LU & LMP Effects of use and management on vegetation condition and ecological function Source: Effects 1800 1840 2010 VASTTRANS - compiling the historical record Pre-contact First contact Current year LU = Land Use, LMP = Land Management Practices
  • 28.
  • 29.
  • 30.
  • 31.
  • 32.
  • 33.
  • 34.
    0 10 20 30 40 50 60 70 80 90 100 1750 1800 18501900 1950 2000 2050 score(%) year Belconnen Naval Transmitter Station Regenerative Capacity Vegetation Structure Species Composition Vegetation status
  • 35.
    0 10 20 30 40 50 60 70 80 90 100 1750 1800 18501900 1950 2000 2050 score(%) year Belconnen Naval Transmitter Station Regenerative Capacity Vegetation Structure Species Composition Vegetation statusSheep grazing commenced Commenced continuous sheep grazing Sheep grazing ceased Limited management by Ngunnawal people Kangaroo population culled Kangaroo population increasing Woodland trees ringbarked Grass mowing started and stopped
  • 36.
    NSW, Big Scrub,Rocky Creek Dam Reference pre-European Complex Notophyll Vine Forest Unmodified and intact Clearing and conversion to pasture Start of grazing exotic pasture End grazing pastures Removal of weeds Lantana - Privet Commenced monitoring of regeneration VAST classes 25 ha of dense Lantana
  • 37.
    NSW, NC Bioregion,‘Tintenbar’ Reference pre-European Complex Notophyll Vine Forest Unmodified and intact rainforest Clearing and conversion Start of grazing exotic pasture End of grazing pastures Rainforest seedlings under dense Camphor forest Start of ploughing & cropping VAST classes 28 ha of dense Camphor laurel forest
  • 38.
    Source: John Ive2006 ‘Talaheni’ 250 ha property near Murrumbateman, NSW
  • 39.
    1962 1983 19861997 2004 Reporting VASTTRANS using VAST classes ‘Talaheni’ 250 ha property near Murrumbateman, NSW
  • 40.
    Reporting VAST conditionstates ‘Talaheni’ 0 50 100 150 200 250 300 1962 1983 1986 1997 2004 Year of VAST assessment hectares 2 31 32 33 5 6 H e ct a r e s
  • 41.
    • Land managersplay a major role in transforming native vegetation types • Arguably land managers should record their management actions and key observed effects for adaptive management +++ • Understanding the effects of use and management of native vegetation can be retrofitted to a historic record of management • VAST is a tool for reporting modification of veg condition across land uses as status reports at a range of scales • VASTTRANS is a tool for tracking the transformation of plant communities caused by use and management practices Conclusions
  • 42.
    Acknowledgements Many people havehelped in developing VAST including staff from SEWPAC, DAFF, ABARES, state and territory agencies, CSIRO, Greening Australia and regional bodies