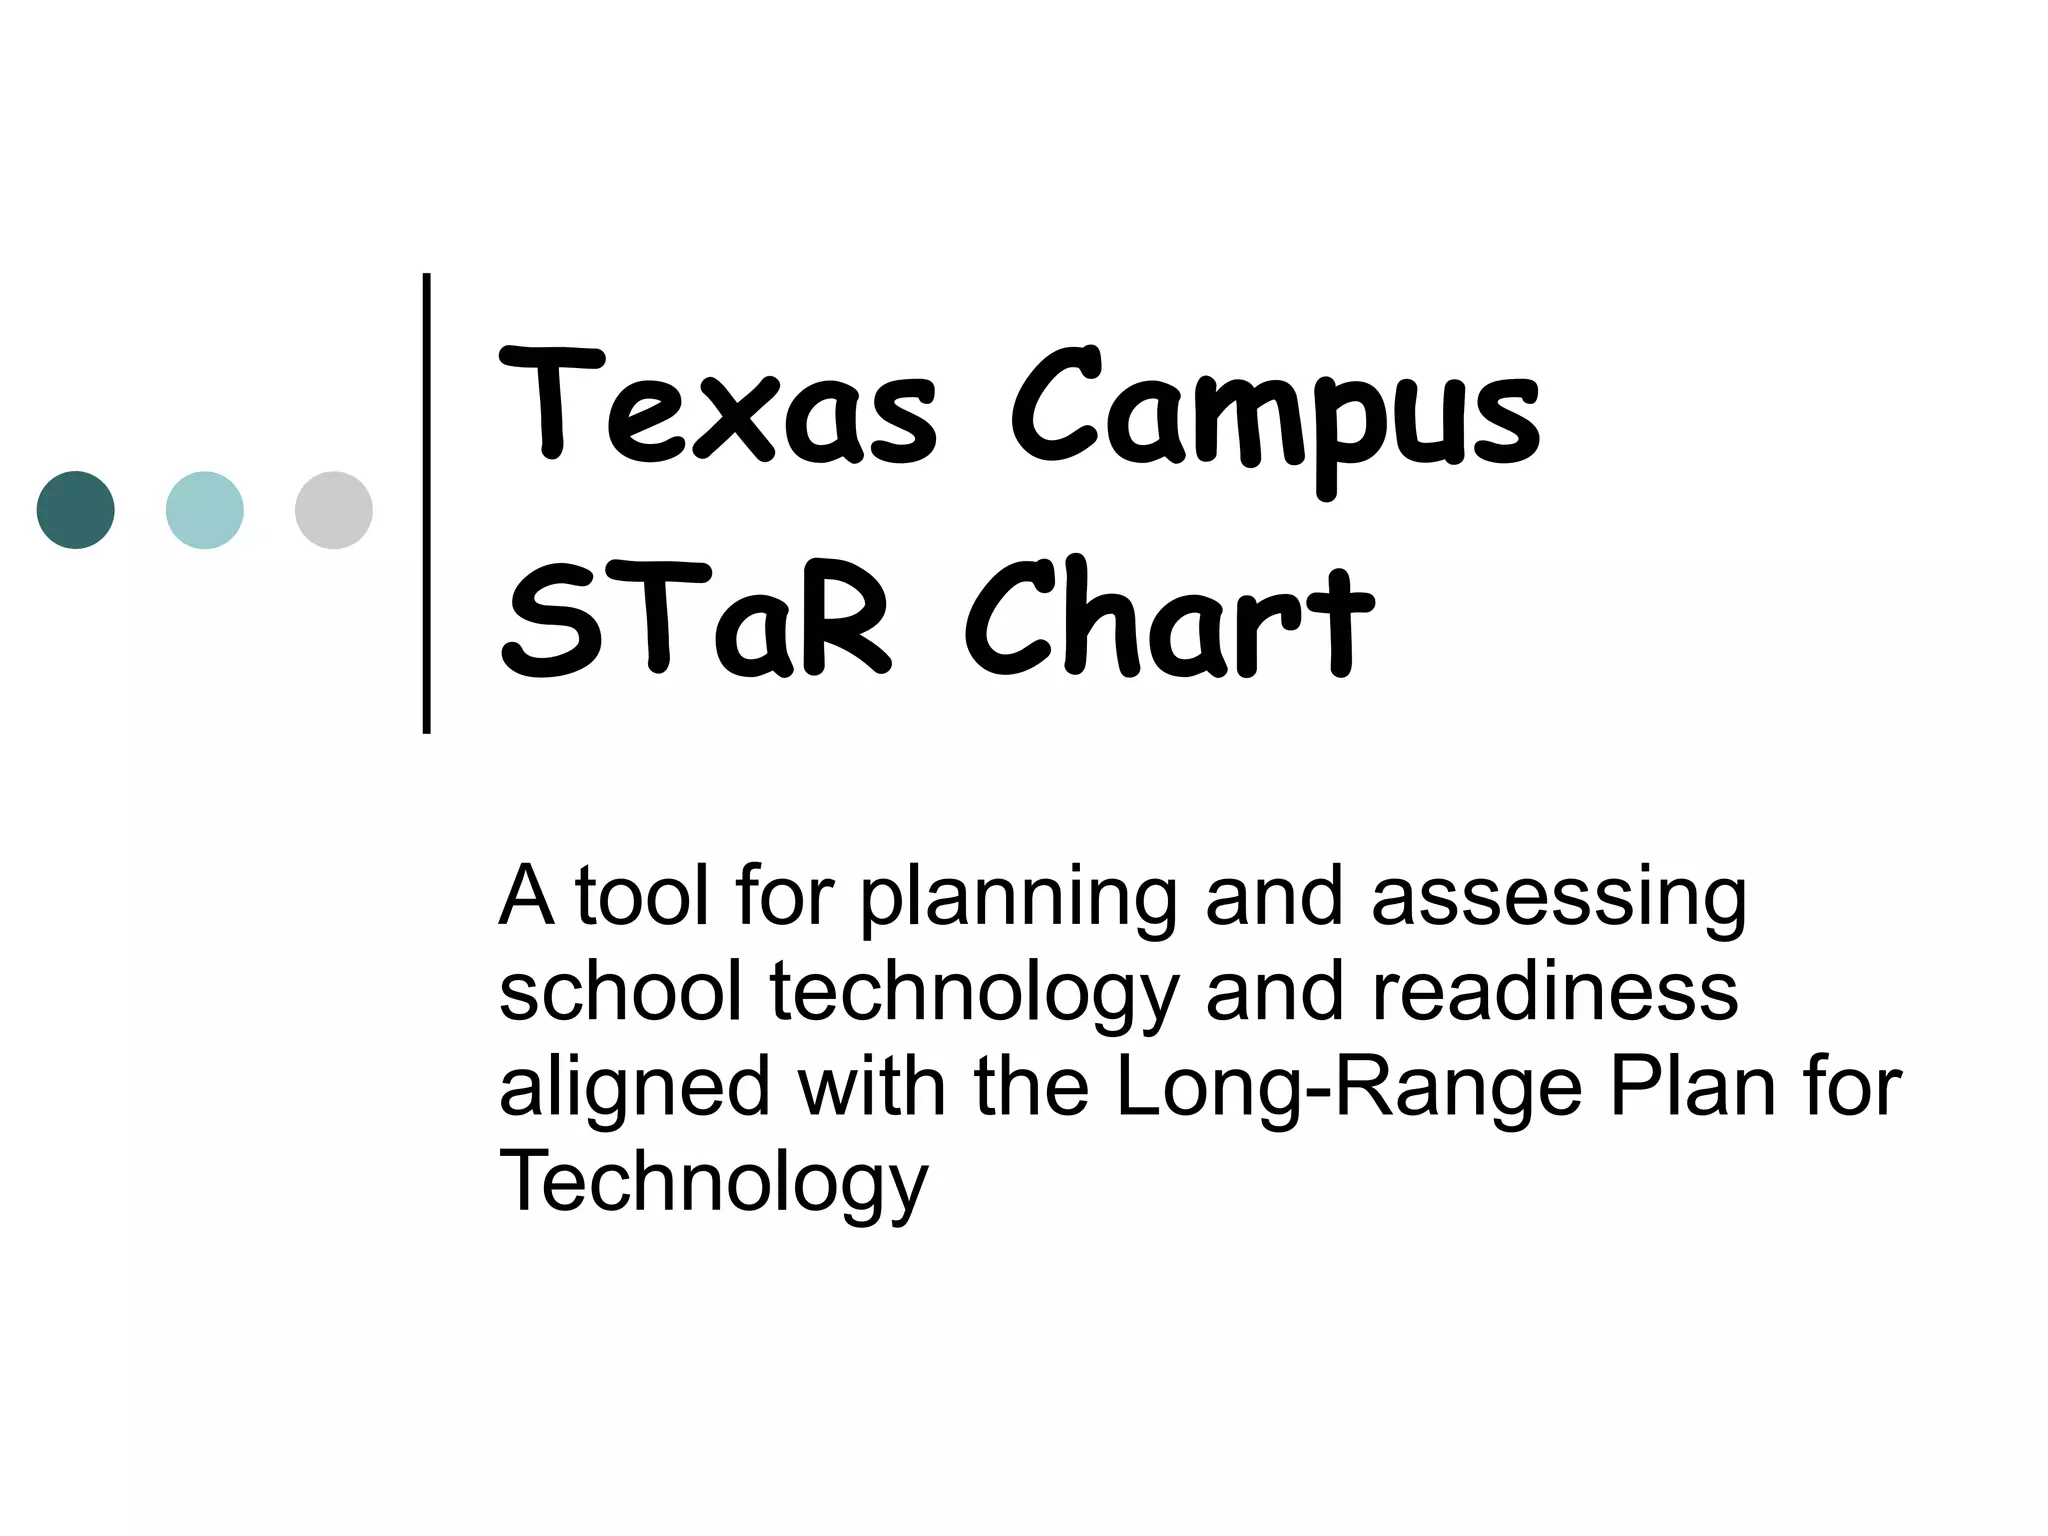
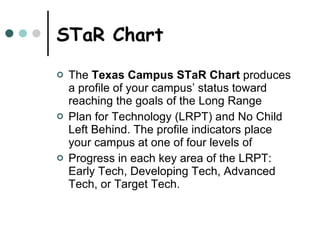
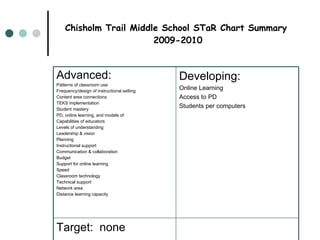
Texas Campus STaR Chart A tool for planning and assessing school technology and readiness aligned with the Long-Range Plan for Technology
STaR Chart The  Texas Campus STaR Chart  produces a profile of your campus’ status toward reaching the goals of the Long Range Plan for Technology (LRPT) and No Child Left Behind. The profile indicators place your campus at one of four levels of Progress in each key area of the LRPT: Early Tech, Developing Tech, Advanced Tech, or Target Tech.
Chisholm Trail Middle School Teaching and Learning= Advanced Educator Preparation and Development= Advanced Leadership, Administration, and Instructional Support= Advanced Infrastructure for Technology= Advanced
Chisholm Trail Middle School 2009-2010= Advanced 2008-2009= Advanced 2007-2008= Advanced
Chisholm Trail Middle School Let’s not “stay put” at  Advanced Our target goal for technology= Target
Chisholm Trail Middle School STaR Chart Summary  2009-2010 Target:  none Developing: Online Learning Access to PD Students per computers Advanced: Patterns of classroom use Frequency/design of instructional setting Content area connections TEKS implementation Student mastery PD, online learning, and models of Capabilities of educators Levels of understanding Leadership & vision Planning Instructional support Communication & collaboration Budget Support for online learning Speed Classroom technology Technical support Network area Distance learning capacity
Chisholm Trail Goals Students per computers will score Target. Find access to PD Provide online learning
STaR Chart The Texas Campus STaR Chart Will Help Campuses and Districts Answer Critical Questions 1) What are your campus’ and district’s current educational technology profiles?
STaR Chart 2) What evidence can be provided to demonstrate their progress is meeting the goals of the Long Range Plan for Technology?
STaR Chart 3) What areas should your campus and district focus on to improve the level of technology integration to ensure the best possible teaching and learning for all students?
STaR Chart “ Learning and teaching must be different.”
STaR Chart http://www.tea.state.tx.us/starchart Researchers, technology planning teams, and interested citizens may now review Texas STaR Chart summary data at http://www.tea.state.tx.us/starchart/search

Texas campus s ta r chart

  • 1.
    Texas Campus STaRChart A tool for planning and assessing school technology and readiness aligned with the Long-Range Plan for Technology
  • 2.
    STaR Chart The Texas Campus STaR Chart produces a profile of your campus’ status toward reaching the goals of the Long Range Plan for Technology (LRPT) and No Child Left Behind. The profile indicators place your campus at one of four levels of Progress in each key area of the LRPT: Early Tech, Developing Tech, Advanced Tech, or Target Tech.
  • 3.
    Chisholm Trail MiddleSchool Teaching and Learning= Advanced Educator Preparation and Development= Advanced Leadership, Administration, and Instructional Support= Advanced Infrastructure for Technology= Advanced
  • 4.
    Chisholm Trail MiddleSchool 2009-2010= Advanced 2008-2009= Advanced 2007-2008= Advanced
  • 5.
    Chisholm Trail MiddleSchool Let’s not “stay put” at Advanced Our target goal for technology= Target
  • 6.
    Chisholm Trail MiddleSchool STaR Chart Summary 2009-2010 Target: none Developing: Online Learning Access to PD Students per computers Advanced: Patterns of classroom use Frequency/design of instructional setting Content area connections TEKS implementation Student mastery PD, online learning, and models of Capabilities of educators Levels of understanding Leadership & vision Planning Instructional support Communication & collaboration Budget Support for online learning Speed Classroom technology Technical support Network area Distance learning capacity
  • 7.
    Chisholm Trail GoalsStudents per computers will score Target. Find access to PD Provide online learning
  • 8.
    STaR Chart TheTexas Campus STaR Chart Will Help Campuses and Districts Answer Critical Questions 1) What are your campus’ and district’s current educational technology profiles?
  • 9.
    STaR Chart 2)What evidence can be provided to demonstrate their progress is meeting the goals of the Long Range Plan for Technology?
  • 10.
    STaR Chart 3)What areas should your campus and district focus on to improve the level of technology integration to ensure the best possible teaching and learning for all students?
  • 11.
    STaR Chart “Learning and teaching must be different.”
  • 12.
    STaR Chart http://www.tea.state.tx.us/starchartResearchers, technology planning teams, and interested citizens may now review Texas STaR Chart summary data at http://www.tea.state.tx.us/starchart/search