Download to read offline
![International Journal of Data Mining & Knowledge Management Process (IJDKP) Vol.7, No.1, January 2017
DOI: 10.5121/ijdkp.2017.7101 1
TERRORIST WATCHER: AN INTERACTIVE WEB-
BASED VISUAL ANALYTICAL TOOL OF TERRORIST’S
PERSONAL CHARACTERISTICS
Samah Mansoour
School of Computing and Information Systems, Grand Valley State University,
Michigan, USA
ABSTRACT
Terrorism is a phenomenon that rose to its peak nowadays. Counter terrorism analysts work with a large
set of documents related to different terrorist groups and attack types to extract useful information about
these groups’ motive and tactics. It is evident that terrorism became a global threat and can exist
anywhere. In order to face this phenomenon, there is a need to understand the characteristics of the
terrorists in order to find if there are general characteristics among all of them or not. However, as the
number of the collected documents increase, deducing results and making decisions became more and
more difficult to the analysts. The use of information visualization tools can help the analysts to visualize
the terrorist characteristics. However, most of the current information visualization tools focus only on
representing and analyzing the terrorist organizations, with little emphasis on terrorist’s personal
characteristics. Therefore, the current paper presents a visualization tool that can be used to analyze the
terrorist’s personal characteristics in order to understand the production life cycle of a terrorist and how
to face it.
KEYWORDS
Terrorism, Terrorism analyst, Visualization, multiple views, data analytics.
1. INTRODUCTION
Terrorism existed since before the dawn of recorded history [5]. It becomes a concern to
governments and a topic of interest to scholars. The ease of information transfer and the
availability of the mass destruction weapons to small terrorist groups present danger to the
security of the world. Most of the currently available tools and research focus on analyzing and
understanding the terrorist organizations as a whole and the relationships among those
organizations. Given the fact that the terrorism dominates global news and politics, it is
remarkable how little we know about the members of those terrorist groups. There is an
increasing need to study and understand the personal and demographic characteristics of the
terrorists as well as their motivations. Therefore, there is a growing interest and a need in using
visualization tools to make the analysis process more efficient, effective, and easier to perform.
Visualization is a promising solution because it takes advantage of the parallel processing
capabilities of the human visual system and thus it allows for analyzing large quantities of data at
a glance [1]. Moreover, visualization allows analysts to learn from exploration and to spot
unexpected trends.](https://image.slidesharecdn.com/7117ijdkp01-170207105731/85/TERRORIST-WATCHER-AN-INTERACTIVE-WEBBASED-VISUAL-ANALYTICAL-TOOL-OF-TERRORIST-S-PERSONAL-CHARACTERISTICS-1-320.jpg)
![International Journal of Data Mining & Knowledge Management Process (IJDKP) Vol.7, No.1, January 2017
DOI: 10.5121/ijdkp.2017.7101 1
TERRORIST WATCHER: AN INTERACTIVE WEB-
BASED VISUAL ANALYTICAL TOOL OF TERRORIST’S
PERSONAL CHARACTERISTICS
Samah Mansoour
School of Computing and Information Systems, Grand Valley State University,
Michigan, USA
ABSTRACT
Terrorism is a phenomenon that rose to its peak nowadays. Counter terrorism analysts work with a large
set of documents related to different terrorist groups and attack types to extract useful information about
these groups’ motive and tactics. It is evident that terrorism became a global threat and can exist
anywhere. In order to face this phenomenon, there is a need to understand the characteristics of the
terrorists in order to find if there are general characteristics among all of them or not. However, as the
number of the collected documents increase, deducing results and making decisions became more and
more difficult to the analysts. The use of information visualization tools can help the analysts to visualize
the terrorist characteristics. However, most of the current information visualization tools focus only on
representing and analyzing the terrorist organizations, with little emphasis on terrorist’s personal
characteristics. Therefore, the current paper presents a visualization tool that can be used to analyze the
terrorist’s personal characteristics in order to understand the production life cycle of a terrorist and how
to face it.
KEYWORDS
Terrorism, Terrorism analyst, Visualization, multiple views, data analytics.
1. INTRODUCTION
Terrorism existed since before the dawn of recorded history [5]. It becomes a concern to
governments and a topic of interest to scholars. The ease of information transfer and the
availability of the mass destruction weapons to small terrorist groups present danger to the
security of the world. Most of the currently available tools and research focus on analyzing and
understanding the terrorist organizations as a whole and the relationships among those
organizations. Given the fact that the terrorism dominates global news and politics, it is
remarkable how little we know about the members of those terrorist groups. There is an
increasing need to study and understand the personal and demographic characteristics of the
terrorists as well as their motivations. Therefore, there is a growing interest and a need in using
visualization tools to make the analysis process more efficient, effective, and easier to perform.
Visualization is a promising solution because it takes advantage of the parallel processing
capabilities of the human visual system and thus it allows for analyzing large quantities of data at
a glance [1]. Moreover, visualization allows analysts to learn from exploration and to spot
unexpected trends.](https://image.slidesharecdn.com/7117ijdkp01-170207105731/75/TERRORIST-WATCHER-AN-INTERACTIVE-WEBBASED-VISUAL-ANALYTICAL-TOOL-OF-TERRORIST-S-PERSONAL-CHARACTERISTICS-1-2048.jpg)
![International Journal of Data Mining & Knowledge Management Process (IJDKP) Vol.7, No.1, January 2017
2
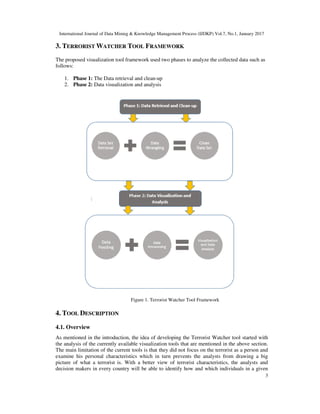
This paper presents, Terrorist Watcher, as a visualization tool to focus on the terrorist as a person
rather than the organization as a whole. Terrorist Watcher can support the counter terrorism
analysts to:
• analyze the personal characteristics of the terrorist and understand the relationship among
them.
• examine how the terrorists that are from the same region can share similar demographic and
behavioural characteristics.
Terrorist Watcher provides different levels of data analysis ranges from grouping visualizations to
detailed visualizations. The design is human-centric that is based on simple interactive
dashboards, bar charts, scatterplots, and a dynamic query tool. Those visualizations were selected
because of their familiarity and ease of use. An in-depth description of the design choices is
provided in section 3. The main contribution of this research can be summarized as follows:
• The focus is shifted from group based examination to individual based examination.
• The development of a web based tool that can be approachable and informative to the
analysts.
This paper is organized as follows: section 2 provides a review of background and related work;
section 3 presents the tool description; section 4 introduces a case study; section 5 discusses the
future work, and the final section presents the conclusion.
2. BACKGROUND AND RELATED WORK
Terrorism becomes a critical problem for many countries. The human nature has not been
changed but the elements that can make a terrorist has been changed. The greatest security threat
that faces any country is not from well identified enemies but from terrorist organizations that
target innocent people or forces informally. Those organizations use terror at any time and any
place with the goal of spreading fear and instability in any country. The best choice to fight
terrorism is through knowledge [7]. There is a noticeable increase in the number of literature
related to terrorism as well as an increased interest in studying the terrorism phenomena.
However, it is difficult to gain access to relevant data. Most of the available data are incomplete
and they are not well presented. Several tools have appeared during the last few years with
different concentration areas. World of Terror [10] is an interactive visualization of the 25 most
prolific global terrorist groups and their activities since 1970. It shows the number of incidents for
each group, along with the numbers killed and wounded, for each year the group was active.
Global Terrorism-Visualization (GTD) [2] consists of information on date, location, number of
people killed and injured, weapons used, intention, group or individual involved and target. GTD
Explorer is an interactive visualization tool that allows users to explore the trend of terrorism
incidents over time [4]. Another interactive visualization tool is Jigsaw [8]. It represents
documents and their entities such as people, places, dates or organizations to help analysts
examine reports more efficiently. All of these tools are designed either to examine or visualize
the different terrorist groups and how they are connected with each other or to visualize the
different terrorist attacks. There is no tool that is developed to visualize the characteristics of the
terrorists themselves as individuals. The tool that will be presented in this paper will add this new
dimension to the terrorism visualization tools.](https://image.slidesharecdn.com/7117ijdkp01-170207105731/85/TERRORIST-WATCHER-AN-INTERACTIVE-WEBBASED-VISUAL-ANALYTICAL-TOOL-OF-TERRORIST-S-PERSONAL-CHARACTERISTICS-2-320.jpg)
![International Journal of Data Mining & Knowledge Management Process (IJDKP) Vol.7, No.1, January 2017
6
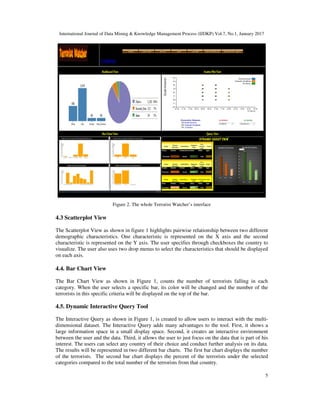
5. CASE STUDY
This section will present a real example to describe the Terrorist Watcher capabilities in a more
integrated fashion and to give an idea about what kind of information can be extracted with it.
The data will be collected, visualized and analysed according to the framework that was
presented in section 3.
5.1. The Data retrieval and clean-up
In this section the researcher presents a real-world example to describe the Terrorist Watcher
capabilities in a more integrated fashion and to give an idea about what kind of information the
analyst can extract. The case study used John Jay & ARTIS Transnational Terrorism Database
(JJATT) [3]. The terrorists in the JJATT database are those who have directly contributed to the
occurrence of terrorist attacks through participation in active terrorist networks. JJATT describes
various demographic, organizational, and behavioral characteristics of individuals within the
database. Demographic data contain socio-economic and country-specific information.
Organizational data describe the positions that individuals attained within their respective groups.
Some records have some missing data. In this case, the whole record was deleted in order to
provide accurate results. Table 1 presents all the characteristics and the value of each
characteristic.
Table 1. Used personal characteristics and their values
Database Attributes Codebook
EdAchv Education Achievement
Highest educational level achieved by the individual
Value Label
0 Less than High School
1 High School (completed)
2 Some College
3 Bachelor’s
4 Graduate
FSES Family SES
For the first 10 years of life
Value Label
0 Lower
1 Middle
2 Upper
POS Position in Organization
Value Label
1 Amir
2 Military Committee
3 Religious/Fatwa/Ideology Committee
4 Finance
5 Logistics
6 Local Leader
7 Regional Leader
8 Central Leader
9 General Subordinate](https://image.slidesharecdn.com/7117ijdkp01-170207105731/85/TERRORIST-WATCHER-AN-INTERACTIVE-WEBBASED-VISUAL-ANALYTICAL-TOOL-OF-TERRORIST-S-PERSONAL-CHARACTERISTICS-6-320.jpg)
![International Journal of Data Mining & Knowledge Management Process (IJDKP) Vol.7, No.1, January 2017
12
Unlike other existing tools, the presented tool in this paper focuses on the characteristics of the
individual terrorists rather than focusing on the terrorist groups and organizations. This enables
the analysts of different countries to focus on the characteristics of the terrorists from the aspect
of their countries only. The presented tool introduces a suite of views that highlight Terrorists
characteristics as well as relationships between the characteristics. Through the interactive
exploration, the analysts will be able to form a mental model about the terrorists’ characteristics
in each country.
Terrorist Watcher acts as a visual index that present data in a form that are more easily to be
perceived and examined by analysts. The implemented approach is to develop a tool that contains
multiple views with simple and clear interaction as well as providing the analysts with more
details based on demand through the interactive queries. The development of simple, interactive,
informative, and easy to use visualization tool is the main contribution of this research.
.
REFERENCES
[1] C. Healey and J. Enns. Large datasets at a glance: Combining textures and colors in scientific
visualization. IEEE Transactions on Visualization and Computer Graphics , 5(2):145–167, 1999.
[2] C. Yang (2014). Global Terrorism Visualization (Visualizing.org)
http://visualizing.org/visualizations/global-terrorism-
visualization?utm_source=Visualization&utm_medium=Social&utm_campaign=Daily.
[3] John Jay & ARTIS Transnational Terrorism Database. Retrieved from
http://doitapps.jjay.cuny.edu/jjatt/attributes.php
[4] Lee,J(2008). Exploring Global Terrorism Data: A Web-based Visualization of Temporal Data.
Retrieved from http://www.cs.umd.edu/hcil/gtd/gtd/intro.html
[5] Merari, A. and Friedland, N. (1985). Social psychological aspects of political terrorism. In
Visualization. In 2007 IEEE Symposium on Visual Analytics Science and Technology
[6] N. Puliyambalath (2014) Interactive HTML Reporting Using D3. Retrieved from
http://www.mwsug.org/proceedings/2014/DV/MWSUG-2014-DV09.pdf
[7] Ressler, Steve. “Social Network Analysis as an Approach to Combat Terrorism: Past, Present, and
Future Research.” Homeland Security Affairs . Vol. 2, No. 2 (July, 2006): 1-10.
[8] S.John, C.Görg, and R. Spence (2007). Jigsaw: Supporting Investigative Analysis Through Interactive
[9] S. Oskamp (Ed.), Applied Social Psychology Annual (Vol. 6): International Conflict and National
Public Policy Issues (pp. 185–205). London: Sage.
[10] T.Korte (2014). A World of Terror: the Impact of Terror in the World - information aesthetics.
Retriedn from
http://infosthetics.com/archives/2014/08/a_world_of_terror_the_impact_of_terror_in_the_world.html](https://image.slidesharecdn.com/7117ijdkp01-170207105731/85/TERRORIST-WATCHER-AN-INTERACTIVE-WEBBASED-VISUAL-ANALYTICAL-TOOL-OF-TERRORIST-S-PERSONAL-CHARACTERISTICS-12-320.jpg)

The document presents 'Terrorist Watcher', an interactive web-based tool designed to visualize the personal characteristics of terrorists, facilitating more precise analysis for counter-terrorism analysts. Unlike existing tools focusing on terrorist organizations, this tool emphasizes individual characteristics and includes multiple visualization methods such as dashboards and scatterplots, allowing analysts to identify patterns among terrorists within similar regions. The paper discusses the framework, features, and future enhancements of the tool aimed at improving the understanding of terrorism through detailed demographic and behavioral data.


![10[1].1.1.115.9508](https://cdn.slidesharecdn.com/ss_thumbnails/101-1-1-115-9508-101121024800-phpapp01-thumbnail.jpg?width=640&height=640&fit=bounds)


