Downloaded 59 times

![1. REGIONAL DEVELOPMENT IN CHILE: TRENDS, ACHIEVEMENTS AND CHALLENGES
Institutions in Chile have been strong and reliable with favourable effects
on growth. The quality of institutions and the stability of Chile’s regulatory
framework are comparable to those of OECD countries.1 National regulations
in Chile focus on full disclosure of public information and sanctions of
irregularities, thereby encouraging good governance practices with a view to
strengthening the country’s democratic system. The stability of the national
regulations applied to foreign investment is internationally recognised. This
stable regulatory framework and solid macroeconomic management have
helped to create the conditions for growth.
The overall Chilean economic outlook shifted drastically during the last
quarter of 2008 with the world economic crisis. The exchange rate has
depreciated significantly in nominal terms. Growth and domestic demand
decelerated significantly. Meanwhile, during the first months of 2009, Chile faced
a sharp terms of trade shock, reflected by a severe drop in international copper
prices, which fell to an averaged USD 1.50 a pound after reaching nearly USD 4 in
the first half of 2008. Nevertheless, the structural surplus and the stabilisation
funds accumulated during the “prosperous” years, are now available for judicious
use. In this regard, in response to the crisis, the government announced a
USD 4 billion (2.8% of GDP) fiscal stimulus package in January 2009, boosting
public investment programmes and transfers. This stimulus package includes
among others, investments in infrastructure, small enterprise development, and
subsidies to low income households. As in other countries, regional policies could
offer an important tool for the allocation of public investment for maximum long-
term impact in terms of productivity growth.
Challenges
Productivity and innovation
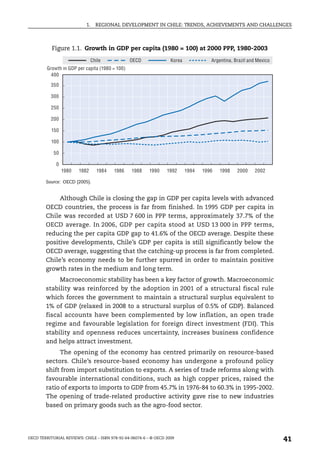
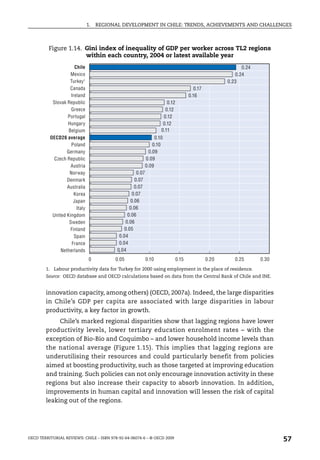
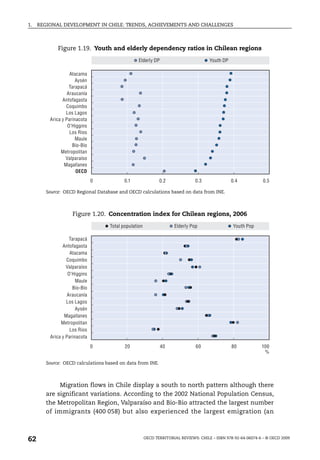
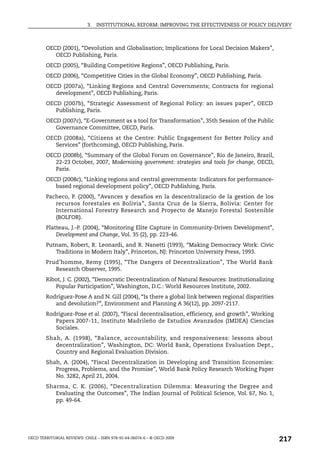
The productivity gap has widened in recent years. Chile’s productivity
remains low by OECD country standards. Total factors productivity (TFP), the
efficiency with which inputs are combined to produce outputs, is estimated to
have accounted for about one-third of GDP growth in the 1990s (OECD, 2005).
This suggests that there is room to lift GDP growth further by some
combination of faster growth in the quantity and quality of labour inputs,
physical capital accumulation, and more efficient ways of using inputs, which
can be achieved through technological deepening (i.e. innovation).
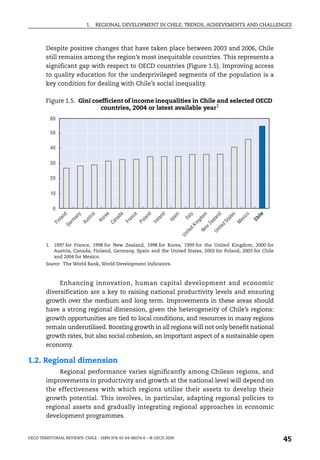
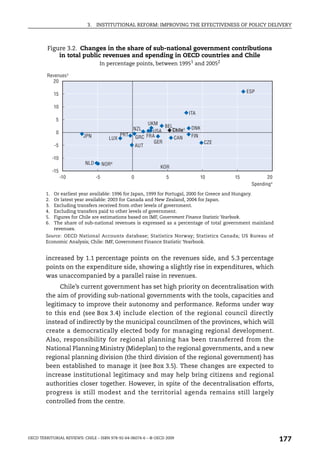
Furthermore, in contrast to income levels, the productivity gap between Chile
and the OECD average has widened in recent years (Figure 1.2).
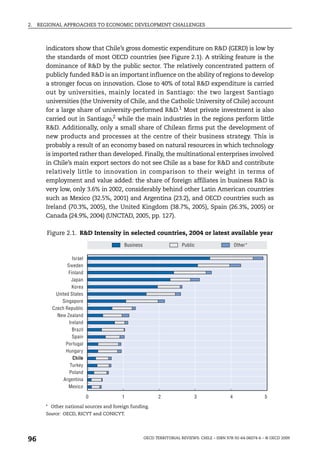
Innovative practices and production methods should be further pursued.
At 0.68% (2004), Chile’s total R&D intensity (the ratio of gross expenditure on
research and development [GERD] to GDP) is less than one-third of the OECD
average of 2.25% (2003). Furthermore innovation in Chile is primarily financed
42 OECD TERRITORIAL REVIEWS: CHILE – ISBN 978-92-64-06074-6 – © OECD 2009](https://image.slidesharecdn.com/territorialreviewchilevfjun09-090803035645-phpapp01/85/Territorial-Review-Chile-Jun09-OECD-42-320.jpg)
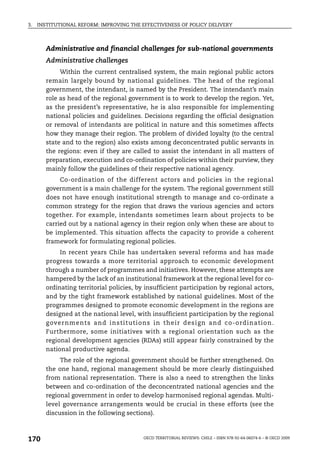
![1. REGIONAL DEVELOPMENT IN CHILE: TRENDS, ACHIEVEMENTS AND CHALLENGES
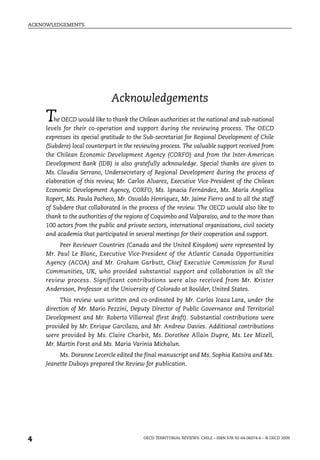
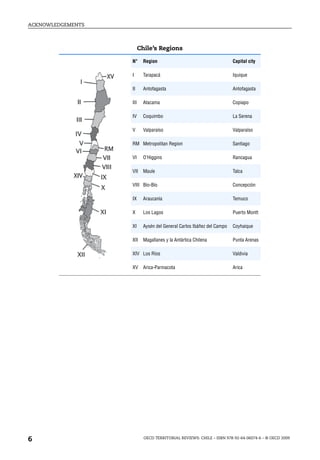
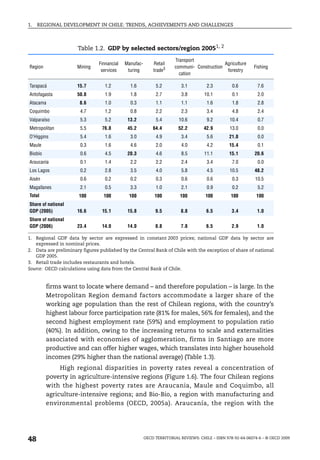
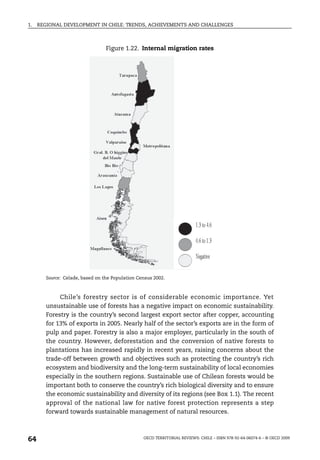
Territorial units – Chile’s administrative system
Chile is a centralised unitary state. At the sub-national level there are
t h re e m a i n t e r r i t o r i a l u n i t s , e a ch w i t h d i f f e re n t a d m i n i s t ra t ive
responsibilities: 15 regions, 52 provinces and 345 municipalities (comunas).2
Yet, under the tight administrative, fiscal and regulatory framework of the
central state, the main sub-national actors remain largely controlled by
national guidelines (this issue is examined in Chapter 3). The composition,
organisation and function of the different regional, provincial and local
governments are summarised in Table 1.1. This territorial review focuses on
13 regions for which data are available (the regions of Los Ríos [previously part
of the region of Los Lagos] and Arica y Parinacota [on the northern border with
Peru, formerly part of the region of Tarapacá] were added to the previously
existing 13 regions in 2007).
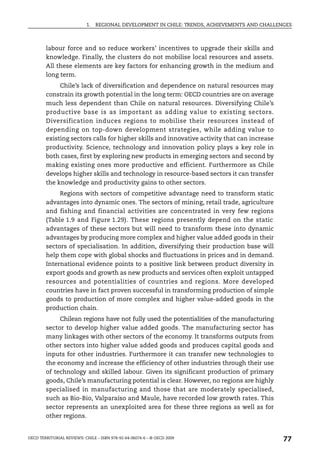
Measuring economic performance in the regions
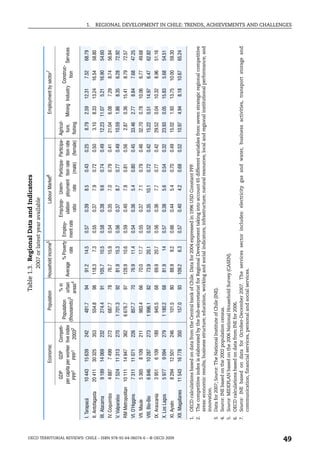
The geographical structure, characteristics and assets of Chile’s regional
economies are particularly diverse. However, Chile’s economy depends on a
few sectors. In the north mining is the dominant sector. In the metropolitan
region, industry and financial services prevail. Finally, agriculture, forestry and
fishing are the leading sectors in the centre and south of the country. Indeed,
sectors are largely located in a small number of regions, which receive much
of the private and public investment. Mining (23% of GDP in 2006) and
financial services (14% of GDP) are largely located in Antofagasta and the
Metropolitan Region, respectively. Antofagasta alone accounts for close to 50%
of the GDP from the mining sector (year 2005); when including Tarapaca and
Atacama, the two other main northern mining regions, the share increases to
close to 75%. Likewise, the Metropolitan Region accounts for nearly 77% of GDP
from financial services (see Table 1.2).
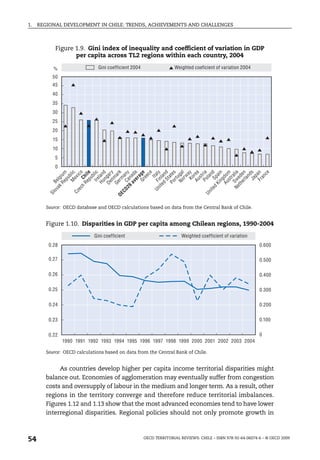
Mining-intensive regions and the capital region (Región Metropolitana
referred to as the Metropolitan Region of Santiago, RM) display the highest
GDP per capita among Chilean regions. The highest GDP per capital levels are
recorded in the northern regions of Antofagasta (USD 20 411 in 2004 PPP) and
Tarapacá (USD 10 443), which have intensive mining, along with the sparsely
populated southern region of Magallanes (USD 11 543) and the Metropolitan
Region (USD 10 111). Their GDP per capita levels are up to five times higher
than in La Araucania (USD 3 951) and Coquimbo (USD 4 887) (Table 1.3).
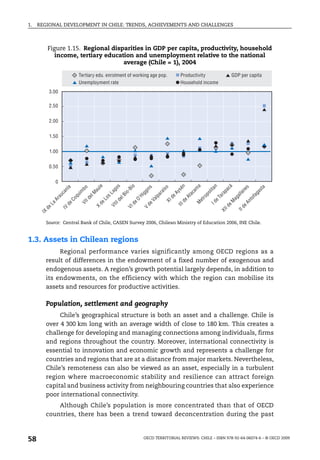
The Metropolitan Region of Santiago, home to 40% of Chile’s population,
has the highest labour force participation and household income. This densely
populated Region attracts a considerable share of business activity and labour
demand mainly owing to the benefits of agglomeration. People want to live
where firms – and therefore job opportunities – are concentrated. For their part,
46 OECD TERRITORIAL REVIEWS: CHILE – ISBN 978-92-64-06074-6 – © OECD 2009](https://image.slidesharecdn.com/territorialreviewchilevfjun09-090803035645-phpapp01/85/Territorial-Review-Chile-Jun09-OECD-46-320.jpg)


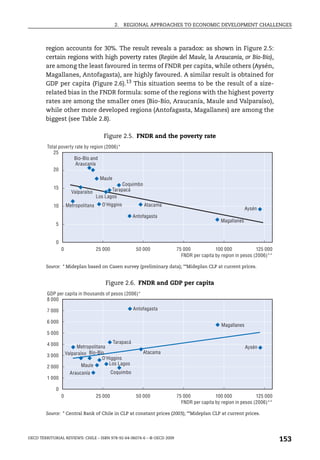


The document is an OECD territorial review of Chile. It discusses Chile's regional development trends, achievements, and challenges. Some key points: - Chile has a three-tiered government system of 15 regions, 52 provinces, and 345 municipalities. There are significant economic disparities between regions. - Rural regions face challenges of declining populations, lack of economic opportunities, and poor access to services. The urban metropolitan region around Santiago faces issues of congestion and pollution. - Regional development agencies aim to coordinate productive development and support innovation, MSMEs, and human capital development. However, their approach remains somewhat centralized. - Education is emphasized as a priority to boost human capital and territorial competitiveness,