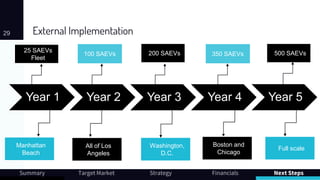
This document provides an executive summary for a case competition presentation proposing a shared autonomous electric vehicle (SAEV) mobility service called "SAEV Mobility". The 3-sentence summary is:
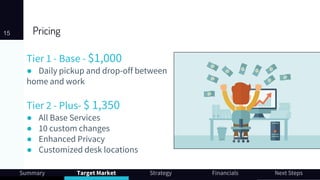
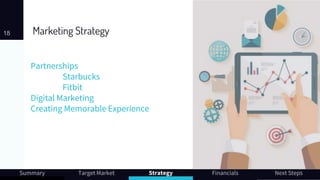
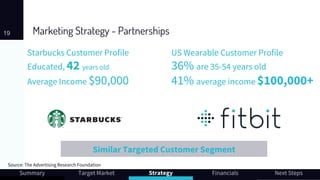
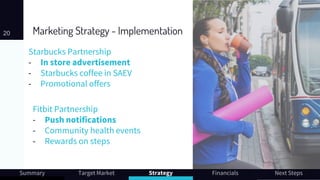
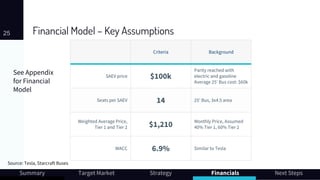
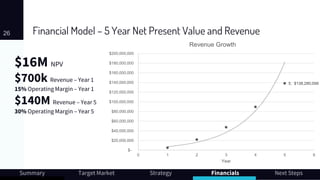
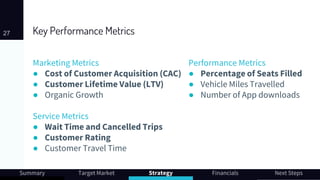
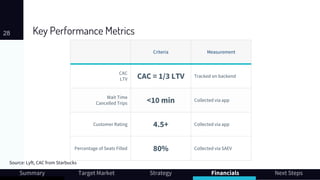
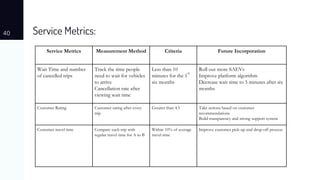
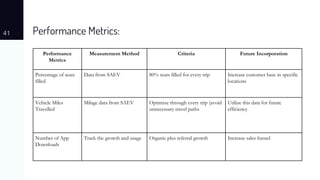
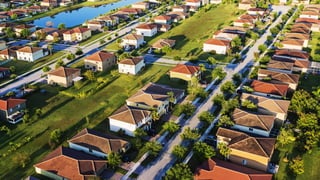
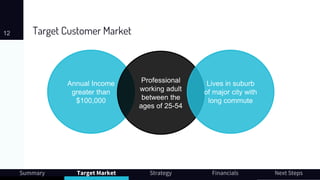
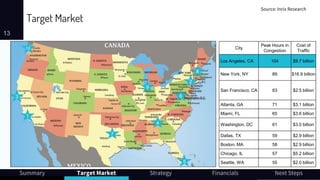
SAEV Mobility proposes a shared autonomous electric vehicle service targeting professional commuters in Los Angeles suburbs, with financial projections showing over $16 million in net present value over 5 years. Key aspects of the proposal include targeting commuters spending over $1,350 annually on their commute who are willing to pay for the SAEV service, with marketing partnerships planned with Starbucks and Fitbit to reach those customers. Metrics such as customer wait times, ratings, and vehicle occupancy rates are identified to track the service's performance.


![Willingness to Pay14
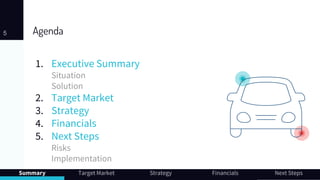
Summary Target Market Strategy Financials Next Steps
▹$520 – Vehicle Use
▹$290 – Time Value [1]
▹$190 – Wear and Tear [2]
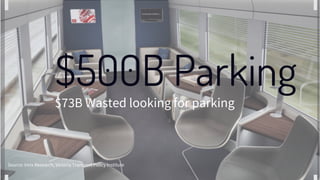
▹$200 – Parking
▹$150 – Gas
$1,350
Source: Journal of Public Economics, AAA](https://image.slidesharecdn.com/simonturbochargers-carnegiemellon-190330213301/85/Tepper-Tech-Innovation-Case-Competition-14-320.jpg)