
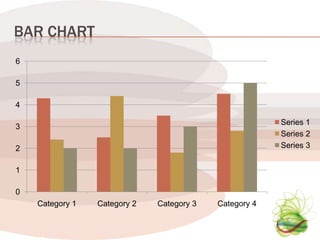
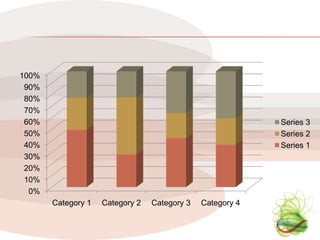
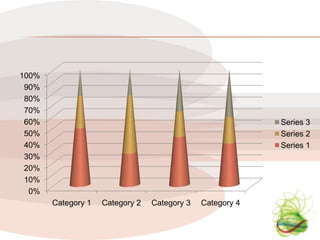
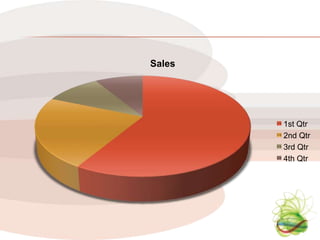
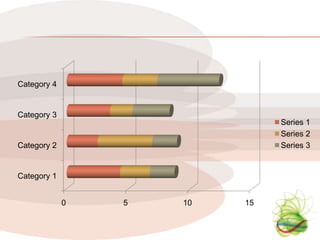
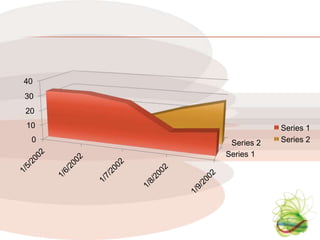
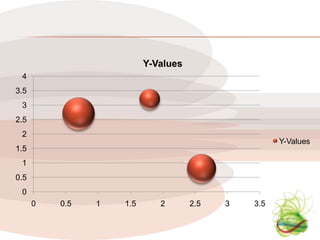
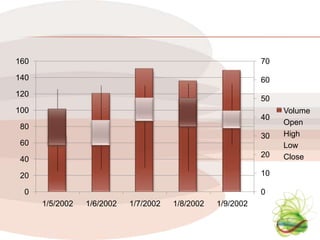


The document contains several charts and graphs: - A bar chart with 3 data series showing values for 4 categories. - Three pie charts comparing the same 3 data series across the same 4 categories. - A line chart tracking sales for 4 quarters. - A bar chart comparing the first 3 data series for 4 categories. - A scatter plot showing a relationship between x and y values. - A line chart showing stock price and volume data over 5 days.