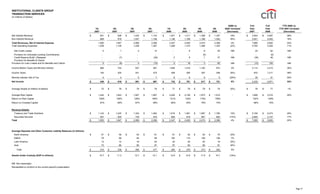
Citigroup reported financial results for the 4th quarter of 2008. Net income decreased 16% to a loss of $8.3 billion compared to a loss of $9.8 billion in 4th quarter 2007. Total revenues declined 13% to $5.6 billion. The provision for loan losses increased 66% to $12.7 billion due to higher credit costs. Total assets decreased 11% to $1.9 trillion and book value per share declined 35% to $14.70.
Citigroup reported quarterly financial results for 4Q08. Net income decreased 16% to $8.3 billion compared to 4Q07. Total revenues decreased 13% to $5.6 billion due to declines in principal transactions and other revenue. The provision for loan losses increased 66% to $12.7 billion, reflecting higher net charge-offs. Total assets declined 11% to $1.9 trillion as trading account assets fell 29% and loans decreased 11%.
Citigroup reported financial results for the third quarter of 2008. Net income decreased significantly compared to the third quarter of 2007, dropping from $2.2 billion to a $2.8 billion loss. Total revenues declined 23% versus the prior year. The provision for loan losses increased 86% to $9.1 billion due to higher credit costs. Expenses rose modestly while assets and loans declined year-over-year. Overall, Citigroup experienced weak results across business segments as the financial crisis impacted performance.
- Citigroup reported a net loss of $2.5 billion in 2Q08, compared to net income of $6.2 billion in 2Q07, as revenues declined 29% while credit costs rose.
- Total revenues were $18.7 billion in 2Q08, down 29% from 2Q07, as non-interest revenues fell 71% due to losses in principal transactions and lower commissions and fees.
- Provisions for credit losses and benefits and claims increased to $7.2 billion in 2Q08 from $2.7 billion in 2Q07, driven by higher loan loss provisions.
- All business segments except Latin America reported lower net income, with Global Cards down
Citigroup reported financial results for the third quarter of 2007. Net income was $2.2 billion, down 60% from the third quarter of 2006. Total assets reached $2.36 trillion at the end of the quarter, up 35% year-over-year. However, key capital ratios such as Tier 1 capital and leverage declined compared to the prior year. Earnings per share from continuing operations were $0.44, down 58% from the previous year. While several business segments saw revenue declines, Global Consumer revenues remained strong, particularly in U.S. Cards.
This document provides quarterly financial data for Citigroup, including:
1) Income statements for Citigroup's major business segments by both product view and regional view, showing income from continuing operations for 2003 and 2002.
2) Key financial metrics for Citigroup such as revenues, assets, capital ratios, and earnings per share for 2003 and 2002.
3) Supplementary financial details including statements of income, financial position, loan delinquency and more for Citigroup.
The document contains detailed quarterly performance information for Citigroup to allow analysis of results and trends by major business and geographic segments.
This document summarizes Viacom's financial results for the second quarter and first half of 2008. Key highlights include:
- Revenues for Q2 2008 increased 21% to $3.9 billion and increased 18% to $7 billion for the first half.
- Operating income for Q2 2008 increased 13% to $792 million and increased 19% to $1.4 billion for the first half.
- Earnings per share from continuing operations for Q2 2008 increased 2% to $0.64 and increased 15% to $1.06 for the first half.
- Media Networks revenues increased 11% in Q2 2008 and 14% for the first half, driven by increases in affiliate fees
Citigroup reported financial results for the second quarter of 2007. Net income increased 18% year-over-year to $6.226 billion. Revenue grew across most business segments, led by a 64% increase in Markets & Banking revenue. Income from continuing operations rose 18% to $11.238 billion for the first half of the year. However, capital ratios declined slightly due to asset growth outpacing capital increases. Overall, Citigroup achieved strong revenue growth and higher profits compared to the previous year.
Citigroup reported second quarter net income of $5.07 billion, up from $1.14 billion in the same period last year. Revenue was $20.2 billion. Key highlights included growth in customer volumes across most business segments, strong growth in international consumer businesses, and record revenues in transaction services. However, capital markets revenues declined due to difficult market conditions. Expenses declined due to prior year charges, but increased due to investment spending and acquisitions. Credit quality remained stable.
Citigroup reported financial results for the first quarter of 2007, with the following highlights:
- Net income decreased 11% to $5.012 billion compared to $5.639 billion in the first quarter of 2006.
- Revenues increased 15% to $25.459 billion from $22.183 billion, driven by growth in Markets & Banking and Global Consumer segments.
- Markets & Banking revenues increased 23% to $8.957 billion, while Global Consumer revenues grew 10% to $13.106 billion.
- Results were impacted by a $871 million after-tax restructuring charge related to expense reduction initiatives.
Citigroup reported a net loss of $8.29 billion for Q4 2008 and $18.72 billion for the full year. Revenues declined due to write-downs and losses in securities and banking from the economic downturn. Credit costs increased significantly due to higher net credit losses and additions to loan loss reserves across most business segments, especially in North America. Despite cost cutting measures, expenses remained elevated. However, Citigroup strengthened its capital and liquidity positions through initiatives like issuing preferred stock to the U.S. Treasury.
Citigroup reported its quarterly financial results. Total income from continuing operations increased 12% compared to the second quarter of 2002 to $4.3 billion. Revenues increased across most business segments, with Global Consumer up 18% and Global Corporate and Investment Bank up 2%. The Global Consumer segment saw strong growth in retail banking revenues of 63%. Total assets increased to $1.187 trillion in the second quarter of 2003, up from $1.083 trillion in the second quarter of 2002.
Citigroup reported financial results for the first quarter of 2006. Income from continuing operations increased 9% compared to the first quarter of 2005 to $5.6 billion. Global Consumer revenues decreased 1% to $12 billion, with U.S. Consumer revenues decreasing 9% due to declines in cards, retail distribution, and consumer lending. Corporate and Investment Banking revenues increased with Capital Markets and Banking revenues up 20% and Transaction Services up 22%. Overall, Citigroup revenues remained strong with continuing growth in international markets helping to offset declines in the U.S.
- Bank of America reported third quarter 2006 results with total revenue of $18.961 billion, an 11% increase from third quarter 2005, and net income of $5.416 billion, a 20% increase.
- Net interest income was $8.894 billion, a 1% increase, impacted by the sale of Brazilian operations and prior year FAS 133 impact. Noninterest income increased 20% to $10.067 billion.
- Global Consumer & Small Business Banking reported net income of $2.889 billion, a 13% increase, driven by increases in cards, deposits, and debit purchase volume.
- Bank of America reported second quarter 2006 results, with net income of $5.58 billion excluding merger charges, up 4% from the second quarter of 2005.
- The Global Consumer & Small Business Bank saw strong growth, with net income up 42% to $3.11 billion driven by increases in cards and deposits.
- The Global Corporate & Investment Bank reported net income of $1.72 billion, flat compared to the second quarter of 2005.
Olympic Steel reported financial results for the first quarter of 2009 with a net loss of $25.5 million compared to net income of $13.2 million in the first quarter of 2008. Net sales decreased 48.8% to $140.9 million due to a 45.6% decrease in tons sold. The results were negatively impacted by a $30.6 million inventory write-down and weaker demand and pricing due to the economic downturn. The company expects results to improve as market conditions stabilize but approved a reduced quarterly dividend.
The document provides a summary of Citigroup's earnings for the first quarter of 2008. Key points include:
- Net income declined significantly to a $5.1 billion loss compared to a $5 billion profit in Q1 2007.
- Major losses were driven by write-downs on subprime exposures, consumer credit losses, and losses on leveraged finance commitments.
- Revenues declined 48% year-over-year due to losses in fixed income markets and the consumer segment.
- Expenses increased 4% year-over-year due to repositioning charges despite cost cutting efforts.
The 9 months results were as planned. Recurrent revenues were up 31.4% driven by strong growth in net interest income and fees. Active liquidity management improved the loans to deposits ratio. Significant reinforcements were made to provisions to allow the bank to face extreme scenarios. The announced capital increase is well on track and expected to be completed in early December subject to approvals.
Angel Ron presenta los resultados del tercer trimestre 2012Banco Popular
The 9 months results were as planned. Recurrent revenues were up 31.4% driven by strong growth in net interest income and fees. Active liquidity management improved the loans to deposits ratio. Significant reinforcements were made to provisions to strengthen coverage ratios and allow the bank to face severe scenarios. The announced capital increase is well on track and expected to be completed in early December subject to shareholder and regulatory approval.
This document provides historical financial and metric information for Ameriprise Financial, Inc. for full years 2005 and 2006, and quarterly results through third quarter 2007. It includes consolidated income statements, per share summaries, segment income statements and metrics for the Advice & Wealth Management, Asset Management, Annuities, Protection, and Corporate & Other segments. Additional sections provide balance sheet information, capital and ratings details, owned/managed/administered assets, and non-GAAP reconciliations. Key financial metrics such as pretax income margin, net income margin, return on equity, and earnings growth targets are also presented.
Citigroup reported quarterly financial results, with net income of $3.92 billion for 3Q 2002, a 23% increase over 3Q 2001. Core income, which excludes certain items, was $3.79 billion for 3Q 2002, up 17% from the prior year. Diluted earnings per share on net income were $0.76 for the quarter, rising 25% year-over-year, while diluted EPS on core income increased 19% to $0.74. Citigroup operates as a global financial services company with over 200 million customer accounts in more than 100 countries.
Bank of America reported record earnings of $16.9 billion for 2005, up 19% from 2004. Revenue grew 9% to $57.6 billion driven by a 19% increase in noninterest income. Earnings were driven by strong consumer growth and commercial lending recovery, despite higher provision costs and fewer securities gains. For the fourth quarter of 2005, earnings were $3.8 billion, down 9% from the previous quarter due to an 8% decline in noninterest income and a 21% rise in provision for credit losses.
JPMorgan Chase Second Quarter 2008 Financial Results Conference Callfinance2
The document reports JPMorgan Chase's financial results for the second quarter of 2008. It notes a net income of $2 billion, excluding $540 million in losses from Bear Stearns merger-related items. It also discusses increasing credit reserves, markdowns on leveraged lending and mortgage positions, and the completed acquisition of Bear Stearns on May 30, 2008. For the Investment Bank specifically, it provides revenue and net income numbers and notes strong performance in some areas but markdowns on leveraged lending and mortgage-related positions.
JPMorgan Chase reported third quarter 2008 net income of $527 million, which included several significant items related to the Washington Mutual acquisition. Excluding merger-related items, net income was $1.167 billion. Revenue decreased 18% from the previous quarter to $16.088 billion, while credit costs increased 9% to $4.684 billion. Retail Financial Services reported net income of $247 million on total revenue of $4.875 billion, up 16% year-over-year, though credit costs increased due to higher loss estimates for home lending. The Investment Bank reported net income of $882 million on revenue of $4.035 billion, though results were impacted by $3.6 billion in
Citigroup reported record earnings from continuing operations for the first quarter of 2006, with net income of $5.64 billion, up 4% from the previous year. International earnings grew 47% due to record international revenues increasing 19%. Several business segments saw record results, including corporate and investment banking with revenues up 21% and international revenues in that segment up 34%. The company opened 238 new branches during the quarter as it continued expanding its distribution internationally.
This document is BB&T Corporation's 2005 annual report. It provides financial highlights for 2005, noting that net income increased 6.1% to $1.654 billion and diluted earnings per share grew 7.1% to $3.00. Operating earnings rose 7.2% to $1.674 billion. Cash basis operating earnings, which exclude intangible assets and purchase accounting adjustments, increased 7.1% to $1.763 billion. The report discusses BB&T's strong loan, deposit and balance sheet growth in 2005 and notes the bank hired additional revenue producers and implemented strategies to boost organic account growth.
This document provides a summary of Fannie Mae's 2007 10-K investor report. It includes tables showing Fannie Mae's consolidated financial results for 2007 compared to 2006. Net interest income, guaranty fee income, and other revenue were down in 2007 from the prior year due to the severe housing crisis. Fannie Mae reported a net loss in 2007 driven by credit-related expenses from losses on mortgages and mortgage-backed securities. While facing significant challenges from the troubled housing market, Fannie Mae met its obligations under a consent agreement with regulators and remained focused on protecting its capital position.
- BB&T Corporation reported lower operating earnings for the fourth quarter of 2008 compared to the same period in 2007. Operating earnings available to common shareholders decreased 41.4% to $243 million.
- Net interest income increased 14.2% to $1,132 million due to higher interest income, but this was more than offset by a large increase in the provision for credit losses of $344 million.
- Returns and profitability ratios declined from the prior year, with the return on average common equity decreasing to 7.26% and the efficiency ratio worsening to 51.9%.
Bank of America reported second quarter 2007 results. Net income was $5.8 billion, up 4% from the previous year. Revenue increased 8% due to strong noninterest income growth across all business lines. Credit quality remained sound although provision expenses increased due to reserve builds. The company continued to see increases in deposits, assets under management, retail sales and checking account openings.
- The document is Google Inc.'s Form 10-Q filing with the SEC for the quarter ended September 30, 2006.
- It provides Google's condensed consolidated financial statements, including the balance sheet, income statement, and cash flow statement for the periods presented.
- The filing includes notes to the financial statements and sections for management's discussion of financial condition, market risk disclosures, and controls and procedures.
This annual report summarizes Google's financial performance and business activities in 2007. Some key points:
- Revenue grew 48% to $16.6 billion while net income grew 31% to $4.2 billion.
- Google employed over 17,000 people across 20 countries.
- Search and advertising accounted for 70% of resources while applications like Gmail and Docs accounted for 20%. The remaining 10% went to newer areas like Android.
- Major acquisitions included YouTube and DoubleClick to enhance video and display advertising capabilities.
- Products like Google Maps, Earth, and Street View expanded into new areas like satellite imagery and panoramic street views.
- Initiatives aimed to make renewable energy
- Citigroup reported quarterly financial results for 3Q 2000, with net income of $3.088 billion, up 27% from 3Q 1999. Core income was $3.111 billion for the quarter, also up 27% year-over-year.
- Total revenues for Citigroup's Global Consumer segment were $7.515 billion in 3Q 2000, up 5% from 3Q 1999. The Global Corporate and Investment Bank segment reported revenues of $8.097 billion, a 26% increase.
- Total assets reached $805 billion in 3Q 2000, up from $686.8 billion in 3Q 1999. Book value per share increased to $11.55 from $9
Citigroup reported its financial results for the first quarter of 2001. Net income decreased 8% compared to the first quarter of 2000. Core income, which excludes restructuring and accounting items, decreased 7%. Within its Global Consumer segment, Banking/Lending revenues increased 14% driven by growth in North America Cards, CitiFinancial, and Mortgage Banking. Core income for Banking/Lending increased 21% led by gains in North America Cards, CitiFinancial, and Citibanking North America. Overall, Citigroup's Global Consumer business saw revenues increase 10% and core income rise 18% compared to the first quarter of the prior year.
Google reported strong financial results for Q2 2008, with revenue growth of 39% year-over-year and 3% quarter-over-quarter. Google properties revenue grew 42% year-over-year and 4% quarter-over-quarter. International revenues continued to grow strongly, reaching $2.8 billion in Q2. Google also acquired DoubleClick, giving it a leading display advertising platform.
- eBay reported record first quarter financial results for 2007 with net revenues of $1.77 billion, a 27% increase over the previous year.
- GAAP earnings per share were $0.27 and non-GAAP earnings per share were $0.33, both representing increases over the previous year.
- Based on the strong first quarter results, eBay raised its full year 2007 guidance for net revenues and earnings per share.
eBay reported record financial results for Q4 2003, with net revenues of $648 million, up 57% year-over-year. Net income was $142.5 million, or $0.21 per share. For the full year, net revenues were $2.17 billion, up 78%, and net income was $441.8 million, or $0.67 per share. eBay also provided guidance for 2004, estimating net revenues of up to $3 billion and GAAP EPS of up to $0.99.
Citigroup reported first quarter 2022 core income of $3.86 billion, up 5% from the first quarter of 2021. However, core income included an $816 million pre-tax charge related to economic conditions in Argentina. Revenue for the quarter increased 5% to $22 billion. Net income, including a $1.06 billion gain from the Travelers IPO, was $4.84 billion, up 37% from the prior year. The CEO commented that core businesses delivered strong results despite difficult economic conditions and charges related to Argentina. Key highlights included strong performance in global consumer businesses and the investment bank.
- eBay reported record Q4 2004 financial results, with net revenues of $935.8 million, up 44% year-over-year. Net income was $205.4 million, or $0.30 per diluted share.
- For the full year 2004, eBay generated net revenues of $3.27 billion, up 51% from 2003. Net income increased 76% to $778.2 million.
- eBay also announced a two-for-one stock split to take effect in February 2005.
Citigroup reported a net loss of $5.1 billion for the first quarter of 2008, compared to net income of $5 billion for the first quarter of 2007. Revenues declined 48% to $13.2 billion for the quarter. The global consumer business reported a net income of $1.4 billion, down 45% from the prior year, with the U.S. consumer business reporting net income of $279 million, down 84%. Markets and Banking reported a net loss of $5.7 billion for the quarter compared to net income of $2.7 billion in the prior year.
eBay reported record financial results for Q4 2005 and full year 2005. Some key highlights:
- Q4 2005 net revenues reached $1.329 billion, a 42% increase over Q4 2004.
- Full year 2005 net revenues were $4.552 billion, a 39% increase over 2004.
- Q4 2005 earnings per share were $0.20 (GAAP) and $0.24 (pro forma), exceeding guidance.
- For 2006, eBay expects net revenues between $5.7-5.9 billion and earnings per share of $0.65-0.71 (GAAP) and $0.96-1.01 (pro forma).
Citigroup reported financial results for the second quarter of 2000. Core income increased 21% compared to the second quarter of 1999 to $3.007 billion. Total revenues for the quarter were $16.373 billion, a 10% increase year-over-year. Most of Citigroup's business segments saw revenue and core income growth compared to the previous year. Global Consumer revenues were $7.473 billion, up 6% from the second quarter of 1999. Global Corporate and Investment Bank revenues were $7.855 billion, a 13% increase. Citigroup's preliminary Tier 1 capital ratio was 8.6% for the second quarter of 2000.
This document provides quarterly financial data for Citigroup from 2006 to 2008. It includes consolidated income statements, balance sheets, and key metrics by business segment and region. The first page shows high-level financial summary tables with metrics such as total revenues, expenses, earnings per share, and return on equity. Subsequent pages provide more detailed financial statements and supplementary financial ratios to analyze Citigroup's performance.
This document provides quarterly financial data for Citigroup, including income statements, balance sheets, ratios, and other metrics. Some key details:
- For Q3 2003, income from continuing operations was $4.691 billion, up 27% from Q3 2002. Net income was $4.691 billion, up 20% from a year ago.
- Capital ratios like Tier 1 and Total Capital were all above requirements at the end of Q3 2003, with Tier 1 at 9.5% and Total Capital at 12.6%.
- Total assets increased to over $1.208 trillion in Q3 2003, up 17% from a year ago. Stockholders' equity rose
Citigroup reported financial results for the first quarter of 2002, with the following highlights:
- Core income increased 5% compared to first quarter 2001 to $3.859 billion. Net income increased 37% to $4.843 billion, helped by a gain on sale of stock by a subsidiary.
- Global Consumer segment saw increases in core income for Cards (2%), Consumer Finance (35%), and Retail Banking (29%) compared to first quarter 2001.
- Capital ratios improved, with Tier 1 capital ratio at 9.13% versus 8.56% in first quarter 2001, reflecting Citigroup's overall financial strength.
- Total assets were $1.057 trillion
Citigroup reported quarterly financial results. Global core income was $3.859 billion for Q1 2002, up 5% from Q1 2001. By segment, global consumer core income grew 20% to $1.812 billion, while global corporate and investment banking core income fell 13% to $1.286 billion. On a regional basis, core income from North America grew 20% to $2.479 billion, while core income from Western Europe fell 41% to $171 million.
This document provides Citigroup's quarterly financial data supplement. It includes:
1) Financial summaries of Citigroup's income from continuing operations, net income, earnings per share, capital ratios, assets, and return on equity on a quarterly and annual basis.
2) Breakdowns of income from continuing operations by business segment and region, including Global Consumer, Global Corporate and Investment Bank, Private Client Services, and Global Investment Management.
3) Details on net revenues, income statements, and other financial metrics for Citigroup's business segments.
The supplement shows Citigroup's financial performance remained strong in the fourth quarter of 2003, with income from continuing operations up 96% from
- Bank of America reported third quarter 2007 results with net income of $3.7 billion, down 32% from the third quarter of 2006. Earnings per share were $0.82.
- Revenues declined 12% due to a 24% drop in noninterest income driven by losses in Global Corporate and Investment Banking from market turbulence.
- The provision for credit losses increased 74% to $2.03 billion reflecting increased consumer loan loss rates and impacts from the weakened housing market.
Citigroup reported record first quarter net income of $5.44 billion, up 3% from the same period last year. Revenue increased 6% to $21.5 billion. The Board authorized up to an additional $15 billion in share repurchases. Several business segments saw revenue and income increases, including Global Consumer and Corporate and Investment Banking. However, Global Wealth Management saw declines in revenue and income.
This document summarizes Viacom's financial results for the third quarter of 2008. Revenues increased 4% year-over-year to $3.4 billion. Operating income decreased 15% to $689 million due to an 11% increase in expenses. Adjusted net earnings decreased 22% to $339 million, while adjusted diluted EPS decreased 15% to $0.55. Free cash flow was $564 million for the quarter compared to a significant decrease year-to-date. Total debt was $8.95 billion as of September 30, 2008, while cash on hand was $525 million.
Bank of America reported third quarter 2005 results with the following key points:
1) Diluted EPS was up 12% year-over-year but down 4% quarter-over-quarter due to higher credit costs and lower securities gains.
2) Revenue grew 16% year-over-year and 4% quarter-over-quarter driven by strong growth across all business segments.
3) Credit costs increased from very low levels in previous quarters as charge-offs moved off recent lows.
EDP Energias do Brasil reported its 2Q09 results. Key highlights include: 4%
- EBITDA of R$344 million and net income of R$213 million
- Energy volume sold by generation business up 29% year-over-year 18%
- Unveiling of full commercial operations at Santa Fé SHP
- Net revenue fell 1% due to elimination of Enersul figures 78%
- Manageable expenses down 12% for the sixth quarter in a row
- Approval and signature of long-term financing for Pecém I project
Bonds
BNDES/IDB
The presentation provides financial and operational details on EDP
Citigroup reported its quarterly financial results. Some key highlights:
- Core income for Q4 2000 was $3.331 billion, up 11% from Q4 1999.
- Net income for Q4 2000 was $2.84 billion, down 6% from Q4 1999 due to restructuring charges.
- Global Consumer segment revenues grew 9% to $10.243 billion in Q4 2000.
- Global Corporates and Institutions segment revenues grew 16% to $8.464 billion in Q4 2000.
1) Citi reported a significant year-over-year decline in 4th quarter 2007 earnings, with net income down 83% and EPS down 83% due to losses from sub-prime exposures and increased credit costs.
2) Revenue declined 70% year-over-year in 4Q2007 due to losses from sub-prime exposures in Fixed Income Markets and higher credit costs in U.S. Consumer.
3) Expenses increased 18% year-over-year in 2007, with 9% organic growth and 9% from acquisitions, while headcount increased 15% in 2007.
- Viacom reported financial results for Q4 and full year 2008, with revenues of $4.2 billion for Q4 and $14.6 billion for the full year.
- Operating income declined 51% in Q4 and 14% for the full year due to $454 million in restructuring charges.
- Adjusted results exclude these restructuring charges and provide a better view of underlying performance, with adjusted operating income declining 6% in Q4 and 1% for the full year.
- The company generated $1.4 billion in free cash flow in Q4 and $1.7 billion for the full year, helped by working capital changes.
Viacom reported financial results for the first quarter of 2008 that showed increases in revenue, operating income, and earnings per share compared to the first quarter of 2007. Revenue grew 15% to $3.117 billion. Operating income increased 29% to $567 million. Diluted earnings per share from continuing operations rose 45% to $0.42. Media Networks and Filmed Entertainment, Viacom's two business segments, both saw revenue growth for the quarter despite lower theatrical revenues at Filmed Entertainment. Viacom also provided guidance for 2008-2010 of low double-digit annual growth in diluted earnings per share from continuing operations.
Citi reported a $9.83 billion net loss for Q4 2007, driven by $18.1 billion in write-downs on subprime exposures and a $4.1 billion increase in credit costs for US consumer loans. For the full year, Citi earned $3.62 billion in net income on $81.7 billion in revenues. While most business segments saw strong revenue growth, losses were concentrated in fixed income markets and US consumer lending due to deteriorating credit quality. Citi outlined steps to strengthen its capital position and improve risk management in response to the poor results.
- Revenues and sales increased for ALLTEL's wireless and communications support services segments but decreased slightly for its wireline segment in both the three-month and six-month periods.
- Total operating income increased 13% and segment income increased 20% for the three-month period compared to the previous year. For the six-month period, total operating income increased 13% and segment income increased 19%.
- Earnings per share on a basic and diluted basis decreased year-over-year for both periods under GAAP due to higher corporate expenses and integration costs.
This document discusses the business environment and 1Q06 highlights for a company. It saw 23% CAGR in card base expansion in 2006 and competition differentiation through independence. Gross revenue was up 28% YoY in 1Q06 driven by increased market share in profitable segments like CardSystem and MarketSystem. Key strategies for 2006 include expanding market share in cards and markets, implementing a Caixa project, and boosting profits in TeleSystem and Credit&Risk units.
Citibanking North America reported a 14% increase in total revenues and a 92% increase in core income for Q1 2000 compared to Q1 1999. Key drivers included an 86% increase in core income before taxes due to higher non-interest revenue and lower loan loss provisions. Average loans declined 5% while average deposits grew 5%. Asset quality improved with delinquencies and net credit losses declining.
Citigroup reported record earnings for the first quarter of 2000, with core income rising 49% to $3.6 billion compared to the same period last year. Several of Citigroup's business lines saw double-digit earnings growth, including Global Consumer (up 23%), Global Corporate and Investment Bank (up 36%), and Global Investment Management (up 26%). Strong performance across all regions and business segments was driven by favorable global market conditions. Return on equity was 30% and the company repurchased $1.2 billion in stock during the quarter.
This document provides quarterly financial data for Citigroup, including:
- Consolidated financial summaries showing metrics like core income, net income, earnings per share, capital ratios, assets, and returns on equity.
- Segment net revenues and core income broken down by Citigroup's main business segments - Global Consumer, Global Corporate and Investment Bank, and Global Investment Management.
- More detailed financial results for the major businesses within Global Consumer like North America Cards, Mortgage Banking, and International.
- Supplemental financial details including consolidated statements of income, earnings analysis, loan delinquency amounts, and insurance investment portfolio information.
The document contains quarterly and year-to-
Citigroup reported strong financial results for the second quarter and first half of 2000. Core income rose 21% to $3.0 billion for the second quarter and 35% to $6.6 billion for the first half of the year. All of Citigroup's major business segments experienced double-digit income growth, led by the Global Consumer Group and Global Corporate and Investment Bank. Citigroup continued making acquisitions and investments to expand its global businesses and presence on the internet. Chairman and CEO Sanford Weill stated the results demonstrated the impact of the company's market share gains and consistent growth across its businesses.
Citigroup reported its third quarter 2000 financial results. Key highlights include:
- Core income for 3Q 2000 was $3.11 billion, up 27% from 3Q 1999. Year-to-date core income through 3Q 2000 was $9.72 billion, up 32% from the same period in 1999.
- Net income for 3Q 2000 was $3.088 billion, up 27% from 3Q 1999. Year-to-date net income through 3Q 2000 was $9.683 billion, up 34% from the same period in 1999.
- Basic earnings per share for core income in 3Q 2000 was $0.69, up 28% from 3Q 1999.
Citigroup reported strong third quarter results for 2000, with core income rising 27% to $3.1 billion compared to the third quarter of 1999. Key highlights included:
- Global Consumer core income rose 17% to $1.32 billion, driven by growth in North American cards, mortgage banking, and Asia.
- Global Corporate and Investment Bank core income increased 40% to $1.59 billion, with strong performances from Salomon Smith Barney and emerging markets banking.
- Global Investment Management and Private Banking core income grew 14% to $176 million, with increased revenues across asset management, private banking, and retirement services.
Citigroup reported strong 4th quarter and full-year 2000 earnings. 4th quarter core income was $3.33 billion, an 11% increase, and full-year core income was a record $14.14 billion, up 25%. All of Citigroup's major business segments saw growth in the 4th quarter, led by the Global Consumer Group at 25% growth. For the full year, net income was $13.52 billion. Chairman and CEO Sanford Weill cited the company's global strength and leadership across business lines. Citigroup continued investments in growing markets and internet capabilities.
Citigroup reported its quarterly financial results. Core income decreased 7% from the prior year quarter to $3.66 billion. Total revenues declined across most business segments, with the exception of the Global Consumer segment which increased revenues slightly. Overall, Citigroup saw lower earnings due to weaker market conditions impacting its trading and investment banking businesses. Capital ratios and credit quality metrics remained strong however, positioning Citigroup well despite the challenging environment.
Citigroup reported core income of $3.66 billion for Q1 2001, a 7% decrease from Q1 2000. Excluding investment activities, core income rose 7% year-over-year. Global Consumer saw core income increase 18% to $1.78 billion driven by growth in US banking and lending. Global Corporate core income declined 7% to $1.75 billion due to weaker investment markets, though revenues grew 11%. Overall, Citigroup achieved solid results despite challenging markets due to the strength and diversity of its businesses.
Citigroup, the largest global financial services company, reported quarterly financial results. Core income decreased 7% year-over-year to $3.66 billion, while net income decreased 8% to $3.54 billion. Revenues increased 6% to $21.05 billion driven by strong growth in North America Cards, Corporate Finance, and emerging markets. Citibanking North America revenues increased 6% to $613 million with core income before taxes up 24% to $271 million.
Citigroup reported its financial results for the first quarter of 2001. Net income decreased 8% compared to the first quarter of 2000. Core income, which excludes restructuring and accounting items, decreased 7%. Within Global Consumer, Banking/Lending revenues increased 14% driven by growth in North America Cards, CitiFinancial, and Mortgage Banking. Core income for Banking/Lending increased 21% led by gains in North America Cards, CitiFinancial, and Citibanking North America.
Citigroup reported a 13% increase in core income to $3.79 billion for Q2 2001 compared to Q2 2000. Revenue grew 8% to $20.3 billion led by 12% growth in the Global Consumer segment. Core EPS grew 14% to $0.74 per share. Several business segments saw strong growth including 40% growth for CitiFinancial, 17% for North America Cards, and 18% for the Private Bank. Despite difficult market conditions, Corporate Finance delivered 12% earnings growth through increased market share.
Citigroup reported quarterly financial data for 3Q 2001. Some key highlights:
- Core income was $3.262 billion for 3Q 2001, down 8% from 3Q 2000. Year-to-date core income was $10.707 billion, down 1% from the same period in 2000.
- Total revenues for 3Q 2001 were $20.294 billion, up 5% from 3Q 2000. Year-to-date total revenues were $61.656 billion, up 6% from the same period in 2000.
- Global Consumer revenues grew 19% to $11.661 billion in 3Q 2001, driven by strength in North America Cards and Banking/L
Citigroup reported financial results for the third quarter of 2001. Citigroup is a global financial services company with operations in over 100 countries. Some key highlights:
- Core income for 3Q 2001 was $3.26 billion, down 8% from 3Q 2000. Year-to-date core income was $10.7 billion, down 1% from the same period in 2000.
- Total revenues for Global Consumer operations were $11.66 billion for 3Q 2001, up 19% from 3Q 2000, driven by growth in North America Cards and Mortgage Banking.
- Revenues for Global Corporate were $8.01 billion for 3Q 2001, down 5% from 3
Citigroup reported third quarter core income of $3.26 billion, down 7% from the prior year due to $700 million in losses from the September 11th attacks. Revenue grew 5% to $20.29 billion while expenses declined 2%. The diversification of Citigroup's businesses allowed growth in many areas, including a 45% increase in CitiFinancial income and a 25% rise in Citibanking income, despite challenges in the market environment from the attacks. Sanford Weill, CEO, expressed confidence that Citigroup would deliver 15% earnings growth in the fourth quarter assuming a stable market.
Citigroup reported its quarterly financial results. Net income for 4Q 2001 was $3.875 billion, up 36% from 4Q 2000. Core income, which excludes certain items, was $3.862 billion for 4Q 2001, up 16% from the prior year. Total revenues for Global Consumer increased 20% to $11.207 billion compared to 4Q 2000, driven by growth in North America Cards, Citibanking North America, and Mortgage Banking. Revenues for Global Corporate were relatively flat compared to the prior year.
Citigroup reported a 23% increase in third quarter net income to $3.92 billion compared to the prior year. Core income, which excludes certain one-time items, rose 17% to $3.79 billion. Earnings per share increased 25% and 19% respectively. Revenues increased 10% for the quarter driven by strong performance across business segments, though credit costs remained high. For the first nine months of the year, net income rose 25% while core income increased 14% on 10% higher revenues.
Citigroup reported a 23% increase in third quarter net income to $3.92 billion. Core income, which excludes certain one-time items, rose 17% to $3.79 billion. Revenues increased 10% for the quarter. Global Consumer business core income rose 13% to a record $2.22 billion, driven by strong growth in cards and retail banking. Global Corporate and Investment Bank core income fell 7% to $1.20 billion due to higher credit losses, despite expense reductions.
Citigroup will introduce format changes to its financial supplement accompanying its first quarter earnings release on April 14th. The changes relate to the presentation of existing business segments and do not reflect changes to the underlying businesses. Major changes include presenting Global Consumer products from a North America and International perspective, consolidating Cards and Consumer Finance disclosure, combining Consumer Assets with Retail Banking, excluding Private Client Services from the Corporate and Investment Bank, and adding detail to Private Client Services disclosure. The changes also include identifying realized gains and losses for different business lines and consolidating geographic regions for Europe, Middle East, Africa, India, and Asia into single reporting units.
This document provides quarterly financial data for Citigroup, including:
1) Income statements for Citigroup's major business segments broken down by product and region, showing revenues, expenses, profits.
2) Key metrics for Citigroup as a whole, including revenues, income, earnings per share, assets, equity.
3) Specific data on performance of Citigroup's Global Consumer credit card business, including revenues, expenses, profits, and effects of securitization activities.
Vicinity Jobs’ data includes more than three million 2023 OJPs and thousands of skills. Most skills appear in less than 0.02% of job postings, so most postings rely on a small subset of commonly used terms, like teamwork.
Laura Adkins-Hackett, Economist, LMIC, and Sukriti Trehan, Data Scientist, LMIC, presented their research exploring trends in the skills listed in OJPs to develop a deeper understanding of in-demand skills. This research project uses pointwise mutual information and other methods to extract more information about common skills from the relationships between skills, occupations and regions.
Economic Risk Factor Update: June 2024 [SlideShare]Commonwealth
May’s reports showed signs of continued economic growth, said Sam Millette, director, fixed income, in his latest Economic Risk Factor Update.
For more market updates, subscribe to The Independent Market Observer at https://blog.commonwealth.com/independent-market-observer.
^%$Zone1:+971)581248768’][* Legit & Safe #Abortion #Pills #For #Sale In #Duba...mayaclinic18
Whatsapp (+971581248768) Buy Abortion Pills In Dubai/ Qatar/Kuwait/Doha/Abu Dhabi/Alain/RAK City/Satwa/Al Ain/Abortion Pills For Sale In Qatar, Doha. Abu az Zuluf. Abu Thaylah. Ad Dawhah al Jadidah. Al Arish, Al Bida ash Sharqiyah, Al Ghanim, Al Ghuwariyah, Qatari, Abu Dhabi, Dubai.. WHATSAPP +971)581248768 Abortion Pills / Cytotec Tablets Available in Dubai, Sharjah, Abudhabi, Ajman, Alain, Fujeira, Ras Al Khaima, Umm Al Quwain., UAE, buy cytotec in Dubai– Where I can buy abortion pills in Dubai,+971582071918where I can buy abortion pills in Abudhabi +971)581248768 , where I can buy abortion pills in Sharjah,+97158207191 8where I can buy abortion pills in Ajman, +971)581248768 where I can buy abortion pills in Umm al Quwain +971)581248768 , where I can buy abortion pills in Fujairah +971)581248768 , where I can buy abortion pills in Ras al Khaimah +971)581248768 , where I can buy abortion pills in Alain+971)581248768 , where I can buy abortion pills in UAE +971)581248768 we are providing cytotec 200mg abortion pill in dubai, uae.Medication abortion offers an alternative to Surgical Abortion for women in the early weeks of pregnancy. Zone1:+971)581248768’][* Legit & Safe #Abortion #Pills #For #Sale In #Dubai Abu Dhabi Sharjah Deira Ajman Fujairah Ras Al Khaimah%^^%$Zone1:+971)581248768’][* Legit & Safe #Abortion #Pills #For #Sale In #Dubai Abu Dhabi Sharjah Deira Ajman Fujairah Ras Al Khaimah%^^%$Zone1:+971)581248768’][* Legit & Safe #Abortion #Pills #For #Sale In #Dubai Abu Dhabi Sharjah Deira Ajman Fujairah Ras Al Khaimah%^^%$Zone1:+971)581248768’][* Legit & Safe #Abortion #Pills #For #Sale In #Dubai Abu Dhabi Sharjah Deira Ajman Fujairah Ras Al Khaimah%^^%$Zone1:+971)581248768’][* Legit & Safe #Abortion #Pills #For #Sale In #Dubai Abu Dhabi Sharjah Deira Ajman Fujairah Ras Al Khaimah%^^%$Zone1:+971)581248768’][* Legit & Safe #Abortion #Pills #For #Sale In #Dubai Abu Dhabi Sharjah Deira Ajman Fujairah Ras Al Khaimah%^^%$Zone1:+971)581248768’][* Legit & Safe #Abortion #Pills #For #Sale In #Dubai Abu Dhabi Sharjah Deira Ajman Fujairah Ras Al Khaimah%^^%$Zone1:+971)581248768’][* Legit & Safe #Abortion #Pills #For #Sale In #Dubai Abu Dhabi Sharjah Deira Ajman Fujairah Ras Al Khaimah%^^%$Zone1:+971)581248768’][* Legit & Safe #Abortion #Pills #For #Sale In #Dubai Abu Dhabi Sharjah Deira Ajman Fujairah Ras Al Khaimah%^^%$Zone1:+971)581248768’][* Legit & Safe #Abortion #Pills #For #Sale In #Dubai Abu Dhabi Sharjah Deira Ajman Fujairah Ras Al Khaimah%^^%$Zone1:+971)581248768’][* Legit & Safe #Abortion #Pills #For #Sale In #Dubai Abu Dhabi Sharjah Deira Ajman Fujairah Ras Al Khaimah%^^%$Zone1:+971)581248768’][* Legit & Safe #Abortion #Pills #For #Sale In #Dubai Abu Dhabi Sharjah Deira Ajman Fujairah Ras Al Khaimah%^^%$Zone1:+971)581248768’][* Legit & Safe #Abortion #Pills #For #Sale In #Dubai Abu Dhabi Sharjah Deira Ajman Fujairah Ras Al Khaimah%^^%$Zone1:+971)581248768’][* Legit & Safe #Abortion #Pills #For #Sale In #Dubai Abu Dhabi Sharjah Deira Ajman
Enhancing Asset Quality: Strategies for Financial Institutionsshruti1menon2
Ensuring robust asset quality is not just a mere aspect but a critical cornerstone for the stability and success of financial institutions worldwide. It serves as the bedrock upon which profitability is built and investor confidence is sustained. Therefore, in this presentation, we delve into a comprehensive exploration of strategies that can aid financial institutions in achieving and maintaining superior asset quality.
In a tight labour market, job-seekers gain bargaining power and leverage it into greater job quality—at least, that’s the conventional wisdom.
Michael, LMIC Economist, presented findings that reveal a weakened relationship between labour market tightness and job quality indicators following the pandemic. Labour market tightness coincided with growth in real wages for only a portion of workers: those in low-wage jobs requiring little education. Several factors—including labour market composition, worker and employer behaviour, and labour market practices—have contributed to the absence of worker benefits. These will be investigated further in future work.
Independent Study - College of Wooster Research (2023-2024) FDI, Culture, Glo...AntoniaOwensDetwiler
"Does Foreign Direct Investment Negatively Affect Preservation of Culture in the Global South? Case Studies in Thailand and Cambodia."
Do elements of globalization, such as Foreign Direct Investment (FDI), negatively affect the ability of countries in the Global South to preserve their culture? This research aims to answer this question by employing a cross-sectional comparative case study analysis utilizing methods of difference. Thailand and Cambodia are compared as they are in the same region and have a similar culture. The metric of difference between Thailand and Cambodia is their ability to preserve their culture. This ability is operationalized by their respective attitudes towards FDI; Thailand imposes stringent regulations and limitations on FDI while Cambodia does not hesitate to accept most FDI and imposes fewer limitations. The evidence from this study suggests that FDI from globally influential countries with high gross domestic products (GDPs) (e.g. China, U.S.) challenges the ability of countries with lower GDPs (e.g. Cambodia) to protect their culture. Furthermore, the ability, or lack thereof, of the receiving countries to protect their culture is amplified by the existence and implementation of restrictive FDI policies imposed by their governments.
My study abroad in Bali, Indonesia, inspired this research topic as I noticed how globalization is changing the culture of its people. I learned their language and way of life which helped me understand the beauty and importance of cultural preservation. I believe we could all benefit from learning new perspectives as they could help us ideate solutions to contemporary issues and empathize with others.
A toxic combination of 15 years of low growth, and four decades of high inequality, has left Britain poorer and falling behind its peers. Productivity growth is weak and public investment is low, while wages today are no higher than they were before the financial crisis. Britain needs a new economic strategy to lift itself out of stagnation.
Scotland is in many ways a microcosm of this challenge. It has become a hub for creative industries, is home to several world-class universities and a thriving community of businesses – strengths that need to be harness and leveraged. But it also has high levels of deprivation, with homelessness reaching a record high and nearly half a million people living in very deep poverty last year. Scotland won’t be truly thriving unless it finds ways to ensure that all its inhabitants benefit from growth and investment. This is the central challenge facing policy makers both in Holyrood and Westminster.
What should a new national economic strategy for Scotland include? What would the pursuit of stronger economic growth mean for local, national and UK-wide policy makers? How will economic change affect the jobs we do, the places we live and the businesses we work for? And what are the prospects for cities like Glasgow, and nations like Scotland, in rising to these challenges?
Falcon stands out as a top-tier P2P Invoice Discounting platform in India, bridging esteemed blue-chip companies and eager investors. Our goal is to transform the investment landscape in India by establishing a comprehensive destination for borrowers and investors with diverse profiles and needs, all while minimizing risk. What sets Falcon apart is the elimination of intermediaries such as commercial banks and depository institutions, allowing investors to enjoy higher yields.
9. GLOBAL CARDS
Page 1
(In millions of dollars)
4Q08 vs. Full Full YTD 2008 vs.
1Q 2Q 3Q 4Q 1Q 2Q 3Q 4Q 4Q07 Increase/ Year Year YTD 2007 Increase/
2007 2007 2007 2007 2008 2008 2008 2008 (Decrease) 2007 2008 (Decrease)
Net Interest Revenue $ 2,291 $ 2,660 $ 2,723 $ 3,008 $ 2,706 $ 2,998 $ 2,884 $ 2,679 (11%) $ 10,682 $ 11,267 5%
Non-Interest Revenue 2,845 2,634 3,619 3,271 3,673 2,429 905 1,933 (41%) 12,369 8,940 (28%)
Total Revenues, Net of Interest Expense (1) 5,136 5,294 6,342 6,279 6,379 5,427 3,789 4,612 (27%) 23,051 20,207 (12%)
Total Operating Expenses 2,400 2,479 2,610 3,082 2,595 2,710 2,595 2,656 (14%) 10,571 10,556 -
Net Credit Losses 865 847 1,045 1,120 1,248 1,412 1,588 1,670 49% 3,877 5,918 53%
Credit Reserve Build / (Release) (9) 426 503 652 623 583 1,069 1,275 96% 1,572 3,550 NM
Provision for Benefits & Claims 20 13 20 15 20 24 15 29 93% 68 88 29%
Provision for Loan Losses and for Benefits and Claims 876 1,286 1,568 1,787 1,891 2,019 2,672 2,974 66% 5,517 9,556 73%
Income Before Taxes and Minority Interest 1,860 1,529 2,164 1,410 1,893 698 (1,478) (1,018) NM 6,963 95 (99%)
Income Taxes 609 478 719 472 664 242 (579) (411) NM 2,278 (84) NM
Minority Interest 1 3 3 4 3 4 3 3 (25%) 11 13 18%
Net Income $ 1,250 $ 1,048 $ 1,442 $ 934 $ 1,226 $ 452 $ (902) $ (610) NM $ 4,674 $ 166 (96%)
Average Assets (in billions of dollars) $ 104 $ 109 $ 113 $ 123 $ 123 $ 123 $ 119 $ 111 (10%) $ 112 $ 119 6%
Return on Assets 4.87% 3.86% 5.06% 3.01% 4.01% 1.48% (3.02%) (2.19%) 4.17% 0.14%
Net Credit Loss Ratio 4.70% 4.26% 5.00% 4.78% 5.39% 6.18% 7.02% 7.75%
Average Risk Capital $ 8,197 $ 8,399 $ 8,722 $ 9,397 $ 14,762 $ 15,233 $ 14,520 $ 13,976 49% $ 8,679 $ 14,623 68%
Return on Risk Capital 62% 50% 66% 39% 33% 12% (25%) (17%) 54% 1%
Return on Invested Capital 26% 22% 29% 18% 18% 7% (13%) (9%) 24% 1%
KEY INDICATORS
EOP Open Accounts (in millions)
North America 152.6 150.1 149.1 151.9 148.6 146.9 145.3 138.2 (9%)
EMEA 5.6 8.0 8.2 8.4 8.8 8.9 9.1 9.0 7%
Latin America 11.7 12.0 12.4 12.9 12.9 12.9 12.9 12.7 (2%)
Asia 13.8 14.1 14.3 15.4 15.7 15.7 15.4 15.6 1%
Total 183.7 184.2 184.0 188.6 186.0 184.4 182.7 175.5 (7%)
Purchase Sales (in billions of dollars)
North America $ 73.8 $ 83.5 $ 83.1 $ 89.3 $ 76.9 $ 83.8 $ 80.3 $ 75.7 (15%)
EMEA 3.9 6.0 7.0 7.8 7.0 7.5 7.5 6.2 (21%)
Latin America 5.8 6.8 7.4 8.4 8.2 8.8 8.4 7.1 (15%)
Asia 11.6 12.6 13.1 14.8 14.7 15.3 14.9 13.7 (7%)
Total $ 95.1 $ 108.9 $ 110.6 $ 120.3 $ 106.8 $ 115.4 $ 111.1 $ 102.7 (15%)
Average Managed Loans (2):
North America (managed basis) $ 144.3 $ 143.2 $ 145.3 $ 150.5 $ 152.7 $ 151.2 $ 150.6 $ 149.3 (1%)
EMEA 7.2 11.6 14.2 15.1 15.7 16.5 16.2 14.1 (7%)
Latin America 10.2 11.7 12.3 13.5 14.1 14.7 14.6 11.8 (13%)
Asia 13.2 13.9 14.8 16.0 17.1 17.6 17.3 16.1 1%
Total $ 174.9 $ 180.4 $ 186.6 $ 195.1 $ 199.6 $ 200.0 $ 198.7 $ 191.3 (2%)
(1) The 2007 first quarter, 2007 second quarter, 2007 third quarter, 2007 fourth quarter, 2008 first quarter, 2008 second quarter and 2008 third quarter include releases of
$98 million, $144 million, $73 million, $157 million, $58 million, $21 million and $23 million, respectively, from the allowance for credit losses related to loan receivables that were either securitized or transferred to loans held-for-sale during the quarter.
(2) Managed basis is applicable only in North America, as securitizations are not done in any other region.
Managed basis presentation includes results from both the on-balance sheet loans and off- balance sheet loans, and excludes the impact of card securitization activity.
Managed disclosures assume that securitized loans have not been sold and present the results of the securitized loans in the same manner as the Company's owned loans.
NM Not meaningful
Page 8
Reclassified to conform to the current period's presentation.
10. GLOBAL CARDS
Page 2
(In millions of dollars)
1Q 2Q 3Q 4Q 1Q 2Q 3Q 4Q
2007 2007 2007 2007 2008 2008 2008 2008
KEY INDICATORS (continued) (1)
Managed Average Yield
North America (managed basis) 14.21% 14.17% 14.40% 13.87% 13.41% 13.24% 13.64% 13.82%
EMEA 17.94% 16.47% 16.17% 15.31% 15.65% 15.38% 15.50% 15.81%
Latin America 28.28% 29.24% 28.68% 26.27% 28.44% 30.36% 29.03% 27.25%
Asia 13.72% 14.04% 13.78% 13.89% 13.82% 13.79% 13.63% 13.55%
Global Total 15.13% 15.29% 15.42% 14.84% 14.69% 14.72% 14.92% 14.77%
Managed Net Interest Revenue as a % of Average Managed Loans
North America (managed basis) 10.07% 10.28% 10.50% 10.07% 10.09% 10.56% 11.03% 11.04%
EMEA 13.47% 13.89% 13.01% 11.55% 12.20% 12.18% 12.25% 12.33%
Latin America 21.25% 23.90% 23.26% 21.13% 22.93% 25.51% 22.93% 20.86%
Asia 10.17% 10.49% 10.16% 10.21% 10.04% 9.85% 9.70% 9.94%
Global Total 10.87% 11.42% 11.51% 10.96% 11.16% 11.73% 11.89% 11.65%
Coincident Managed Net Credit Loss Ratio
North America (managed basis) 4.60% 4.51% 4.51% 5.10% 5.81% 6.53% 7.13% 8.04%
EMEA 3.20% 2.70% 4.90% 0.72% 3.56% 3.94% 4.41% 5.17%
Latin America 8.75% 6.84% 9.65% 9.01% 10.25% 11.41% 13.16% 14.18%
Asia 3.19% 3.32% 3.11% 3.06% 3.17% 3.37% 3.63% 4.02%
Global Total 4.67% 4.45% 4.77% 4.86% 5.72% 6.40% 7.05% 7.87%
Managed Net Credit Margin as a % of Average Managed Loans
North America (managed basis) 7.48% 7.43% 8.03% 7.67% 7.14% 6.52% 5.90% 5.32%
EMEA 16.38% 13.83% 10.91% 14.12% 11.39% 10.96% 10.16% 10.02%
Latin America 25.89% 26.98% 46.08% 26.73% 40.43% 22.23% 17.92% 15.01%
Asia 12.53% 12.02% 11.32% 17.27% 12.69% 11.73% 11.65% 10.00%
Global Total 9.30% 9.46% 11.02% 10.28% 10.30% 8.50% 7.63% 6.66%
Managed Loans 90+ Days Past Due as a % of EOP Managed Loans
North America (managed basis) 1.57% 1.47% 1.60% 1.77% 1.96% 2.02% 2.11% 2.62%
EMEA 1.96% 2.02% 1.81% 1.53% 1.62% 1.81% 2.08% 2.60%
Latin America 3.39% 3.79% 3.67% 3.92% 3.75% 4.16% 4.36% 4.86%
Asia 1.59% 1.43% 1.43% 1.50% 1.49% 1.53% 1.57% 1.57%
Global Total 1.70% 1.66% 1.74% 1.88% 2.02% 2.12% 2.22% 2.66%
(1) Managed basis is applicable only in North America, as securitizations are not done in any other region.
Managed basis presentation includes results from both the on-balance sheet loans and off- balance sheet loans, and excludes the impact of card securitization activity.
Managed disclosures assume that securitized loans have not been sold and present the results of the securitized loans in the same manner as the Company's owned loans.
Reclassified to conform to the current period's presentation. Page 9
11. GLOBAL CARDS
Page 3
North America
(In millions of dollars) 4Q08 vs.
1Q 2Q 3Q 4Q 1Q 2Q 3Q 4Q 4Q07 Increase/
2007 2007 2007 2007 2008 2008 2008 2008 (Decrease)
SUPPLEMENTAL DISCLOSURE - MANAGED BASIS (1)
Managed Revenues: (in millions of dollars)
Total GAAP Revenues $ 3,407 $ 3,298 $ 3,510 $ 3,678 $ 3,343 $ 2,928 $ 1,388 $ 2,640 (28%)
Net Impact of Credit Card Securitization Activity (2) 929 998 1,124 1,200 1,610 2,016 3,579 2,426 NM
Total Managed Revenues $ 4,336 $ 4,296 $ 4,634 $ 4,878 $ 4,953 $ 4,944 $ 4,967 $ 5,066 4%
Return on Managed Assets 2.26% 1.84% 2.04% 0.79% 1.32% 0.44% (2.13%) (0.92%)
Average Managed Loans Securitized $ 97.4 $ 97.6 $ 101.0 $ 99.8 $ 105.8 $ 107.4 $ 108.8 $ 105.6 6%
(in billions of dollars) Held for Sale 3.0 3.3 3.0 2.7 1.0 1.0 - - (100%)
On Balance Sheet 43.9 42.3 41.3 48.0 45.9 42.8 41.8 43.7 (9%)
Total $ 144.3 $ 143.2 $ 145.3 $ 150.5 $ 152.7 $ 151.2 $ 150.6 $ 149.3 (1%)
Citi Branded $ 92.6 $ 91.6 $ 92.4 $ 95.3 $ 96.8 $ 96.6 $ 95.6 $ 94.4 (1%)
Retail Partners 51.7 51.6 52.9 55.2 55.9 54.6 55.0 54.9 (1%)
Total $ 144.3 $ 143.2 $ 145.3 $ 150.5 $ 152.7 $ 151.2 $ 150.6 $ 149.3 (1%)
EOP Managed Loans Citi Branded $ 91.6 $ 92.9 $ 93.6 $ 98.7 $ 96.3 $ 96.0 $ 96.0 $ 95.1 (4%)
Retail Partners 50.9 52.3 53.8 57.9 54.4 55.2 55.1 56.0 (3%)
Total $ 142.5 $ 145.2 $ 147.4 $ 156.6 $ 150.7 $ 151.2 $ 151.1 $ 151.1 (4%)
Managed Average Yield (3) Citi Branded 12.31% 12.25% 12.50% 12.12% 11.46% 11.19% 11.68% 11.99%
Retail Partners 17.60% 17.59% 17.71% 16.90% 16.77% 16.87% 17.04% 16.96%
Total 14.21% 14.17% 14.40% 13.87% 13.41% 13.24% 13.64% 13.82%
Managed Net Interest Revenue Citi Branded $ 1,784 $ 1,797 $ 1,885 $ 1,886 $ 1,894 $ 1,998 $ 2,116 $ 2,143 14%
(in millions of dollars) (4) Retail Partners 1,798 1,873 1,962 1,935 1,935 1,971 2,058 2,002 3%
Total $ 3,582 $ 3,670 $ 3,847 $ 3,821 $ 3,829 $ 3,969 $ 4,174 $ 4,145 8%
Managed Net Interest Revenue as Citi Branded 7.81% 7.87% 8.09% 7.85% 7.87% 8.32% 8.81% 9.03%
a % of Average Managed Loans Retail Partners 14.10% 14.56% 14.71% 13.91% 13.92% 14.52% 14.89% 14.51%
Total 10.07% 10.28% 10.50% 10.07% 10.09% 10.56% 11.03% 11.04%
Managed Net Credit Margin Citi Branded $ 1,644 $ 1,593 $ 1,732 $ 1,790 $ 1,658 $ 1,459 $ 1,295 $ 1,179 (34%)
(in millions of dollars) (5) Retail Partners 1,017 1,059 1,210 1,121 1,053 993 938 819 (27%)
Total $ 2,661 $ 2,652 $ 2,942 $ 2,911 $ 2,711 $ 2,452 $ 2,233 $ 1,998 (31%)
Managed Net Credit Margin as Citi Branded 7.20% 6.98% 7.44% 7.45% 6.89% 6.07% 5.39% 4.97%
a % of Average Managed Loans Retail Partners 7.98% 8.23% 9.07% 8.06% 7.58% 7.31% 6.78% 5.93%
Total 7.48% 7.43% 8.03% 7.67% 7.14% 6.52% 5.90% 5.32%
Managed Net Credit Losses Citi Branded $ 876 $ 878 $ 900 $ 1,034 $ 1,187 $ 1,375 $ 1,473 $ 1,657 60%
Retail Partners 759 733 753 899 1,018 1,078 1,228 1,361 51%
Total $ 1,635 $ 1,611 $ 1,653 $ 1,933 $ 2,205 $ 2,453 $ 2,701 $ 3,018 56%
Coincident Managed Net Citi Branded 3.84% 3.84% 3.86% 4.30% 4.93% 5.72% 6.13% 6.98%
Credit Loss Ratio: Retail Partners 5.95% 5.70% 5.65% 6.46% 7.32% 7.94% 8.88% 9.86%
Total 4.60% 4.51% 4.51% 5.10% 5.81% 6.53% 7.13% 8.04%
Managed Loans 90+Days Past Due Citi Branded $ 1,191 $ 1,138 $ 1,248 $ 1,489 $ 1,616 $ 1,674 $ 1,728 $ 2,129 43%
Retail Partners 1,045 997 1,112 1,286 1,337 1,376 1,466 1,824 42%
Total $ 2,236 $ 2,135 $ 2,360 $ 2,775 $ 2,953 $ 3,050 $ 3,194 $ 3,953 42%
% of EOP Managed Loans Citi Branded 1.30% 1.22% 1.33% 1.51% 1.68% 1.74% 1.80% 2.24%
Retail Partners 2.05% 1.91% 2.07% 2.22% 2.46% 2.49% 2.66% 3.26%
Total 1.57% 1.47% 1.60% 1.77% 1.96% 2.02% 2.11% 2.62%
(1) Managed basis is applicable only in North America, as securitizations are not done in any other region.
Managed basis presentation includes results from both the on-balance sheet loans and off- balance sheet loans, and excludes the impact of card securitization activity.
Managed disclosures assume that securitized loans have not been sold and present the results of the securitized loans in the same manner as the Company's owned loans.
(2) Net impact of Securitization Activity includes the removal of securitization-related items that are part of GAAP revenues such as the gain on sale of credit card loans,
mark-to-market revenue for interests retained in securitized assets classified as Trading, and net credit losses on loans that are considered sold for GAAP purposes.
(3) Gross interest revenue earned divided by average managed loans. (4) Includes certain fees that are recorded as interest revenue.
NM Not meaningful (5) Total Revenues, net of Interest Expense, less Net Credit Losses and Policy Benefits and Claims. Page 10
Reclassified to conform to the current period's presentation.