This document provides financial highlights and operating results for Illinois Tool Works Inc. for the years 1999, 1998 and 1997. Some key details include:
- Operating revenues increased 11% to $9.33 billion in 1999. Operating income grew 14% to $1.49 billion. Income from continuing operations rose 13% to $912 million.
- All business segments experienced growth in revenues and operating income from 1998 to 1999, with the exception of a 1% decline in operating income for the Specialty Systems - International segment.
- Per share earnings for income from continuing operations increased 13% to $3.04 basic and 12% to $2.99 diluted over the prior year. Cash dividends paid per
The document summarizes Henkel's financial results for the second quarter and first half of 2004 compared to the same periods in 2003. Net sales increased 9% in the second quarter and 6% year-to-date. Earnings from continuing operations rose 26% in the second quarter and 9% year-to-date due to growth across all business segments. Discontinued operations generated a large gain of $550 million from the exchange of businesses and increased earnings from discontinued operations significantly for both periods. As a result, net earnings increased substantially.
Reconciliations and Financial Slides from Safeway Investor Conferencefinance6
1) The document provides reconciliations of net income to adjusted EBITDA and net cash flow from operating activities to adjusted EBITDA for Safeway for 2007-2003. It also provides rolling 4 quarter reconciliations.
2) It reconciles gross margin and operating expense changes excluding factors like fuel.
3) EPS is reconciled excluding unusual items from 1992-2008G and a percentage change is calculated.
4) Free cash flow is reconciled from net cash flow from operating activities from 2013F-2005 by subtracting net cash used by investing activities.
This 2003 annual report summarizes Cummins' financial performance and business highlights for 2003. Some key points:
- Sales increased 8% to $6.3 billion compared to 2002, with net earnings of $50 million.
- The engine business had sales of $3.6 billion, up 6% from 2002. Power generation sales were $1.3 billion, up 8% despite challenging market conditions. Filtration and other business sales reached a record $1.1 billion, up 11%.
- New partnerships and supply agreements were signed to expand the company's customer base. International joint ventures also grew, particularly in China and Asia.
- While markets remained difficult, the company focused on cost
This document summarizes selected financial data for Mohawk Industries from 1999 to 1995. It shows that net sales increased from $2.04 billion in 1995 to $3.08 billion in 1999, while net earnings increased from $11.8 million to $157.2 million over the same period. Total assets also increased substantially from $1.11 billion to $1.68 billion from 1995 to 1999. The document also provides notes on restructuring costs, asset write-downs, stock option expenses, and acquisition costs over the years.
GMAC reported a net loss of $724 million in Q4 2007 compared to a net income of $7.4 billion in Q4 2008. For the full year, GMAC reported a net loss of $2.3 billion in 2007 compared to a net income of $1.8 billion in 2008. Key factors contributing to the changes included an $11.4 billion gain on extinguishment of debt in Q4 2008 and impairment charges taken in both years. Revenues declined across most business segments from 2007 to 2008.
This document from Chubb Corporation reports modifications to the presentation of losses incurred in property and casualty underwriting results for the six months ended June 30, 2008 and 2007. Specifically, it notes that beginning in Q3 2008, foreign currency fluctuations will be reflected differently in "net losses paid" and "increase (decrease) in outstanding losses", though incurred losses remain unchanged. It provides definitions of key terms like underwriting income/loss and combined loss/expense ratio used to evaluate underwriting performance. The document then presents detailed underwriting results by line of business and geographic region.
This document provides financial highlights and selected financial data for ConocoPhillips for the three month and twelve month periods ending December 31, 2005 and 2004. Some key details include:
- Revenues for the three months ending December 31, 2005 were $52.2 billion compared to $40.1 billion for the same period in 2004.
- Net income for the twelve months ending December 31, 2005 was $13.5 billion compared to $8.1 billion for the same period in 2004.
- Earnings per share (diluted) for continuing operations for the twelve months ending December 31, 2005 were $9.63 compared to $5.79 for the same period in 2004.
Maxim Integrated Products reported financial results for its second quarter of fiscal year 2009. Revenue declined 18% from the previous quarter to $410.7 million. The company reported a GAAP loss per share of $0.12, which included $125.9 million in special expenses. Cash flow from operations was $71.5 million. For the third quarter of fiscal year 2009, the company expects revenue in the range of $290-330 million and GAAP loss per share including special expenses and stock-based compensation.
This document summarizes the expected effects of the merger between Duke Energy and Cinergy. Shareholders and customers can expect value and reliable, affordable service. Local communities can anticipate support and enhancement. Employees will find a safe workplace that supports growth while sustaining the environment. The merger aims to increase value for investors while serving customers, communities, employees, and protecting the environment. Financial details of both companies from 2001-2005 are provided.
u.s.bancorp2Q 2003 Supplemental Business Line Schedulesfinance13
The document provides preliminary financial data for U.S. Bancorp's Wholesale Banking business for the second quarter of 2003 and comparisons to previous quarters. Some key details include:
- Net interest income was $511.7 million for 2Q 2003, up slightly from the previous quarter. Noninterest income was $194.5 million.
- Total net revenue for 2Q 2003 was $706.2 million. Operating earnings before items were $311.2 million.
- Average loans were $46.8 billion and average deposits were $27.9 billion for the quarter.
u.s.bancorp1Q 2003 Supplemental Business Line Schedulesfinance13
This document provides preliminary quarterly financial data for U.S. Bancorp's Wholesale Banking and Consumer Banking business lines for 1Q 2003 compared to previous quarters. Some key highlights:
- Wholesale Banking reported net income of $308.8 million in 1Q 2003, up from $295.1 million in 4Q 2002. Noninterest income increased 13.6% to $198.3 million from $174.8 million.
- Consumer Banking reported net income of $381.8 million in 1Q 2003, up slightly from $377 million in 4Q 2002. Noninterest income increased 16.3% to $456.6 million from $392.3
This document provides an overview of Duke Energy's 2004 annual report. It discusses Duke Energy's objectives for 2004 including generating cash, reducing debt, preserving dividends, resizing assets, improving safety, and restoring credibility. The chairman highlights accomplishments like exceeding financial targets, reducing debt, and stabilizing credit ratings. However, safety failures and an operational incident are noted as disappointments. Unfinished business is also mentioned, like developing a sustainable business model for Duke Energy North America. The chairman expresses optimism for 2005 while pursuing growth and leadership in the industry.
This annual report summarizes Northern Trust Corporation's financial results for 2005. Key points include:
- Revenues reached record levels of $2.69 billion, up 15% from 2004, driven by a 17% increase in trust, investment, and servicing fees.
- Net income was $584.4 million, up 16% compared to 2004.
- Total assets under management or administration increased 12% to a record $3.6 trillion due to strong new business growth internationally.
This document discusses procedures for information exchange regarding regulations in the United States. It outlines the process of "Notice and Comment" used in the U.S., where federal regulatory agencies issue a notice of a proposed regulation, accept public comments, and then issue a final rule addressing the comments. The U.S. Federal Register is a key source for following the "Notice and Comment" process, as it publishes notices, accepts comments, and issues final regulations. Electronic tools like RegAlert can also help track regulations across U.S. states.
This document summarizes the financial performance of a company for the third quarter and first six months of 2005 compared to the same periods in 2004. It shows that net sales increased 6% for both periods while earnings from continuing operations decreased 38% and 24% respectively due to higher costs. The household products division grew sales and earnings both periods, while other divisions saw mixed results.
Fluor Corporation reported financial results for 2003 with revenues of $8.8 billion, earnings from continuing operations of $179 million, and net earnings of $157 million. Key highlights included a 6% increase in earnings from continuing operations compared to 2002. New awards in 2003 totaled nearly $10 billion and backlog remained strong at over $10 billion. The document also discussed Fluor's shift away from power projects as that market declined, with the dissolution of its Duke/Fluor Daniel joint venture in power announced in July 2003.
This document provides consolidated income statements and cash flow information for 2007 and the first quarter of 2008 for an oil and gas company. It summarizes revenues, expenses, income by business segment, tax rates, certain items included in net income, and cash flows. For 2007, the company reported total revenues of $194.5 billion, net income of $11.9 billion, and net cash provided by operating activities of $11.9 billion. For the first quarter of 2008, total revenues were $56.6 billion and net income was $4.1 billion.
Duke Energy 01/29/04_PMA_and_DLH_4Q03_Earnings_Callfinance21
This document summarizes Duke Energy's earnings results for the fourth quarter of 2003. Reported EPS was $(2.23) due to special items including asset impairments and charges at DENA, losses from redesignating hedges, and charges related to exiting operations in Australia and Europe. Excluding special items, ongoing EPS was $0.22. Segment EBIT for Franchised Electric was lower due to higher expenses and mild weather, while Natural Gas Transmission remained flat with offsetting factors.
This document provides financial information about Chubb Corporation's property and casualty underwriting results for 2007 and 2006. It summarizes key metrics like net premiums written, losses incurred, expenses incurred, underwriting income, and combined loss/expense ratios for different business lines including personal, commercial, and specialty insurance. It also notes that beginning in 2008, foreign currency fluctuations will be accounted for differently in the reporting of losses paid and outstanding losses. Overall underwriting income increased from $1.886 billion to $2.064 billion from 2006 to 2007.
Yum! Brands had a very successful financial year in 2002, with revenue growth of 12% and ongoing operating earnings per share growth of 19%. A key driver of growth was the company's international business, where ongoing operating profits grew 22% and over 1,000 new restaurants were opened. Looking ahead, Yum! Brands plans to double its number of international restaurants in the next 8-10 years. Additionally, the company sees potential to expand in the US through its strategy of "multibranding", which involves offering multiple brands like KFC, Taco Bell, and Pizza Hut under the same roof. This allows Yum! to drive higher sales and pursue new market opportunities. The goal is to remodel
This document provides consolidated income statement and segment income information for ExxonMobil for 2007 and 2008. In 2007, ExxonMobil earned a net income of $11.9 billion, with the largest contributors being the Upstream (E&P) segments. Several large impairment charges in the International E&P segment resulted in a net loss for that segment. In 2008, ExxonMobil's net income increased to $9.6 billion for the periods reported, with the Upstream segments again contributing the most income. Certain items included large gains and impairments in various segments in both years.
This document provides selected financial information and operating statistics for Ameren for the years 1999-2003. Some key details include:
- Operating revenues increased from $3.5 billion in 1999 to $4.6 billion in 2003. Net income increased from $385 million to $524 million over the same period.
- Total assets grew from $9.2 billion in 1999 to $14.2 billion in 2003, reflecting acquisitions including CILCORP in 2003.
- Electric operating revenues were $3.9 billion in 2003, up from $3.3 billion in 1999. Kilowatthour sales increased from 66.8 million to 77.8 million over this period.
- Natural gas
This document provides an SEC quarterly report filed by Illinois Tool Works Inc. for the third quarter of 2004. It includes financial statements such as the statement of income, balance sheet, and statement of cash flows. The statements show that for the third quarter of 2004, Illinois Tool Works reported net income of $330 million on revenues of $2.97 billion, compared to net income of $269 million on revenues of $2.53 billion for the same period in 2003. For the first nine months of 2004, net income was $981 million on revenues of $8.68 billion, compared to net income of $740 million on revenues of $7.41 billion for the first nine months of 2003. The balance sheet indicates
The document discusses accessibility in tourism through public-private partnerships and good practices. It provides an overview of tourism for all and the legal framework in Spain promoting universal accessibility. It then analyzes good practices in accessibility for historic cities and sites in Spain, the Paradores hotel chain, and historic European city centers. The analysis highlights initiatives undertaken and strategies developed to improve accessibility and inclusion in tourism.
The document summarizes a live presentation by Tim Ash of SiteTuners and Oli Gardner of Unbounce on building better B2B landing pages. Some of Tim Ash's key principles for effective B2B landing pages are to make the call to action clear, ask for less information from visitors, and cut down on text. The document also advertises an Express Review service from SiteTuners for interactive reviews of websites and landing pages. Contact information is provided for Tim Ash and Oli Gardner.
This document is an application form for the Erasmus+ program. It requests information about the applicant organizations, the proposed project details, budget, and impact. The form has several sections including general information, participating organizations, project description, preparation, management, implementation, dissemination, budget, and a summary. It collects contact information, background of the organizations, project activities, intellectual outputs, events, and financial information to assess the proposed project.
Burlington Northern Santa Fe Corporation reported record quarterly and annual earnings in 2006. For the fourth quarter, earnings per share increased 26% compared to the previous year. Freight revenues increased 9% to $3.77 billion due to a 4% rise in volume. Operating income rose 18% to $942 million and the operating ratio improved to 75.0%. For the full year 2006, earnings per share increased 27% and the company exceeded $1 billion in free cash flow before dividends.
Google adalah mesin pencari paling populer dengan database internet terbesar dan fitur pendukung yang memuaskan. Yahoo menyediakan direktori dan pencarian lokal yang lebih baik dari Google. AllTheWeb menonjol karena mampu mencari file di FTP.
Johann Heinrich Schulz discovered in 1727 that silver nitrate would change color when exposed to light, which was an early step towards developing the first photographs. Joseph Niepce then developed the camera obscura in 1814 to take the first photo, though the process was imperfect. In 1837, Louis Daguerre invented the Daguerreotype process which reduced exposure time to just 30 minutes and produced images that did not fade. Multiple copies of photographs became possible in 1841 when William Henry Talbot invented the Calotype process.
This document is an application form for the Erasmus+ programme. It requests information in several sections, including general information about the applicant organizations, a description of the proposed project's objectives, planning, and activities. It also asks for details on project management, dissemination of results, and planned intellectual outputs, multiplier events, and learning/teaching activities. If selected, the project would receive EU funding to promote cooperation and innovation in adult learning through transnational partnerships.
The document is a supplement to the proxy statement for Fluor Corporation's annual shareholder meeting providing updated information. It notes that proposal 3 in the original proxy statement asked shareholders to approve increasing authorized common stock from 150 million to 400 million shares, but the board now recommends increasing it to only 375 million shares. It includes the full text of the amended article fourth that would be added to the certificate of incorporation reflecting this revised increase in authorized common stock. Shareholders who have already voted are not required to vote again unless wanting to change their vote.
This document is a quarterly report filed by Illinois Tool Works Inc. with the Securities and Exchange Commission for the quarter ended June 30, 2006. It includes the company's statement of income, statement of financial position, statement of cash flows, and notes to the financial statements. The statements show that for the quarter ended June 30, 2006, Illinois Tool Works had operating revenues of $3.6 billion, net income of $466 million, and cash provided by operating activities of $749 million. Total assets as of June 30, 2006 were $12.5 billion, with current assets of $4.8 billion and total stockholders' equity of $8.6 billion.
The document appears to be from a presentation by Tim Ash of SiteTuners on building trust online. It includes copyright notices, details on SiteTuners services such as landing page reviews and conversion management. There are before and after examples of website improvements. Special pricing is offered through May 2nd for an online conference in June on increasing revenue, leads, sales and marketing ROI. Contact information is provided for questions.
Burlington Northern Santa Fe Corporation reported financial results for the first quarter of 2004 with the following highlights:
- Revenue increased 11% to $2.49 billion driven by an 8% increase in units handled.
- Operating income rose 19% to $410 million and the operating ratio improved to 83.3% from 84.3% in the prior year.
- Earnings per share increased 30% to $0.52 compared to $0.40 in the first quarter of 2003, excluding the effect of an accounting change.
- Capital expenditures totaled $392 million for the quarter focused on maintenance and expansion projects.
The Europe 2020 strategy is rightly focused on competitiveness as the essential condition for economic growth and job-creation in the global 21st century economy.
The document traces important developments in camera technology from the 18th century to present day, including:
- In the 18th century, silver nitrate was discovered to change color with light exposure, allowing the first photographs to be taken and processed.
- Throughout the 19th century, techniques like the daguerreotype, calotype, and collodion process improved photograph exposure times from hours to seconds.
- In the late 19th century, roll film and dry plates made photography more portable and convenient.
- Major 20th century developments included Polaroid, color film, camcorders, digital cameras, camera phones, and easy to use share cameras.
Aleksandr Sergeevich Pushkin was a famous Russian poet, dramatist, short story writer, and novelist in the 19th century. He is best known for his works Eugene Onegin, a classic novel in verse; Boris Godunov, a drama about the Russian ruler; and The Gypsies, a short story. Pushkin made major contributions to developing the Russian language and literature through his rich vocabulary and highly sensitive writing style. He is seen as the founder of modern literary Russian.
El documento presenta conceptos clave relacionados con la tecnología social como simplicidad, transparencia, compartir, inteligencia colectiva, redes sociales y computación social.
The document lists three potential name ideas for an exhibition: Portabition, Photo Mania, and Landslide!. Portabition combines portraiture and exhibition and references the type of photos to be featured but may not be very creative. Photo Mania fits the exhibition but lacks originality. Landslide! ties into the landscape photos and is the preferred option.
This document provides selected financial data for Mohawk Industries for the years 1999, 1998, 1997, 1996 and 1995 including statements of earnings data and balance sheet data. It shows that net sales increased each year from $2.04 billion in 1995 to $3.08 billion in 1999. Gross profit also increased each year, reaching $777 million in 1999. Total assets grew from $1.11 billion in 1995 to $1.68 billion in 1999.
- Tricon Global Restaurants owns KFC, Pizza Hut, and Taco Bell restaurant chains. In 2001, the company saw increases in ongoing operating profit, net income, and earnings per share compared to 2000, though total revenues declined slightly.
- The company aims to improve customer satisfaction ratings by focusing on running great restaurants and improving the customer experience, which it recognizes is an area that needs significant improvement. It plans to train employees to have a "Customer Mania" mindset with the goal of becoming the best in the industry for customer service.
Eaton Corporation's 2001 annual report outlines the company's performance in a difficult year, with declining markets and a weakening global economy impacted further by the events of September 11th. Despite challenges, Eaton was able to outgrow its end markets, resize operations to compete at lower activity levels, strengthen its balance sheet by repaying over $560 million in debt, and end the year with a 16.9% stock return. The report emphasizes how Eaton has transformed its business model and integrated operations to better position the company for future growth opportunities.
Eaton Corporation is a global $7.3 billion diversified industrial manufacturer focused on fluid power systems, electrical power distribution and control, automotive engine air management, and intelligent truck systems. In 2001, Eaton faced challenges from a weak global economy and declining end markets, but took actions to resize operations, repay debt, and position itself for future growth when markets recover. The annual report discusses Eaton's financial performance in 2001, leadership response to challenges, and strategies for integrating operations to leverage its scale and diversity.
- Tribune Company reported its second quarter and first half 2002 results, with operating revenues increasing 1% in the second quarter compared to the previous year.
- Operating profit before restructuring charges was up 16% in the second quarter and 7% in the first half compared to the previous year. However, net income declined due to losses from derivatives and investments.
- Earnings per share were lower than the previous year in the second quarter and first half due to restructuring charges, losses from investments, and a cumulative effect of a change in accounting principle related to impairments of intangible assets.
Advanced Micro Devices reported financial results for Q4 2008 and full year 2008. For Q4, revenue declined 35% year-over-year to $1.2 billion, and the company reported a net loss of $1.4 billion. For the full year, revenue declined slightly to $5.8 billion while the net loss widened to $3.1 billion. The Computing Solutions segment experienced significant operating losses for both the quarter and year. Advanced Micro Devices' financial position also weakened, with cash balances declining by over 40% and stockholders' deficit reaching $82 million.
- Advanced Micro Devices reported a net loss of $1.4 billion for the quarter ending December 27, 2008, compared to a net loss of $127 million for the previous quarter and a net loss of $1.8 billion for the same quarter last year.
- For the full year 2008, AMD reported a net loss of $3.1 billion compared to a net loss of $3.4 billion in 2007.
- Revenue for Q4 2008 was $1.2 billion, down 35% from the previous quarter and 33% from Q4 2007. For the full year, revenue was $5.8 billion, down 1% from 2007.
Advanced Micro Devices reported financial results for Q4 2008 and full year 2008. For Q4, revenue declined 35% year-over-year to $1.2 billion, and the company reported a net loss of $1.4 billion. For the full year, revenue declined slightly to $5.8 billion while the net loss widened to $3.1 billion. The Computing Solutions segment experienced significant operating losses for both the quarter and year. Advanced Micro Devices' financial position also weakened, with cash balances declining by over 40% and stockholders' deficit reaching $82 million.
The document provides selected financial data for The TJX Companies, Inc. for fiscal years 2000-1996. Some key highlights include:
- Net sales increased from $8.8 billion in FY2000 to $7.9 billion in FY1999 and $7.4 billion in FY1998.
- Income from continuing operations before extraordinary items increased from $526.8 million in FY2000 to $433.2 million in FY1999 and $306.6 million in FY1998.
- Total number of stores increased from 1,357 in FY2000 to 1,246 in FY1999 and 1,171 in FY1998.
This document provides financial highlights and operating data for ConocoPhillips for the fourth quarter and full year 2006 compared to 2005. Some key details:
- Revenues for Q4 2006 were $42.5 billion compared to $52.2 billion for Q4 2005. Full year revenues were $188.5 billion in 2006 versus $183.4 billion in 2005.
- Net income for Q4 2006 was $3.2 billion compared to $3.7 billion for Q4 2005. Full year net income was $15.6 billion in 2006 versus $13.5 billion in 2005.
- Average daily oil and gas production for Q4 2006 was 859 thousand barrels of oil equivalent for consolidated
- The document reports financial results for Clorox for the third quarter and first nine months of fiscal year 2006 compared to the same periods in fiscal year 2005. Net sales increased 7% in the third quarter and 6% year-to-date. Earnings from continuing operations were $110 million for the third quarter and $301 million year-to-date.
Arrow Electronics had a record year in 2006 with $13.6 billion in sales, a nearly 22% increase over 2005. Some key highlights included operating income increasing nearly 27% to $622 million and net income per share of $2.92 compared to $2.18 in 2005. The company continued to expand its global electronic components and enterprise computing solutions businesses.
Revenues increased from $11.5 billion in 2006 to $12.8 billion in 2007 primarily due to higher electric utility revenues. Operating income increased from $2.6 billion to $2.8 billion between 2006 and 2007. Net income increased from $1.25 billion in 2006 to $1.31 billion in 2007, while basic earnings per share increased from $3.84 to $4.27 over the same period.
Allstate's revenues increased 4% to $27 billion in 1999. Operating income decreased 19% to $2.1 billion due to higher costs and charges from acquisitions and restructuring. Net income fell 17% to $2.7 billion. Investments grew 5% to $69.6 billion. In Property-Liability, premiums written rose 5% to $20.4 billion and underwriting income decreased 60% to $527 million due to increased losses and expenses.
The TJX Companies is a major off-price retailer that owns stores like T.J. Maxx, Marshalls, HomeGoods, and HomeSense. For the fiscal year ended January 2002:
- Net sales increased 12% to $10.7 billion compared to $9.6 billion in 2001.
- Income from continuing operations before taxes was $874 million, an increase from $865 million in 2001.
- Diluted earnings per share from continuing operations increased to $1.94 from $1.86 in 2001.
- The total number of stores operated increased 12% to nearly 1,665 stores worldwide.
ConocoPhillips reported financial highlights for Q4 2007 and full year 2007. Revenues for Q4 2007 were $54.3 billion compared to $42.5 billion for Q4 2006. Net income for Q4 2007 was $4.4 billion compared to $3.2 billion for Q4 2006. Earnings per share for Q4 2007 were $2.75 diluted compared to $1.91 diluted for Q4 2006. Cash flows from operating activities for 2007 were $24.6 billion compared to $21.5 billion for 2006. Capital expenditures for 2007 were $11.8 billion compared to $15.6 billion for 2006.
This 2003 annual report summarizes Cummins' financial performance and business highlights for 2003. Some key points:
- Sales increased 8% to $6.3 billion compared to 2002, with net earnings of $50 million.
- The engine business had sales of $3.6 billion, up 6% from 2002. Power generation sales were $1.3 billion, up 8% despite challenging market conditions. Filtration and other business sales reached a record $1.1 billion, up 11%.
- New partnerships and supply agreements were signed to expand the company's customer base. International joint ventures also grew, particularly in China and Asia.
- While markets remained difficult, the company focused on cost
Tricon Global Restaurants' 2000 annual report summarizes the company's financial performance and business strategy. While the company achieved 16% earnings per share growth, same store sales declined 2% in the US, driven by 5% and 3% declines at Taco Bell and KFC respectively. The bankruptcy of their main food distributor, AmeriServe, presented challenges but the company was able to arrange interim financing and transition to a new distributor, McLane Company. Going forward, Tricon's focus is on achieving sustainable sales growth through increasing customer satisfaction worldwide and driving same store sales and new unit growth both domestically and internationally.
This document provides consolidated financial highlights for Burlington Northern Santa Fe Corporation for the years 1991-1995. Some key points:
- Revenues grew from $4.559 billion in 1991 to $6.183 billion in 1995. Operating income improved from a loss of $239 million in 1991 to income of $526 million in 1995, excluding unusual merger-related charges.
- Net income was $92 million in 1995 but would have been $416 million without accounting changes and debt retirement costs related to the merger.
- Capital expenditures were $1.042 billion in 1995 and are planned to be nearly $1.7 billion in 1996 to support revenue growth and cost reduction initiatives.
This document summarizes the financial performance of Burlington Northern Santa Fe Corporation for the years 1992-1996. It reports that in 1996:
- Operating income increased 14% to $1.75 billion compared to 1995 on a comparable basis.
- Revenues reached $8.19 billion despite a drop in agricultural commodities revenues.
- Operating expenses were $178 million below 1995 levels, lowering the operating ratio to 78.6%.
- Net income grew 21% to $889 million, or $5.70 per share, compared to $733 million in 1995.
This annual report summarizes Burlington Northern Santa Fe Corporation's financial and operational performance in 1998. Some key highlights include:
- Revenues reached a record $8.94 billion, a 6.8% increase over 1997.
- Adjusted operating income grew 16% to a record $2.16 billion.
- Adjusted net income exceeded $1.12 billion, a 19% improvement over 1997.
- The operating ratio improved to 75.9%, nearly 2 points better than 1997's adjusted ratio.
- Safety continued to improve, with reductions in reportable injuries and rail accidents.
Burlington Northern Santa Fe Corporation's 1999 Annual Report summarizes the company's performance in 1999 and compares it to 1994, the year before the BNSF merger. Key points:
1) BNSF achieved record results in safety, customer service, efficiency and financial performance in 1999 compared to 1994.
2) Safety metrics like lost workdays and injuries dropped significantly. Customer service improved with 91% on-time performance. Operating expenses per ton-mile dropped 20-25%.
3) Financial results were also much stronger, with operating income reaching a record $2.24 billion, up 14% annually from 1994. The operating ratio improved 9 points to 75.4%.
Burlington Northern Santa Fe Corporation's 2000 Annual Report summarizes the company's performance for the year. Key points include:
- Revenues grew to $9.2 billion while operating expenses only increased 1% despite a $230 million rise in fuel costs.
- Intermodal revenues increased 6% to a record level while safety and efficiency improvements were made.
- However, weak coal demand, high fuel prices, and a slow US economy impacted results for the year.
- Over the past five years since the Burlington Northern and Santa Fe merger, significant progress has been made in safety, service, efficiency and financials.
This document is the 2001 Annual Report to Shareholders for Burlington Northern Santa Fe Corporation. It contains the following key information:
1) The CEO discusses BNSF's progress on its strategic priorities of People, Growth, Ease of Doing Business, Service, and Efficiency in 2001, noting challenges from the economic slowdown but some record achievements.
2) Safety improvements were made but injuries remained level, while discussions progressed with unions on safety agreements.
3) Revenues were flat in 2001 due to economic conditions, but some business lines like Mexico grew, and new customers and services helped capture additional market share.
4) Financial results disappointed expectations for revenue and operating ratio goals, though costs
BNSF is a major railroad network in the United States that transports a variety of goods. In 2003, BNSF saw revenue growth of 5% driven by strong intermodal growth, though on-time performance fell short of goals. Safety performance reached record levels with injury rates down significantly. Looking forward, BNSF aims to continue revenue growth through initiatives like expanding intermodal capacity and pursuing market-based pricing across all business lines.
Burlington Northern Santa Fe Corporation reported earnings of $0.36 per diluted share for the first quarter of 2001, compared to $0.55 per diluted share for the same period in 2000. Freight revenues were $2.26 billion, up slightly due to a 4% increase in ton-miles. Operating expenses increased 7% to $1.87 billion due to higher fuel costs, severe winter weather, and increased energy costs. The operating ratio was 81.5% compared to 77.3% in 2000. Revenue from agricultural commodities increased 11% while industrial revenues declined 3% and coal revenues declined 1% compared to the first quarter of 2000.
The document is Burlington Northern Santa Fe Corporation's 2nd Quarter 2001 Investors' Report. It summarizes that:
1) Earnings were $0.50 per diluted share compared to $0.53 per diluted share in the same period last year, with revenues remaining even despite 2% higher ton-miles.
2) Operating expenses were $65 million higher due to factors like flooding in the Midwest and higher fuel costs.
3) Operating income decreased to $428 million from $483 million last year, and the operating ratio increased to 80.9% from 78.4% last year.
The document is Burlington Northern Santa Fe Corporation's third quarter 2001 investors' report. Key points:
- Earnings per share were $0.58 compared to $0.64 in third quarter 2000. Freight revenues were $2.31 billion, even with last year.
- Operating expenses were higher by $69 million due to increased compensation, benefits, and fuel costs. Operating income was $502 million versus $571 million in 2000.
- 4.1 million shares were repurchased in the quarter, bringing the total under the buyback program to 101.1 million shares.
- The report provides financial statements and statistics on revenues, expenses, operations, and capital expenditures for
This document provides an annual investors' report for Burlington Northern Santa Fe Corporation for 2001. It includes key financial information such as earnings results for Q4 and full year 2001, operating revenues and expenses, balance sheet information, and cash flow information. Specifically, it notes that Q4 2001 earnings were $0.46 per share including workforce reduction costs, or $0.57 per share excluding those costs. For the full year, earnings were $1.87 per share including unusual items, or $2.08 per share excluding unusual items. It also highlights free cash flow of $443 million for the full year, up 3% from 2000.
1. Burlington Northern Santa Fe reported first quarter 2002 earnings of $0.45 per share, up from $0.34 per share in first quarter 2001, which included non-recurring losses.
2. Freight revenues decreased 6% to $2.14 billion due to softer demand across all major product sectors and mild winter weather reducing coal shipments.
3. Operating expenses decreased 4% to $1.8 billion due to reductions in fuel costs, compensation, and equipment rents, partially offsetting the revenue decline.
Burlington Northern Santa Fe reported earnings of $0.51 per share for Q2 2002, up slightly from $0.50 per share in Q2 2001. Freight revenues were $2.18 billion, down 3% from the previous year, with declines in coal, agricultural products, and industrial products offsetting growth in consumer products. Operating expenses decreased 2% despite lower fuel prices, helping maintain the operating ratio at 81.4%. The company also repurchased 4.2 million shares during the quarter.
The document is Burlington Northern Santa Fe Corporation's third quarter 2002 investors' report. It includes:
- BNSF reported earnings of $0.51 per share for Q3 2002, even with adjusted earnings of $0.56 per share for the same period in 2001.
- Freight revenues were $2.28 billion for Q3 2002, even with adjusted revenues of $2.28 billion for Q3 2001.
- Operating income decreased to $421 million for Q3 2002 compared to adjusted operating income of $470 million for Q3 2001, with the operating ratio increasing to 81.6% from 79.4%.
This document provides an annual investors' report for Burlington Northern Santa Fe Corporation for 2002. It includes:
1) Key financial highlights for Q4 2002 including $0.54 earnings per share, $2.27 billion in freight revenues, and $436 million in operating income.
2) Annual 2002 results including $2.00 earnings per share, $8.87 billion in freight revenues, and $1.66 billion in operating income.
3) Details of common stock repurchases totaling approximately 116 million shares under their repurchase program.
The Rise of Generative AI in Finance: Reshaping the Industry with Synthetic DataChampak Jhagmag
In this presentation, we will explore the rise of generative AI in finance and its potential to reshape the industry. We will discuss how generative AI can be used to develop new products, combat fraud, and revolutionize risk management. Finally, we will address some of the ethical considerations and challenges associated with this powerful technology.
1. Elemental Economics - Introduction to mining.pdfNeal Brewster
After this first you should: Understand the nature of mining; have an awareness of the industry’s boundaries, corporate structure and size; appreciation the complex motivations and objectives of the industries’ various participants; know how mineral reserves are defined and estimated, and how they evolve over time.
where can I find a legit pi merchant onlineDOT TECH
Yes. This is very easy what you need is a recommendation from someone who has successfully traded pi coins before with a merchant.
Who is a pi merchant?
A pi merchant is someone who buys pi network coins and resell them to Investors looking forward to hold thousands of pi coins before the open mainnet.
I will leave the what'sapp contact of my personal pi merchant to trade with
+12349014282
What price will pi network be listed on exchangesDOT TECH
The rate at which pi will be listed is practically unknown. But due to speculations surrounding it the predicted rate is tends to be from 30$ — 50$.
So if you are interested in selling your pi network coins at a high rate tho. Or you can't wait till the mainnet launch in 2026. You can easily trade your pi coins with a merchant.
A merchant is someone who buys pi coins from miners and resell them to Investors looking forward to hold massive quantities till mainnet launch.
I will leave the what's app number of my personal pi vendor to trade with.
+12349014282
when will pi network coin be available on crypto exchange.DOT TECH
There is no set date for when Pi coins will enter the market.
However, the developers are working hard to get them released as soon as possible.
Once they are available, users will be able to exchange other cryptocurrencies for Pi coins on designated exchanges.
But for now the only way to sell your pi coins is through verified pi vendor.
Here is the what'sapp contact of my personal pi vendor
+12349014282
how to sell pi coins effectively (from 50 - 100k pi)DOT TECH
Anywhere in the world, including Africa, America, and Europe, you can sell Pi Network Coins online and receive cash through online payment options.
Pi has not yet been launched on any exchange because we are currently using the confined Mainnet. The planned launch date for Pi is June 28, 2026.
Reselling to investors who want to hold until the mainnet launch in 2026 is currently the sole way to sell.
Consequently, right now. All you need to do is select the right pi network provider.
Who is a pi merchant?
An individual who buys coins from miners on the pi network and resells them to investors hoping to hang onto them until the mainnet is launched is known as a pi merchant.
debuts.
I'll provide you the what'sapp number.
+12349014282
^%$Zone1:+971)581248768’][* Legit & Safe #Abortion #Pills #For #Sale In #Duba...mayaclinic18
Whatsapp (+971581248768) Buy Abortion Pills In Dubai/ Qatar/Kuwait/Doha/Abu Dhabi/Alain/RAK City/Satwa/Al Ain/Abortion Pills For Sale In Qatar, Doha. Abu az Zuluf. Abu Thaylah. Ad Dawhah al Jadidah. Al Arish, Al Bida ash Sharqiyah, Al Ghanim, Al Ghuwariyah, Qatari, Abu Dhabi, Dubai.. WHATSAPP +971)581248768 Abortion Pills / Cytotec Tablets Available in Dubai, Sharjah, Abudhabi, Ajman, Alain, Fujeira, Ras Al Khaima, Umm Al Quwain., UAE, buy cytotec in Dubai– Where I can buy abortion pills in Dubai,+971582071918where I can buy abortion pills in Abudhabi +971)581248768 , where I can buy abortion pills in Sharjah,+97158207191 8where I can buy abortion pills in Ajman, +971)581248768 where I can buy abortion pills in Umm al Quwain +971)581248768 , where I can buy abortion pills in Fujairah +971)581248768 , where I can buy abortion pills in Ras al Khaimah +971)581248768 , where I can buy abortion pills in Alain+971)581248768 , where I can buy abortion pills in UAE +971)581248768 we are providing cytotec 200mg abortion pill in dubai, uae.Medication abortion offers an alternative to Surgical Abortion for women in the early weeks of pregnancy. Zone1:+971)581248768’][* Legit & Safe #Abortion #Pills #For #Sale In #Dubai Abu Dhabi Sharjah Deira Ajman Fujairah Ras Al Khaimah%^^%$Zone1:+971)581248768’][* Legit & Safe #Abortion #Pills #For #Sale In #Dubai Abu Dhabi Sharjah Deira Ajman Fujairah Ras Al Khaimah%^^%$Zone1:+971)581248768’][* Legit & Safe #Abortion #Pills #For #Sale In #Dubai Abu Dhabi Sharjah Deira Ajman Fujairah Ras Al Khaimah%^^%$Zone1:+971)581248768’][* Legit & Safe #Abortion #Pills #For #Sale In #Dubai Abu Dhabi Sharjah Deira Ajman Fujairah Ras Al Khaimah%^^%$Zone1:+971)581248768’][* Legit & Safe #Abortion #Pills #For #Sale In #Dubai Abu Dhabi Sharjah Deira Ajman Fujairah Ras Al Khaimah%^^%$Zone1:+971)581248768’][* Legit & Safe #Abortion #Pills #For #Sale In #Dubai Abu Dhabi Sharjah Deira Ajman Fujairah Ras Al Khaimah%^^%$Zone1:+971)581248768’][* Legit & Safe #Abortion #Pills #For #Sale In #Dubai Abu Dhabi Sharjah Deira Ajman Fujairah Ras Al Khaimah%^^%$Zone1:+971)581248768’][* Legit & Safe #Abortion #Pills #For #Sale In #Dubai Abu Dhabi Sharjah Deira Ajman Fujairah Ras Al Khaimah%^^%$Zone1:+971)581248768’][* Legit & Safe #Abortion #Pills #For #Sale In #Dubai Abu Dhabi Sharjah Deira Ajman Fujairah Ras Al Khaimah%^^%$Zone1:+971)581248768’][* Legit & Safe #Abortion #Pills #For #Sale In #Dubai Abu Dhabi Sharjah Deira Ajman Fujairah Ras Al Khaimah%^^%$Zone1:+971)581248768’][* Legit & Safe #Abortion #Pills #For #Sale In #Dubai Abu Dhabi Sharjah Deira Ajman Fujairah Ras Al Khaimah%^^%$Zone1:+971)581248768’][* Legit & Safe #Abortion #Pills #For #Sale In #Dubai Abu Dhabi Sharjah Deira Ajman Fujairah Ras Al Khaimah%^^%$Zone1:+971)581248768’][* Legit & Safe #Abortion #Pills #For #Sale In #Dubai Abu Dhabi Sharjah Deira Ajman Fujairah Ras Al Khaimah%^^%$Zone1:+971)581248768’][* Legit & Safe #Abortion #Pills #For #Sale In #Dubai Abu Dhabi Sharjah Deira Ajman
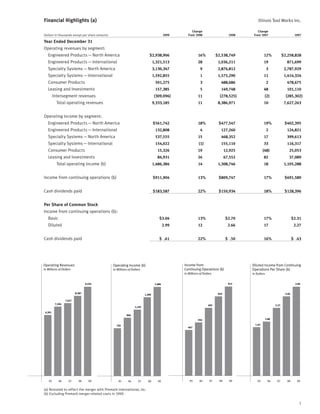
1. Financial Highlights (a) Illinois Tool Works Inc.
Change Change
Dollars in thousands except per share amounts From 1998 From 1997
1999 1998 1997
Year Ended December 31
Operating revenues by segment:
Engineered Products — North America $2,938,906 16% $2,538,749 12% $2,258,828
Engineered Products — International 1,321,513 28 1,036,211 19 871,699
Specialty Systems — North America 3,130,347 9 2,876,812 3 2,787,929
Specialty Systems — International 1,592,855 1 1,575,290 11 1,414,324
Consumer Products 501,275 3 488,686 2 478,675
Leasing and Investments 157,385 5 149,748 48 101,110
Intersegment revenues (309,096) 11 (278,525) (2) (285,302)
Total operating revenues 9,333,185 11 8,386,971 10 7,627,263
Operating income by segment:
Engineered Products — North America $561,742 18% $477,547 19% $402,395
Engineered Products — International 132,808 4 127,260 2 124,821
Specialty Systems — North America 537,555 15 468,352 17 399,613
Specialty Systems — International 154,022 (1) 155,110 33 116,317
Consumer Products 15,326 19 12,925 (48) 25,053
Leasing and Investments 84,931 26 67,552 82 37,089
Total operating income (b) 1,486,384 14 1,308,746 18 1,105,288
Income from continuing operations (b) $911,904 13% $809,747 17% $691,589
Cash dividends paid $183,587 22% $150,934 18% $128,396
Per Share of Common Stock
Income from continuing operations (b):
Basic $3.04 13% $2.70 17% $2.31
Diluted 2.99 12 2.66 17 2.27
Cash dividends paid $÷.61 22% $÷.50 16% $÷.43
Income from
Operating Revenues Diluted Income from Continuing
Operating Income (b)
Continuing Operations (b) Operations Per Share (b)
In Millions of Dollars In Millions of Dollars
In Millions of Dollars In Dollars
912
9,333 2.99
1,486
8,387 810 2.66
1,309
7,627
7,264 692 2.27
1,105
6,391
966
1.80
544
1.62
792
467
95 96 97 98 99
95 96 97 98 99 95 96 97 98 99
95 96 97 98 99
(a) Restated to reflect the merger with Premark International, Inc.
(b) Excluding Premark merger-related costs in 1999.
1
2. To Our Stockholders
With the advent of a new century, it seems that every newspaper, magazine and
organization has put out its “Best Of ” list. At ITW, when we look back it’s not
to applaud milestones, but rather to check our map and compass to make sure
we are on course for the future.
ITW has demonstrated over a sustained period that a diversified manufacturing
company can produce value-added products that anticipate and meet customers’
needs in a manner that all parties consider profitable. To continue to achieve these
results requires focus in every one of our more than 500 businesses. It is critical
that each of our business units constantly evolves, so they can provide customers
with highly engineered product and system solutions as well as keep pace with
the demands of ever-changing markets. Change will continue to present us with
worldwide opportunities for greater creativity and renewal. It’s how we have
made our mark and how we will continue to operate.
The proof is in our numbers. We closed 1999 by achieving record revenues
of $9.3 billion, an 11 percent increase compared to the prior year. Excluding the
one-time charge associated with our November 23, 1999, merger with Premark
International, operating income and net income for the year grew a strong 14 percent
and 13 percent, respectively. At the same time, our operating margins improved
30 basis points year over year.
ITW’s record of sustained “quality” earnings is the result of a very practical view of
the world. We rely on market penetration rather than price increases to fuel operating
income growth and our conservative accounting practices serve as a reliable yardstick
of financial performance. These results then generate the cash needed to fund our
growth—through both investing in core businesses and acquisitions.
Our core businesses continued to improve as 1999 progressed. While our
businesses grew at a three percent rate for full-year 1999, our internal rate of growth
registered five percent in the second half of the year. Our revenue growth was
primarily attributable to impressive performances from a variety of automotive,
construction, and industrial and consumer packaging businesses.
In 1999, we continued to be active on the acquisition front. Specifically
we completed 31 “bottom-up” acquisitions — companies that are directly
related to or integrated into an existing product line or market. These transactions,
representing more than $900 million in combined revenues, are typically initiated
by operating management for both North American and international businesses.
Looking ahead, our pipeline of potential acquisitions remains full.
A second type of acquisition, which we undertake far less frequently,
is a major, “top-down” proposition. These transactions are identified by senior
management and represent entirely new businesses for ITW. We completed
the largest transaction of this type in our history when ITW merged with Premark
in late 1999.
This merger brings us nearly 80 decentralized businesses with products
marketed in more than 100 countries. Two principal lines of business—commercial
food equipment and laminate products used in construction — represent
approximately $2.5 billion in revenues. Their products have strong brand names
such as Hobart, Wilsonart, Traulsen, Vulcan and Wittco, established market
positions, good distribution channels and benefit from value-added engineering —
all the things we look for in a successful acquisition.
We continue to actively manage and change these businesses so we can blend
their considerable strengths with ITW attributes. As we do that we expect
operating margins to improve. Our goal is to double operating margins from
9 percent to 18 percent within a five-year time frame. That goal of doubling
margins may sound ambitious but it is in line with what we have accomplished
on other large acquisitions we have made in the past.
We also continue to maximize our returns through selected investment
2
3. Clockwise (from upper left):
Hugh J. Zentmyer,
executive vice president;
James M. Ringler,
vice chairman;
F. Ronald Seager,
executive vice president;
Thomas J. Hansen,
executive vice president;
Frank S. Ptak,
vice chairman;
Dennis J. Martin,
executive vice president.
Clockwise (from upper left):
Jon C. Kinney,
chief financial officer;
Russell M. Flaum,
executive vice president;
Allan C. Sutherland,
senior vice president;
W. James Farrell,
chairman and chief
executive officer;
David B. Speer,
executive vice president.
3
4. opportunities. Our Leasing and Investment segment helps our bottom line through
its long-term strategy of tax planning and opportunistic investing.
To emphasize what is critically important to us, this year’s annual report focuses
on key elements of our performance strategy—the people who drive our success,
how we optimize our core businesses and how we benefit from acquisitions. These
strategies are fundamental to how we continue to manage a successful company.
ITW’s reputation around the world is a reflection of our people, their productivity
and creativity. You can have brilliant strategies, the best in the world, but if
you don’t have committed and enthusiastic people to implement, maintain and
grow them, they’re nothing but words. Our decentralized structure offers enhanced
career opportunities and it creates an environment in which people are self-
motivated to excel.
Our approach to managing both core and newly acquired businesses is
to ensure that these operations are small and focused. At ITW, being focused
means applying the 80/20 process to everything we do. We literally build
our businesses around this concept. This initially means focusing on the 20 percent
of each business’ customers that, we find, account for 80 percent of sales.
At ITW, our analysis leads to specific actions. Product development is keyed to
top customers, resulting in proprietary products which make ITW a leader in
patents issued each year. The same 80/20 process is also applied to how we sell,
work with suppliers, and utilize equipment, space and capital.
Even though 1999 was a very successful year for ITW, our focus, as always,
remains on the future. To help us prepare for the future, we continue to add to our
already strong management team. Jim Ringler joined us as a Vice Chairman as part
of the ITW and Premark combination. We look forward to Jim’s strong operational
contributions and years of experience. While we welcomed Jim, we said goodbye
to a longtime ITW employee. Tom Buckman, vice president of patents and technology,
retired in March of 2000 after serving 30 years with the company. We will always
value Tom’s strong contributions to the company and we wish him well in the years
ahead. With Tom’s retirement, Mark Croll has taken his place. Mark has worked
in the patent area for nearly 6 years, demonstrating both strong technical know-
how and management capabilities.
We are also bidding goodbye to Director Ormand Wade. After 15 years on the
board, Orm opted not to stand for re-election this year. We thank him for his many
valuable contributions to the company over the years and wish him the very best.
I’m pleased to announce that Don Davis, Chairman and CEO of Rockwell International
Corporation, has been nominated to fill this board position.
Looking ahead, we will be open to new, better, different, faster or, when
appropriate, slower ways of doing things. Whether it is building our Internet
capabilities or ensuring that our product development remains a top priority, we
know change is constant, healthy and important as we continue to strengthen
our company.
We can’t say with certainty what the next 100, 50 or even 10 years have
in store for ITW. No one can. What we can say is ITW has strong core businesses,
a solid growth strategy and an abundance of talented, experienced and motivated
people. In our opinion, this puts ITW in the best possible position to build on
our past successes and create even better value for, and relationships with, our
customers, suppliers, employees and stockholders.
W. James Farrell
Frank S. Ptak James M. Ringler
Chairman and
Vice Chairman Vice Chairman
Chief Executive Officer
4
6. People
Drive
Success
T H E P E O P LE W H O M A K E U P O U R B U S I N E S S U N ITS LOV E CO M P E T I N G AG A I N ST
B I G CO M PA N I E S . I T ’ S N OT T H AT W E ’ R E S M A RT E R . IT ’ S S I M P LY T H AT IT W P E O P LE A R E
H I G H LY F O C U S E D O N S P E C I F I C M A R K E T N I C H E S . E AC H O F O U R M O R E THA N
500 B U S I N E S S U N ITS I S A N E NTR E PR E N E U R IA L OPE RAT ION, W ITH PEOPLE
P R AC T I C A L , C LE A R - T H I N K I N G
AT A L L LE V E L S W H O B R I N G Y E A R S O F
E X P E R I E N C E TO T H E B E N E F I T O F O U R C U STO M E R S .
6
7. Buildex has built a brand
name in the construction
products marketplace
due to the efforts of its
employees, including
(clockwise; from upper left):
Renaldo Hilt; Alicia
Wieder; Geoff Orris; and
Lidia Molina.
Angleboard, a well known
ITW packaging business,
has made its reputation
in the marketplace thanks
in part to contributions
from employees such as
(clockwise; from upper left):
James Moman; Galo
Barzallo; Vincent Hill; and
Rodney Arseneau.
7
8. Growth
via
Core
Businesses
E STA B L I S H E D B U S I N E S S E S W IT H D E M O N ST R AT E D T R AC K R E CO R D S
A R E AT T H E H E A RT O F O U R S U C C E S S . E AC H O F O U R D E C E N T R A L I Z E D B U S I N E S S E S I S
CO M M IT T E D TO E V E R - I M P ROV I N G P RO D U C T I N N OVAT I O N A N D Q U A L IT Y, M A N U FAC T U R I N G
E X P E RT I S E A N D M A R K E T I N G K N OW- H OW. BY F O C U S I N G O N S P E C I F I C M A R K E T S E G M E N TS
C LO S E TO C U STO M E R S , W E D E V E LO P P RO D U C TS T H AT
A N D STAY I N G
F E AT U R E B OT H S O LU T I O N S A N D S AV I N G S I N T E R M S O F M AT E R I A L CO STS , P RO C E S S
T I M E A N D S PAC E R E Q U I R E M E N TS .
8
9. E N G I N E E R E D P R O D U C TS
Anchor Stampings
For nearly 50 years, Anchor Stampings has supplied precision parts to U.S. auto
manufacturers both directly and indirectly through partnerships with other
auto parts manufacturers. Anchor’s light and heavy stamping divisions produce
a wide range of products, including body mounts, seal plugs and pac nuts.
The newest version of the Snap Together Body Mount will be used in the
2000 Ford Explorer. It incorporates a new plastic shank, co-developed with ITW
Deltar, that provides an engineered cost reduction. Anchor Stampings sells
these body mounts to other auto parts makers who add a rubber puck-shaped
bumper. With utility vehicles and light trucks utilizing from 6 to 12 sets of
body mounts per vehicle, this new design makes for much quicker assembly.
Paslode
Paslode designs and manufactures a full line of pneumatic and cordless fastening
systems, a full assortment of stapling systems and a wide variety of nails
and staples for construction, remodeling and industrial applications. In 1959
the business unit was the first to introduce a pneumatic tool with its light-duty
upholstery tacker, followed soon after by the first commercially accepted
pneumatic nailer.
The compact design of Paslode’s newest product, the Impulse TrimMaster finish
nailer, combines an angled magazine with cordless technology to give operators
the convenience and mobility of use to reach tight spots with greater ease.
TrimMaster’s light weight and balance greatly reduce operator fatigue. The fuel
cell, rechargeable battery and fasteners load quickly for fast set-up time.
Henschel
Henschel develops and manufactures engine components for European-based
automakers. They supply coolant regulators/distributors, fuel rails, oil separating
systems and air ducting parts/throttle valves directly to auto manufacturers.
The business unit is a leading supplier to Volkswagen’s facilities in Germany, the
Czech Republic, Spain, Brazil and Mexico.
The latest product innovation from Henschel is a water temperature sensor for
the coolant regulation system on the Fabia, a new compact car being introduced by
Volkswagen Group-Skoda (Czech Republic) in 2000. This ultra-fast and accurate
sensor provides information to the Engine Management Unit (EMU) that regulates
fan control, fuel injection control, temperature management and the cockpit-
meter. The EMU on the Fabia reduces fuel consumption by more than three percent
while lowering exhaust emission levels.
9
10. E N G I N E E R E D P R O D U C TS
Wilsonart
Founded in Texas in 1956, Wilsonart has grown into one of the leading international
manufacturers and marketers of decorative surfacing products. Wilsonart
Laminate is available in hundreds of design and color options for a wide variety
of residential and commercial applications. A full range of product offerings
includes Wilsonart Custom Edges; Wilsonart SSV and Wilsonart Gibraltar Solid
Surface for countertops, backsplashes and vanities; Wilsonart Decorative Metals
for metallic finishes; and a line of drop-in sinks under the Wilsonart Plumbing
Products name.
Wilsonart Flooring is available in a wide range of wood grain plank and stone-
look tile styles. This flooring has the strength to stand up to high-traffic
residential areas, such as kitchens, great rooms or kids’ rooms, and medium
traffic commercial zones.
SPIT
The Fix Z metal torque control expansion anchor manufactured by SPIT is among
the first such products to achieve European Technical Approval (ETA). Fix Z was
tested in cracked and non-cracked concrete settings and achieved the highest ETA
rating. Construction products must meet strict technical standards and pass
essential safety testing to obtain this certification, which allows Fix Z to be sold
freely throughout the European Community.
SPIT manufactures and distributes powder actuated tools and fasteners; a full
line of electric rotary hammers and cutting machines; and anchor products and
consumables for builders, dry wallers, electricians, plumbers and steel fabricators.
It has a network of technical advisors throughout Europe and distributors in
more than 50 countries.
Minigrip/Zip-Pak
Minigrip developed the first zipper fastener technology for flexible packaging in
the 1950s for use in products such as children’s pencil and crayon cases. This
concept was introduced as a home storage application in 1971 when Dow licensed
Minigrip/Zip-Pak technology and debuted Ziploc® bags. Flexible fastening for
resealable consumer package goods was introduced in 1986 with Sargento Cheese.
It featured a zipper that allowed for quick, simple and repetitive opening
and closing. Today, growing consumer preference and new technology in package
manufacturing are driving greater demand for Minigrip/Zip-Pak products.
The latest development is UltraSeal, a flexible fastener that can be applied
to packaging material at lower temperatures, allowing for greater line speed.
Mrs. Butterworth’s Pancake Mix and other granular products are now using
a wide-track version of UltraSeal.
10
11. E N G I N E E R E D P R O D U C TS
Plexus
A new adhesive developed by Plexus provides the structural bonding component
found in Cannondale Bikes’ Raven II, the world’s lightest, all-composite mountain
bike. Plexus was selected as a preferred supplier because of its ability to quickly
develop a new adhesive capable of bonding dissimilar materials and withstanding
the rigors of mountain biking.
Plexus is a recognized leader in the adhesives industry. It markets patented
methacrylate adhesives for structural bonding of nearly all thermoplastics,
metals and composite materials. A key benefit to Plexus adhesives is their ability
to provide extremely durable bonds with minimal surface preparation. Its
products have proven track records in the most demanding applications for the
transportation, marine and engineered construction industries.
Fastex
Fastex Distributor Businesses have developed a plastic heat sink clip for the
newest Pentium Processor. In addition to adhering securely and ensuring
consistent pressure, the product provides superior performance for increasing
thermal demands. This is just one of a number of applications that Fastex
is developing in partnership with Intel to enable manufacturers to incorporate
Pentium Processors into their system boards.
This business unit’s strength comes from more than 40 years experience developing
custom fastening solutions for a wide variety of industries, particularly electronics
and computer OEMs, and office furniture manufacturers. Its plastic and metal non-
threaded fasteners and components include panel fasteners, wire management,
PC board supports/spacers, self-adhesive bumpers and leg levelers.
S P E C I A LT Y S Y S TE M S
Ransburg
Decades ago, Ransburg introduced the electrostatic process used in many painting
applications. Today, it designs, manufacturers and markets liquid electrostatic paint
application equipment around the world. In addition to superior performance,
Ransburg products offer positive environmental benefits to industrial manufacturers
and commercial painters. Their product line ranges from rotary atomizers and
electrostatic guns to testing, fluid mixing and monitoring equipment.
The Aerobell 33R Robotic Rotary Atomizer represents the latest and best technology
for robotic electrostatic liquid coating applications. The first major installation
of the 33R was at Daimler-Chrysler’s Windsor, Ontario assembly plant. Robot
mounted Aerobell 33R’s are now applying clear coat to minivans in the reprocess
booth. Ransburg won this contract by outperforming its competition during
lab demonstrations while also being able to meet a tight delivery schedule and
maintaining a superior working relationship with this facility.
11
12. S P E C I A LT Y S Y S TE M S
Hobart
Hobart has been the world’s leading innovator in food equipment, systems and
service for more than a century. Its food preparation systems are commonly used
in restaurants, hotels, supermarkets, bakeries and other commercial settings.
The business has a nationwide network of service technicians, and sales and service
branches in 100 countries.
Hobart’s 2000 Series Slicers received the 1999 Award for Distinguished Development,
given just once every two years by the Foodservice Consultants Society
International. This model in the 2000 Series is equipped with an electronic portion
scale, digital display and operator keypad for portioning by weight or number
of slices. The automatic features deliver consistent product to customers, help
users minimize shrink and allow employees to perform other tasks while the
slicer is operating. The built-in scale also frees up much needed counter space.
Grawo
During the past 25 years, Grawo has developed into a multifaceted and diversified
business and a leader in engraving, tools and molds for customers around the
world. From their facilities in Switzerland, Grawo offers clients in the industrial
engraving, plastics processing and printing industries a full spectrum of services.
Industrial engraving clients turn to Grawo for engraving, steel stamps, molds
for casting processes and precision tools. Plastic processors are customers
for metal and silicone stamps, silicon plates, holding fixtures, rollers and total
solutions for foil stamping. The printing industry utilizes Grawo’s full line
of dies, plates, rotary systems, counterpunches and tools for foil stamping
and embossing.
Miller Electric
Miller Electric’s XR Edge push-pull wire feed system offers unparalleled performance
for aluminum MIG welding. The system features a totally new gooseneck gun
design that is ideally suited for applications requiring complete maneuverability
and joint accessibility when welding in small areas. The unique push-pull
design of the XR Edge offers smooth, uninterrupted feeding performance without
deforming or defacing the aluminum.
Miller Electric is a leading designer, innovator and manufacturer of arc welding
equipment and related systems that provide long-lasting and superior quality
for metalworking, construction, maintenance and many other welding applications.
12
13. S P E C I A LT Y S Y S TE M S
Hi-Cone
Hi-Cone is the inventor and a leading worldwide manufacturer of recyclable ring
packaging for the beverage, food and general products industries. For more than
30 years, Hi-Cone has led the industry in addressing concerns related to the
environmental impact of packaging. Its efforts have resulted in products that
minimize materials and utilize photodegradable resins. This business unit is
also known for its Ring Leader Recycling Program — an educational program that
enables students to learn about and participate in closed-loop recycling in
partnership with their schools and the beverage industry.
The newest product offering from Hi-Cone is the Merchandising Panel Carrier.
Beverage companies around the world are taking advantage of this unique,
low-cost opportunity for promotion of price, consumer education, new products,
branding and other marketing messages.
Dynatec
The DYNAFIBER UFD Omega Hot-Melt Adhesive Applicator is the latest innovation
from Dynatec. The patented Omega Applicator individually coats elastic strands
used in critical areas of diapers. Spiral spray, the former technology, only allowed
for partial wrapping of the adhesive fibers and often resulted in applicator
plugging and excessive adhesive lay down. The Omega Applicator’s exclusive built-in
filter virtually eliminates nozzle plugging, which yields improved line efficiencies.
With the Omega applicator, customers report using as much as 40 percent
less adhesive.
Dynatec engineers, manufactures, sells, installs and services adhesive application
equipment for the packaging, product assembly, converting and non-woven
markets around the world. The business unit’s success is built on finding adhesive
application needs in niche markets and meeting those needs with superior
products and service.
Signode
For nearly a century, Signode has been a leading worldwide supplier of packaging
solutions for industrial needs. Today, it is a premier provider of steel and plastic
strapping systems for use in packaging and material handling. These systems
include manual and pneumatic hand tools, power strapping machines, the
consumables that run through them and post-sale service and support. Signode’s
products are used around the world in a broad range of industries to secure
everything from cotton bales and newspapers to steel coils and corrugated cartons.
In 1999, Signode Container Industry Systems introduced its operatorless
LB-6520 corrugated bundling machine. The result of extensive research and
customer involvement, the LB-6520 integrates Signode’s simple, jam-resistant,
LB-Series strapping head, patented automatic cut-off and refeed feature
with a complete offering of industry-specific options.
13
14. Growth
Through
Acquisitions
AC Q U I S IT I O N S — B OT H S M A L L A N D B I G — A R E A N I M P O RTA N T A S P E C T O F IT W ’ S G ROW T H
B RO A D E N A N E X I ST I N G B U S I N E S S U N IT ’ S
ST R AT E G Y. W E LO O K F O R CO M PA N I E S T H AT
C A PA B I L IT I E S , E X PA N D O U R O F F E R I N G S I N TO N E W M A R K E TS O R E X T E N D
T H E R A N G E O F C U R R E N T P RO D U C T L I N E S . S I N C E 19 7 0 , AC Q U I S IT I O N S H AV E P L AY E D
A N I N CR E A S I N G LY G R E AT E R RO LE I N O U R G ROW T H — O N B OT H T H E TO P A N D B OT TO M L I N E S .
R E P R E S E N TAT I V E AC Q U I S IT I O N S A R E N OT E D O N T H E F O L LOW I N G T I M E L I N E .
14
15. 1970
Chronomatic
A leading supplier of polymer thick film technologies, Chronomatic supplies the automotive and appliance
industries with materials and processes used to create value-added printed circuit boards.
1976
Devcon
Devcon manufactures the world’s most dependable line of maintenance, repair, production and tooling
epoxies, urethanes, adhesives and sealants. Its focus is adhesives for industrial customers, engineered
coatings and linings for process industries, and home repair products for consumers.
1985
Norwood Marking Systems and Ramset/Red Head
• Targeting consumer products manufacturers, Norwood Marking Systems’ equipment provides solutions
for printing variable information on flexible packaging material. • Ramset/Red Head is America’s
largest designer and manufacturer of fastening products used in concrete and steel construction.
1986
Paslode and Signode
• Paslode’s pneumatic and cordless fastening systems are used in a wide range of construction and
manufacturing applications. • Signode is a leading supplier of industrial packaging solutions, ranging
from hand tensioning-and-sealing tools to power strapping machines.
1989
Gema, Ransburg and Simco
• For more than 35 years, Gema has led the powder coating systems industry. • Ransburg markets a full range
of electrostatic painting equipment, including rotary atomizers, applicator guns, testing devices and fluid
mixing products. • Simco is the premier manufacturer of ionization and cleanroom static control products.
1990
Accu-Lube, Akron Standard and DeVilbiss
• Accu-Lube offers natural-based lubricants and micro-lubrication systems for metalworking.
• Akron Standard produces systems that measure the uniformity of automobile and light truck tires.
• DeVilbiss products are widely used for spraying solvent-based and waterborne coatings.
1993
Miller Electric and PRO/MARK
• Miller Electric is a leading maker of arc welding equipment for metalworking, construction, maintenance
and other applications. • Customized, thermally applied graphics produced by PRO/MARK equipment
decorate, mark and identify a wide range of consumer and industrial products.
1994
Loveshaw and OXO
• Loveshaw manufactures equipment under the Little David brand name for case forming, sealing, labeling,
marking and coding. • OXO Welding Equipment is a major supplier of premium equipment and
accessories, including MIG welding guns and torches and consumable parts.
1996
Hobart Brothers, Medalist and Orgapack
• Hobart Brothers provides superior utility power welding supplies, filler metals and ground power units.
• Medalist produces fasteners and hardware for automotive manufacturing and industrial applications.
• Orgapack’s focus is steel and plastic strapping systems for a variety of packaged materials.
1998
CIP, Reddi-Pac and TACC
• CIP makes fasteners and stampings for automotive, appliance, computer and farm machinery manufacturers.
• Reddi-Pac crates improve durability and flexibility while reducing assembly time. •TACC produces
adhesive caulks and sealants with an emphasis on environmentally friendly materials.
15
16. Key 1999
Acquisitions E N H A N C E A N D E X PA N D
AC Q U I S IT I O N S — “ B OT TO M - U P ” A D D IT I O N S T H AT
O U R E X I ST I N G O F F E R I N G S O R “ TO P - D OW N ” P U R C H A S E S T H AT I N T RO D U C E
N E W P RO D U C T L I N E S — W E R E A M A J O R PA RT O F IT W ’ S STO RY I N 1999 .
W E AC Q U I R E D 31 S M A L L E R CO M PA N I E S T H AT D I R E C T LY R E L AT E TO E X I ST I N G P RO D U C T
L I N E S O R M A R K E TS . T H E P R E M A R K M E R G E R , O U R L A R G E ST BY FA R , A D D E D N U M E RO U S
D E C E N T R A L I Z E D B U S I N E S S U N ITS , W IT H T WO P R I N C I PA L P RO D U C T L I N E S
TA K I N G U S I N TO N E W M A R K E TS .
16
17. Wilsonart International
As part of our merger with
Premark, Wilsonart broadens
ITW’s product offerings to
the construction market
through a variety of
decorative laminates for
countertops, furniture
and flooring (shown here).
Wilsonart flooring is a
growing part of the business
and showcases the unit’s
core strengths in high-
pressure laminate,
technology and marketing
for both residential and
commercial applications.
17
18. ITW Specialty Films Co. Ltd.
Our geographic and industry
presence in decorating
systems and products was
significantly expanded by the
purchase of SKC Specialty
Films. Its global operations
broaden the metallic hot
stamp foil product lines of
Maple Roll Leaf and ITW
Eurofoil, complement the
products of ITW Holographic
and Specialty Films and
extend the thermal transfer
ribbon offerings of ITW
Coding Products.
Duo-Fast Corporation
ITW further expanded its posi-
tion in the fastening products
industry with the purchase
of Duo-Fast Corporation. With
manufacturing facilities in
eight countries and distribution
on five continents, Duo-Fast’s
products and markets are
complementary to ITW’s
global construction-related
businesses. Its product line
includes pneumatic stapling
and nailing tools with a
wide array of highly engineered
fasteners.
18
19. Prime Source
Prime Source MRO Businesses,
acquired from Morgan Crucible
Company plc, greatly enhance
the global presence of ITW’s
specialty fluids. Its products
are marketed internationally
under brand names that
include American Safety
Technologies, Chemtronics,
LPS, Magna and Rocol. LPS
Laboratories’ LPS-1 brand of
greaseless lubricants is just
one of the categories of
high-performance, innovative
chemical products made
by Prime Source.
Trident Inc.
Trident’s patented impulse
ink jet print heads and
ink delivery systems are used
by OEMs worldwide. This
acquisition represents a major
extension of ITW’s industrial
packaging systems offerings,
complementing products
from Dynatec and Loveshaw.
Trident’s UltraJet II bar code
printhead allows printing onto
packaging, eliminating the
need for labels or the inventory
of preprinted cartons.
19
20. F I N A N C I A L CO N T E N TS
Management’s Discussion and Analysis 21
Statement of Income 27
Statement of Income Reinvested in the Business 27
Statement of Comprehensive Income 27
Statement of Financial Position 28
Statement of Cash Flows 29
Report of Independent Public Accountants 30
Notes to Financial Statements 30
Quarterly and Common Stock Data 45
Eleven-Year Financial Summary 46
20