More Related Content
Similar to EmployeeGoalSetting
Similar to EmployeeGoalSetting (20)
EmployeeGoalSetting
- 1. input data in cells this color Increase Goal
Q1 10%
Service Provider: Q2 10%
Current Level: 3 Q3 10%
Number Days per Week: 3 Q4 10%
RTS Goal 15%
SERVICE GOALS RETAIL GOALS
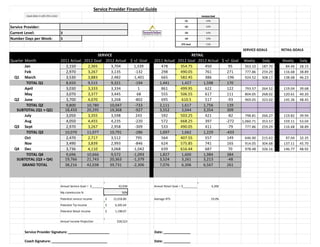
Quarter Month 2011 Actual 2012 Goal 2012 Actual $ +/- Goal 2011 Actual 2012 Goal 2012 Actual $ +/- Goal Weekly Daily Weekly Daily
Jan 2,150 2,365 3,704 1,339 478 354.75 450 95 563.10 187.70 84.46 28.15
Feb 2,970 3,267 3,135 -132 298 490.05 761 271 777.86 259.29 116.68 38.89
March 3,530 3,883 2,482 -1,401 665 582.45 386 -196 924.52 308.17 138.68 46.23
8,650 9,515 9,321 -194 1,441 1,427 1,598 170
April 3,030 3,333 3,334 1 861 499.95 622 122 793.57 264.52 119.04 39.68
May 3,070 3,377 3,445 68 555 506.55 617 111 804.05 268.02 120.61 40.20
June 3,700 4,070 3,268 -802 695 610.5 517 -93 969.05 323.02 145.36 48.45
9,800 10,780 10,047 -733 2,111 1,617 1,756 139
18,450 20,295 19,368 -927 3,552 3,044 3,354 309
July 3,050 3,355 3,598 243 592 503.25 421 -82 798.81 266.27 119.82 39.94
Aug 4,050 4,455 4,235 -220 572 668.25 397 -272 1,060.71 353.57 159.11 53.04
Sept 2,970 3,267 2,958 -309 533 490.05 411 -79 777.86 259.29 116.68 38.89
10,070 11,077 10,791 -286 1,697 1,662 1,229 -433
Oct 2,470 2,717 3,512 795 564 407.55 557 149 646.90 215.63 97.04 32.35
Nov 3,490 3,839 2,993 -846 624 575.85 741 165 914.05 304.68 137.11 45.70
Dec 3,736 4,110 3,068 -1,042 639 616.44 687 70 978.48 326.16 146.77 48.92
9,696 10,666 9,572 -1,093 1,827 1,600 1,984 384
19,766 21,743 20,363 -1,379 3,524 3,261 3,213 -48
38,216 42,038 39,731 -2,306 7,076 6,306 6,567 261
Annual Service Goal = $____________ 42,038 Annual Retail Goal = $______________ 6,306
My commission % 50%
21,018.80$ Average RTS 19.0%
Potential Tip Income 6,305.64$
Potential Retail Income 1,198.07$
$28,523
Service Provider Signature: _______________________ Date: _______________
Coach Signature: _______________________________ Date: _______________
SUBTOTAL (Q3 + Q4)
GRAND TOTAL
Potential service income
Annual Income Projection
TOTAL Q2
SUBTOTAL (Q1 + Q2)
Q3
TOTAL Q3
Q4
TOTAL Q4
Q2
Service Provider Financial Guide
SERVICE RETAIL
Q1
TOTAL Q1