Download to read offline

![4
International Scene cont’d
GDP Growth Rates and Projections for Selected Countries
Country 2013 2014 2015*
USA 2.2 2.2 3.1
UK 1.7 3.0 2.7
Japan 1.5 0.4 0.8
Euro Area -0.4 0.8 1.1
China 7.7 7.4 7.1
Uganda 5.8 5.9 6.3
Tanzania 7.0 7.2 7.0
Rwanda 4.7 6.0 6.7
Burundi 4.5 4.7 4.8
South Africa 2.0 1.4 2.3
• Source: OECD and World Economic Outlook [IMF]
*Projections](https://image.slidesharecdn.com/technicalpresentationones201524042015-1final2-150429062358-conversion-gate01/85/Technical-presentation-on-es2015-24042015-1-final-2-4-320.jpg)

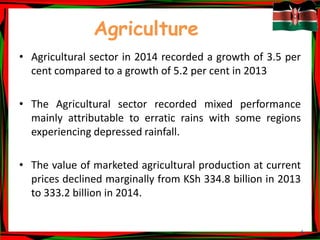
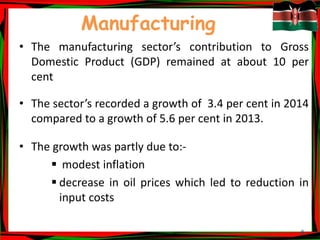
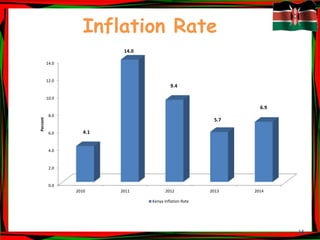
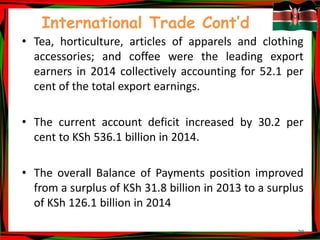

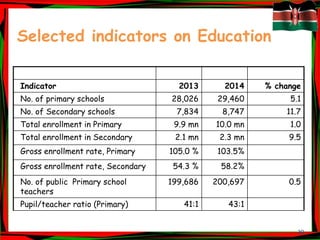
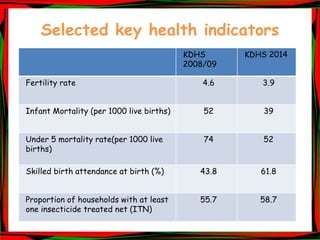
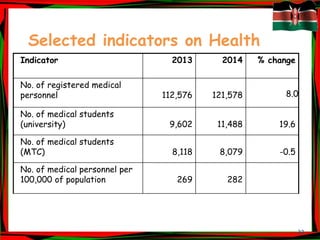
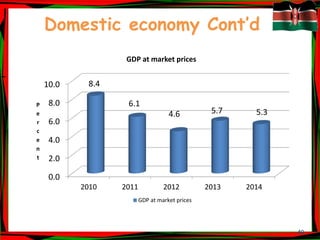
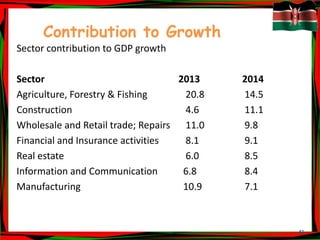
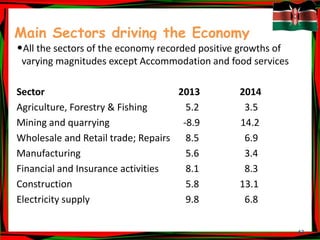
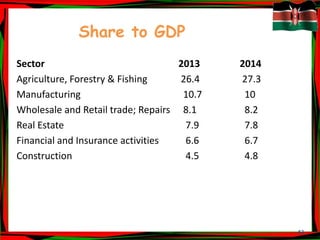


This document provides a summary of Kenya's economic performance in 2014. Some key points: - The economy grew by 5.3% in 2014, down from 5.7% in 2013. Inflation increased slightly to 6.9%. - Agriculture grew by 3.5%, manufacturing by 3.4%, and the building/construction sector grew strongly at 13.1%. - International trade deficit widened as imports grew faster than exports. Tourism earnings and arrivals declined. - Social indicators showed improvements, with declines in infant mortality and increases in education enrollment.


![5G Explained! A High Level Overview [Introduction]](https://cdn.slidesharecdn.com/ss_thumbnails/5gexplainedahighleveloverview-260119165306-cc137a3e-thumbnail.jpg?width=640&height=640&fit=bounds)


