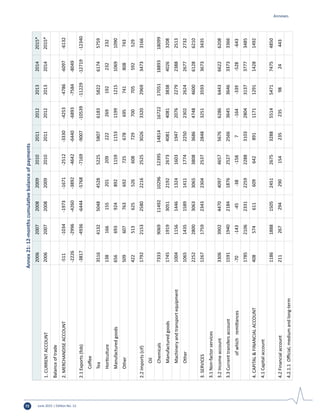
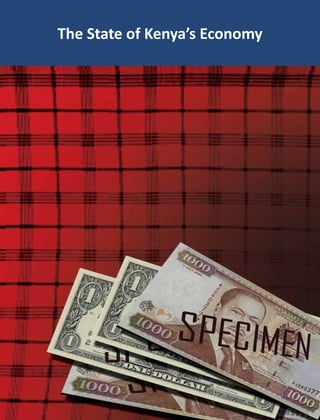
The document discusses the state of Kenya's economy, focusing on public participation. It finds that while Kenya's economic growth remained solid in 2014, it faces strong headwinds. Key risks to growth include lack of security, weak transmission of lower oil prices, and vulnerabilities in the external sector like high current account deficits. The document also examines counties' experience implementing public participation since devolution and ways it could be enhanced to make devolution more effective.


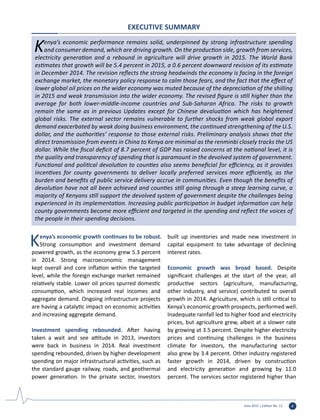
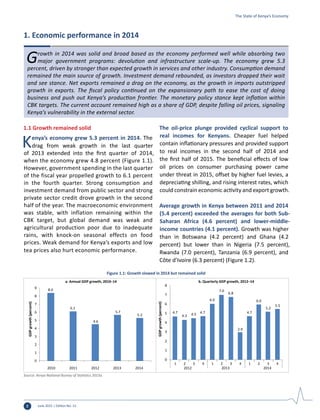
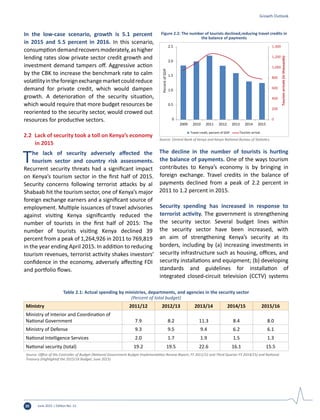
![June 2015 | Edition No. 12 9
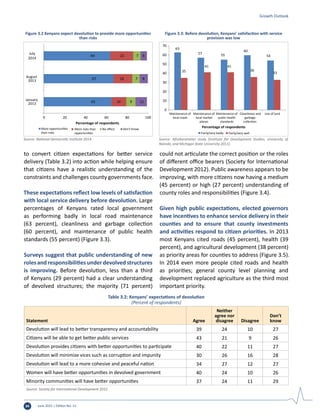
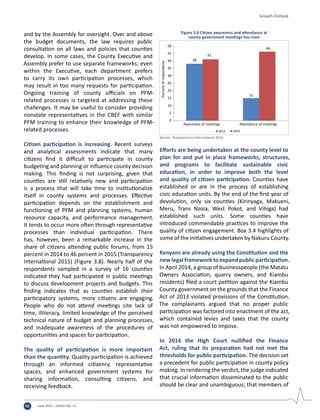
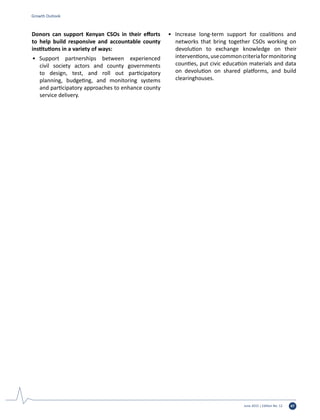
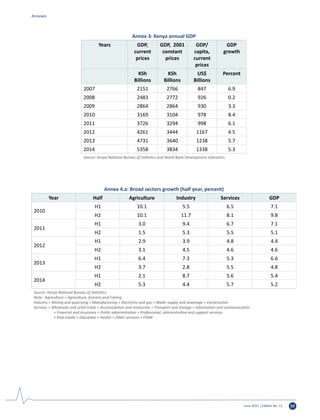
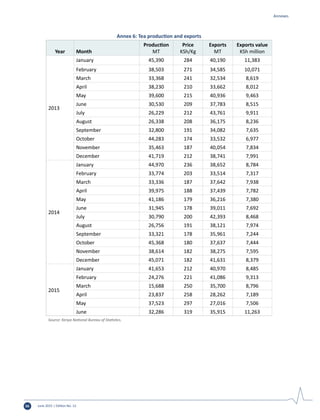
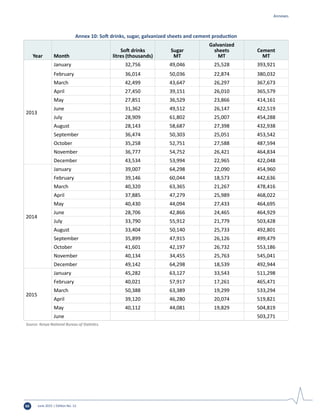
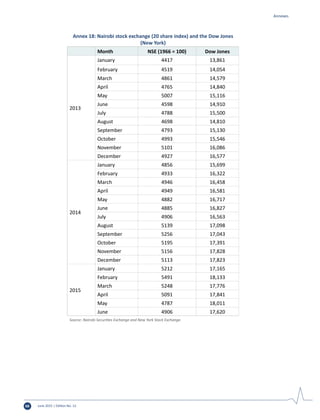
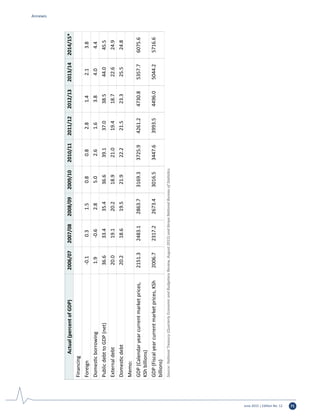
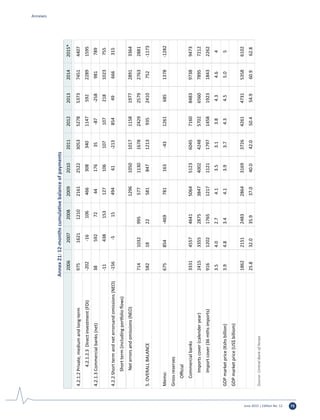
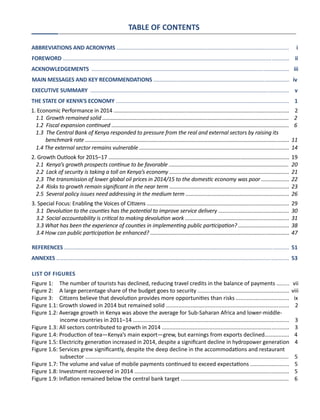
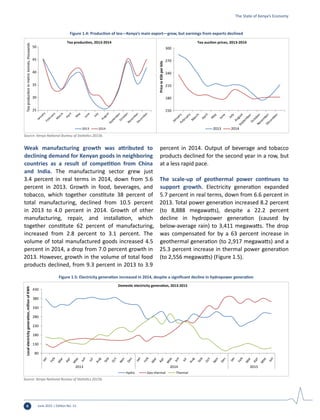
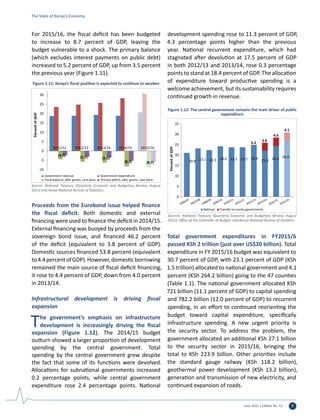
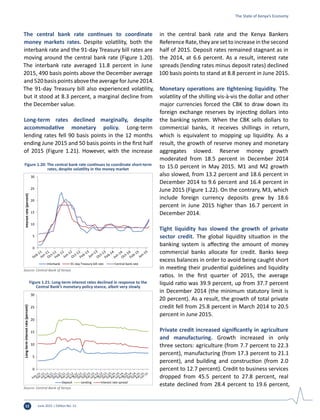
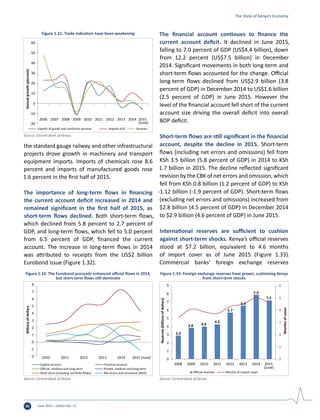
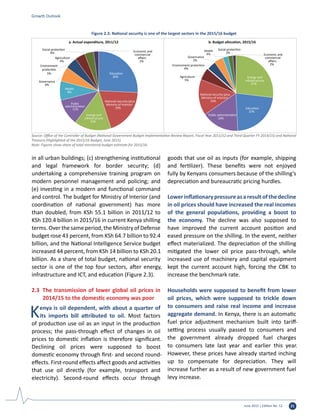
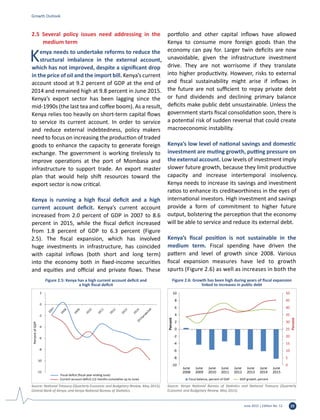
Budget execution improved
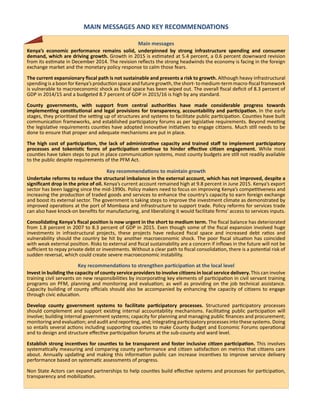
Revenue underperformance in 2014/15 made
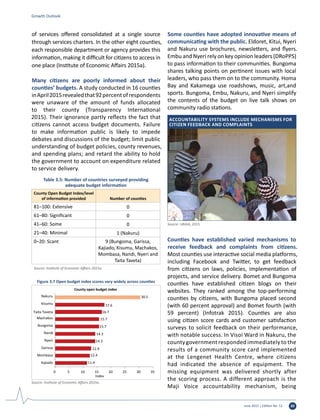
fiscal consolidation a challenge. Total revenue
declined 0.4 percentage points, to 18.9 percent of
GDPin2014/15(Figure1.14).Incometax(including
pay as you earn [PAYE]) and value added tax (VAT)
were the main sources of revenue, accounting
for 49.8 percent and 24.6 percent, respectively.
Income tax remained stagnant at 8.9 percent of
GDP; VAT fell marginally, from 4.6 percent of GDP
in 2013/14 to 4.5 percent in 2014/15. Import
duties and excise duties as a share of GDP stood at
1.3 percent and 2.1 percent.
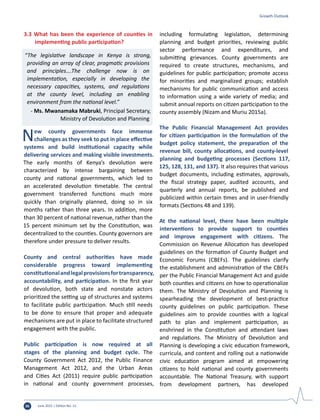
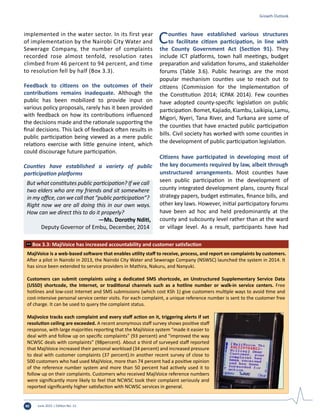
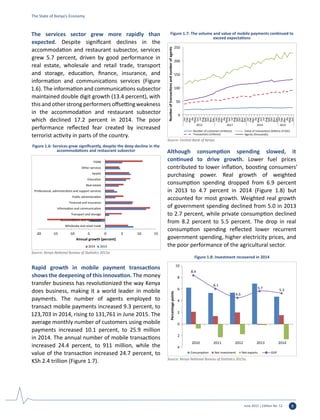
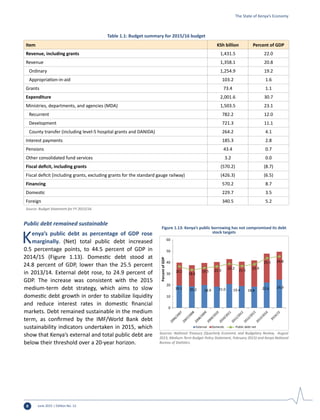
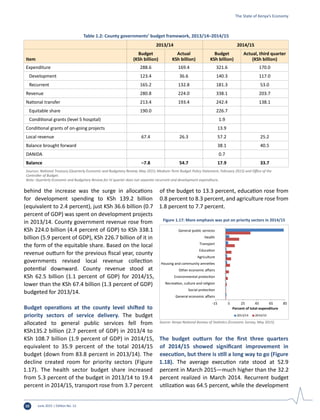
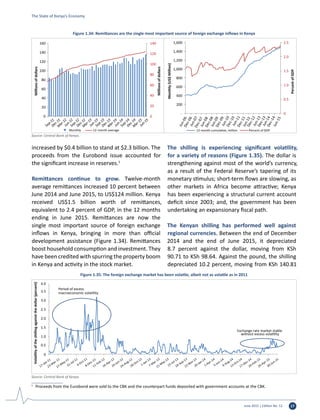
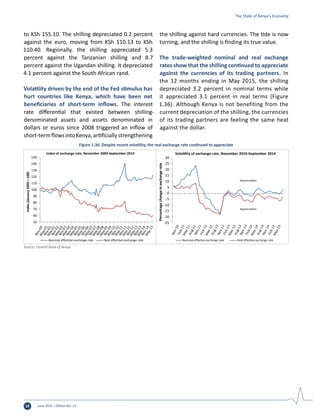
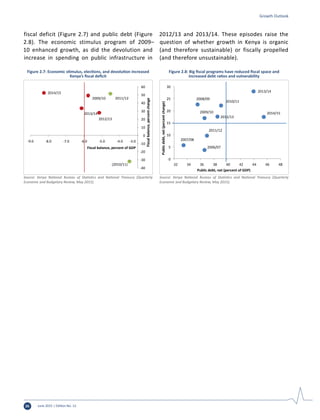
Despite more allocation for infrastructure,
development spending execution remained low.
Budget execution reached 76.1 percent in June 2015,
down significantly from the 85.6 percent executed
during the same period in 2014 (Figure 1.16). This
was due to low spending by energy, infrastructure
and ICT sector at 49.3 percent, yet this sector
accounted for the larger share (30.2 percent)of
the total ministerial budget (Figure 1.15). Lower
execution rates undermines governments goal to
turn ambitious plans into tangible deliverables.
County governments embarked on fiscal expansion
County governments are overcoming some of
the challenges encountered in their first fiscal
year. The 2014/15 budget showed an expansion of
both spending and revenue by county governments.
Counties’ overall fiscal balance remained positive,
helping improve Kenya’s overall fiscal position. Low
budget execution of development expenditure at
the county level undermines ambitious efforts to
deliver promises.
County governments’ budgets rose significantly in
2014/15.Countybudgets was estimated at KSh 320.7
billion (5.6 percent of GDP) in 2014/15 from the
executed spending of KSh 169.4 billion (3.6 percent
of GDP) in 2013/14 (Table 1.2). The driving forces
6.9 7.8 8.3 8.9 8.9
4.8
4.4 4.1
4.6 4.5
1.4 1.3 1.3
1.3 1.32.6 2.0 1.9
2.0 2.0
1.6 1.6 1.7
1.3 1.2
0
2
4
6
8
10
12
14
16
18
20
2006/07-
2010/11
2011/12 2012/13 2013/14 2014/15
PercentofGDP
Income tax VAT Import Duty Excise Duty Other Revenues
Figure 1.14: Revenues declined in 2014/15
Sources: National Treasury (Quarterly Economic and Budgetary Review, August
2015) and Kenya National Bureau of Statistics.
0 100 200 300 400
General economic and commercial affairs
Social protection, culture and recreation
Health
Environment protection, water
and natural resources
Agriculture, rural and urban development
National security
Governance, justice, law and order
Public administration and
international relations
Education
Energy infrastructure and ICT
Billion, KSh
Ministerial expenditure for FY 2014/15
Target Actual
Figure 1.15: Infrastructure sector accounted for a larger share of the
budget, but executed almost a half
Sources: National Treasury (Quarterly Economic and Budgetary Review,
August 2015).
58.1
76.2
79.6
84.7
86.7
87.9
91.1
93.4
95.7
99.9
0 20 40 60 80 100
Percent
Overall ministerial budget implementation for FY 2014/15
Energy infrastructure and ICT
Governance, justice, law and order
Health
Public administration and international relations
Agriculture, rural and urban development
Social protection, culture and recreation
Environment protection, water and natural resources
Education
General economic and commercial affairs
National security
Figure 1.16: Overall implementation was pulled back by energy sector
Sources: National Treasury (Quarterly Economic and Budgetary Review,
August 2015).
The State of Kenya’s Economy](https://image.slidesharecdn.com/e4aa42d5-f98a-4566-9e4e-879be989e990-160112110438/85/Kenya0economic0public0participation-27-320.jpg)

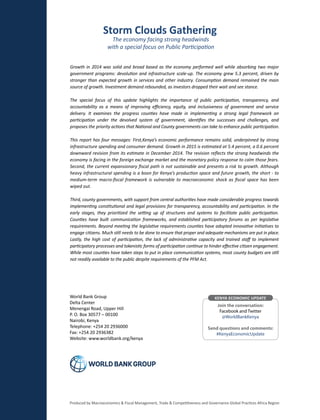
![June 2015 | Edition No. 12 33
for bribes as major barriers to breaking into the
job market. Young people indicate that demands
for bribes to get jobs are common and that the
more competitive the vacancy, the larger the bribe
demanded. Inactive youth are at higher risk of being
recruited into criminal activity. Estimates suggest
that if firms used all the money they paid in bribes
to hire employees, they would be able to create
250,000 positions (World Bank 2012).
Citizen engagement is critical for promoting social
cohesion, reducing resource-based and ethnic
conflict, and building stronger citizen-state relations
The constitutional emphasis on participation
and inclusion of marginalized communities and
vulnerable groups is in part a response to Kenya’s
historical experience with political instability,
which has hurt economic performance and social
cohesion. Kenya witnessed a political crisis in 2008,
when violence erupted following the disputed
national elections held in December 2007. Among
the most salient explanatory factors for continued
cycles of violence around election time in Kenya
are income inequality, feelings of exclusion, and
regional inequities (Kenya’s Gini index of 42.5 in
2008 was higher than in neighboring countries
such as Uganda [37] and Tanzania [38]). A judicial
commission of inquiry established that many of the
youths involved in the 2007 post-election violence
were unemployed. Another dimension of inequality
that can help explain violence in Kenya is horizontal
inequality (inequality among culturally defined
or constructed groups). This form of inequality is
multidimensional and includes political, social, and
economic dimensions. Since independence, Kenya
has had significant levels of horizontal inequality,
with the ethnic group in power benefitting politically,
economically, and socially. Over the years, horizontal
inequality has contributed to ethnic cleavages and
conflict. Other related dynamics are the distribution
of land and the political manipulation of ethnic
identities and enmity over the imbalances of
resources and services (World Bank 2008).
Social accountability mechanisms that enlist
the public in setting development priorities and
monitoring the flow and use of financial resources
can reduce social and economic tensions. County
governors are likely to face significant pressures
fromvested interests to reward constituencies that
supported their candidacies; the long tradition of
patronage in Kenya may not be easy to reverse. The
47 counties largely follow geographic boundaries
that were drawn shortly after independence,
partly based on where different ethnic groups
resided. Citizens in Kenya have tended to align
themselves with political parties and coalitions
largely along ethnic lines. At least initially, the
formation of counties with elected governors and
assemblies has contributed to multiple governors
operating as a bloc on some issues rather than
along national party lines.
The accountability relationships established among
the central government, county governments,
and citizens will be a key determinant of how
well services are delivered under devolved
government. Inclusion of the marginalized and the
poor in decision making at the local level is likely
to lead to pro-poor policies. Incentives to improve
development outcomes will be determined by the
strength of the accountability mechanisms put in
place to override traditional historical incentives.
The extent to which some governors outperform
others and performance systems are put in place
for citizens to distinguish and provide feedback on
relative performance between elections will also be
a key determining factor.
Citizen engagement can help manage and meet
high public expectations that devolution will
improve service delivery
Kenyans remain optimistic that devolution will
create more opportunities than risks (Figure
3.2). A significant percentage of citizens expect
that devolution will improve service delivery and
enhance their participation. A challenge will be
Growth Outlook](https://image.slidesharecdn.com/e4aa42d5-f98a-4566-9e4e-879be989e990-160112110438/85/Kenya0economic0public0participation-51-320.jpg)