Download as PDF, PPTX
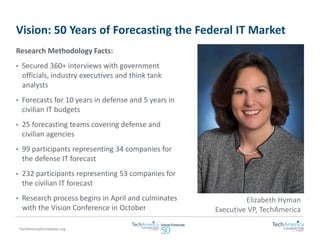
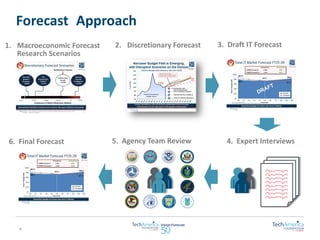
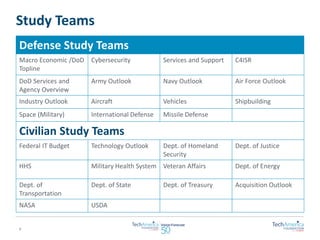

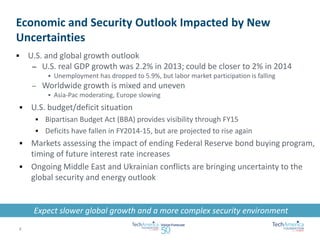
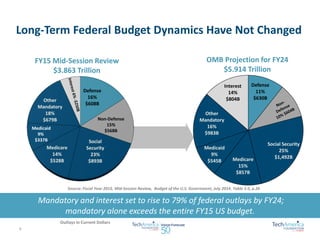
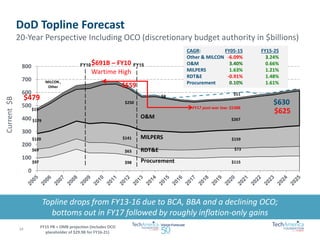
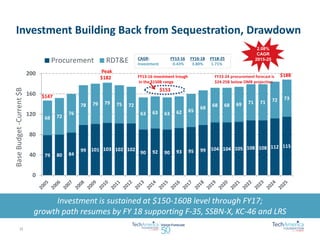
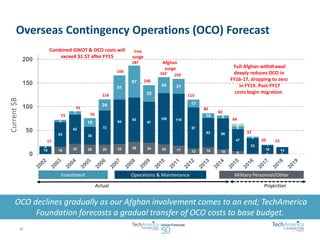


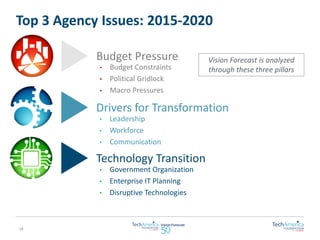
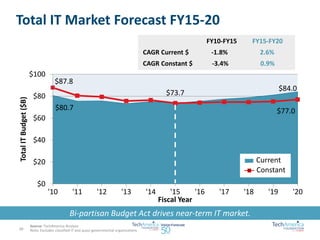
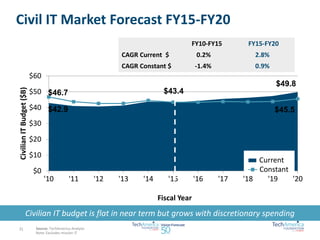
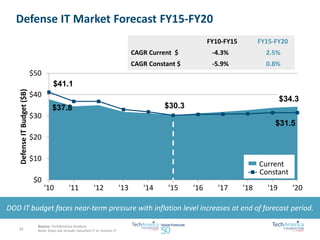

The document provides an overview of the TechAmerica Foundation's Vision Federal Market Forecast. It summarizes the research methodology, which included over 360 interviews and forecasts from 25 teams covering 10 years for defense and 5 years for civilian IT budgets. The macroeconomic and defense forecast anticipates modest growth in the DoD topline and notes potential disruptors. The federal IT forecast projects total IT spending to grow at a 2.6% CAGR from FY2015-2020. The civilian forecast anticipates 2.8% growth while the defense forecast shows 2.5% growth over the same period. Key challenges identified include ongoing budget pressure and the need for cost savings and transformation amid technology transitions.


