This document summarizes presentations from the 2007 Transcatheter Cardiovascular Therapeutics conference. Key findings include:
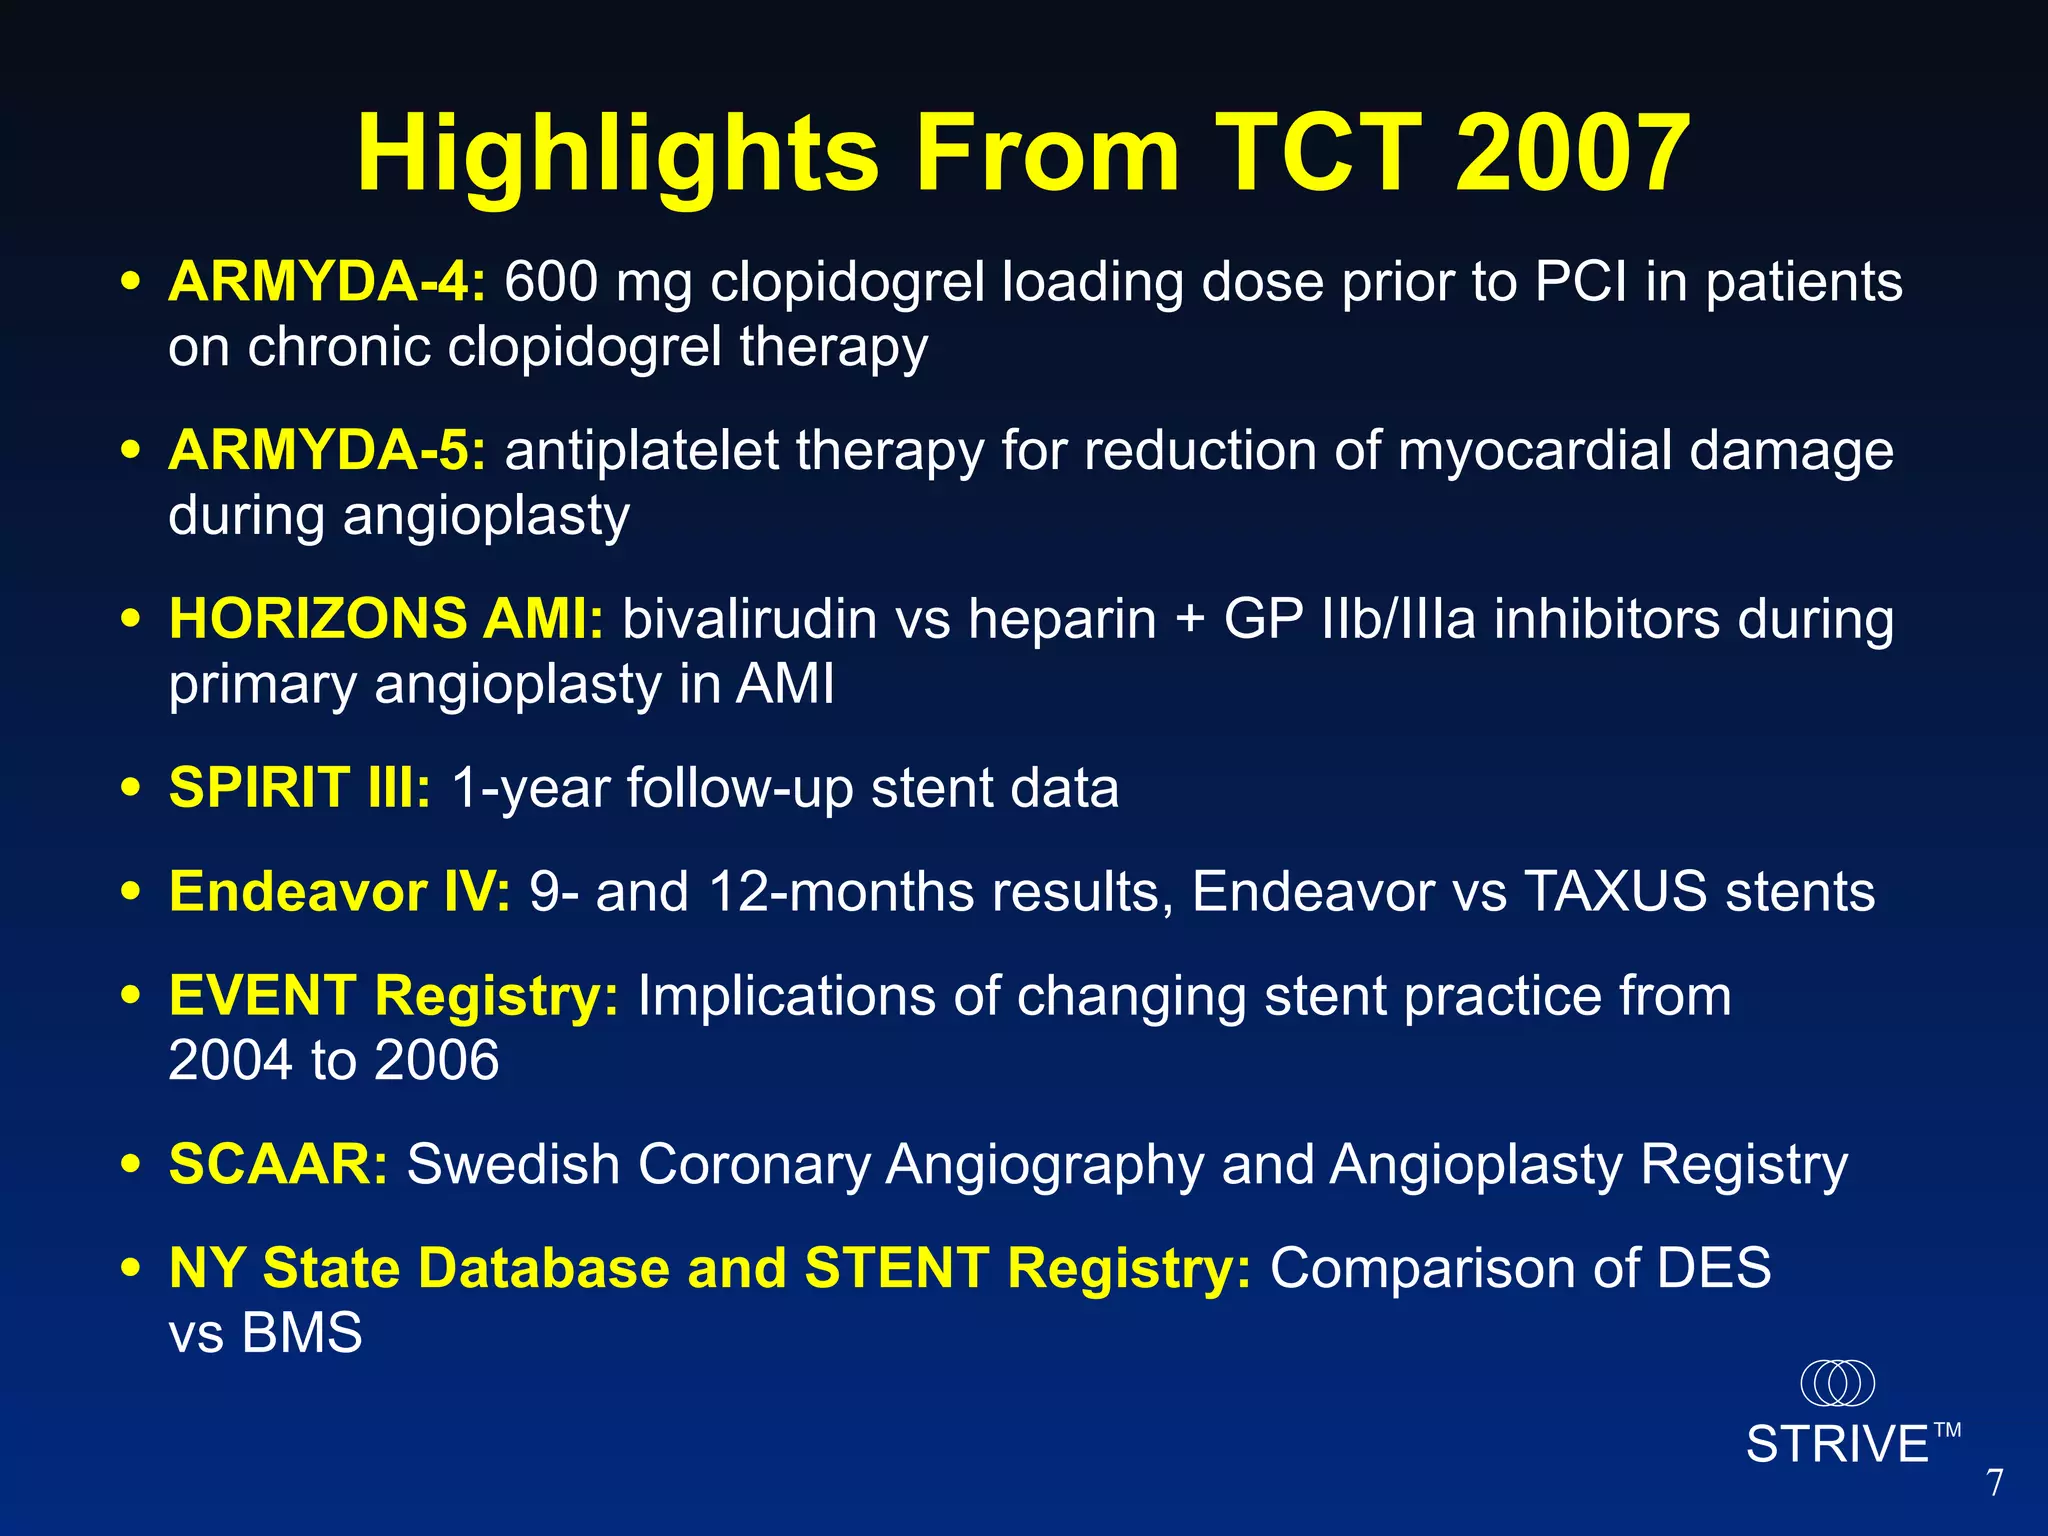
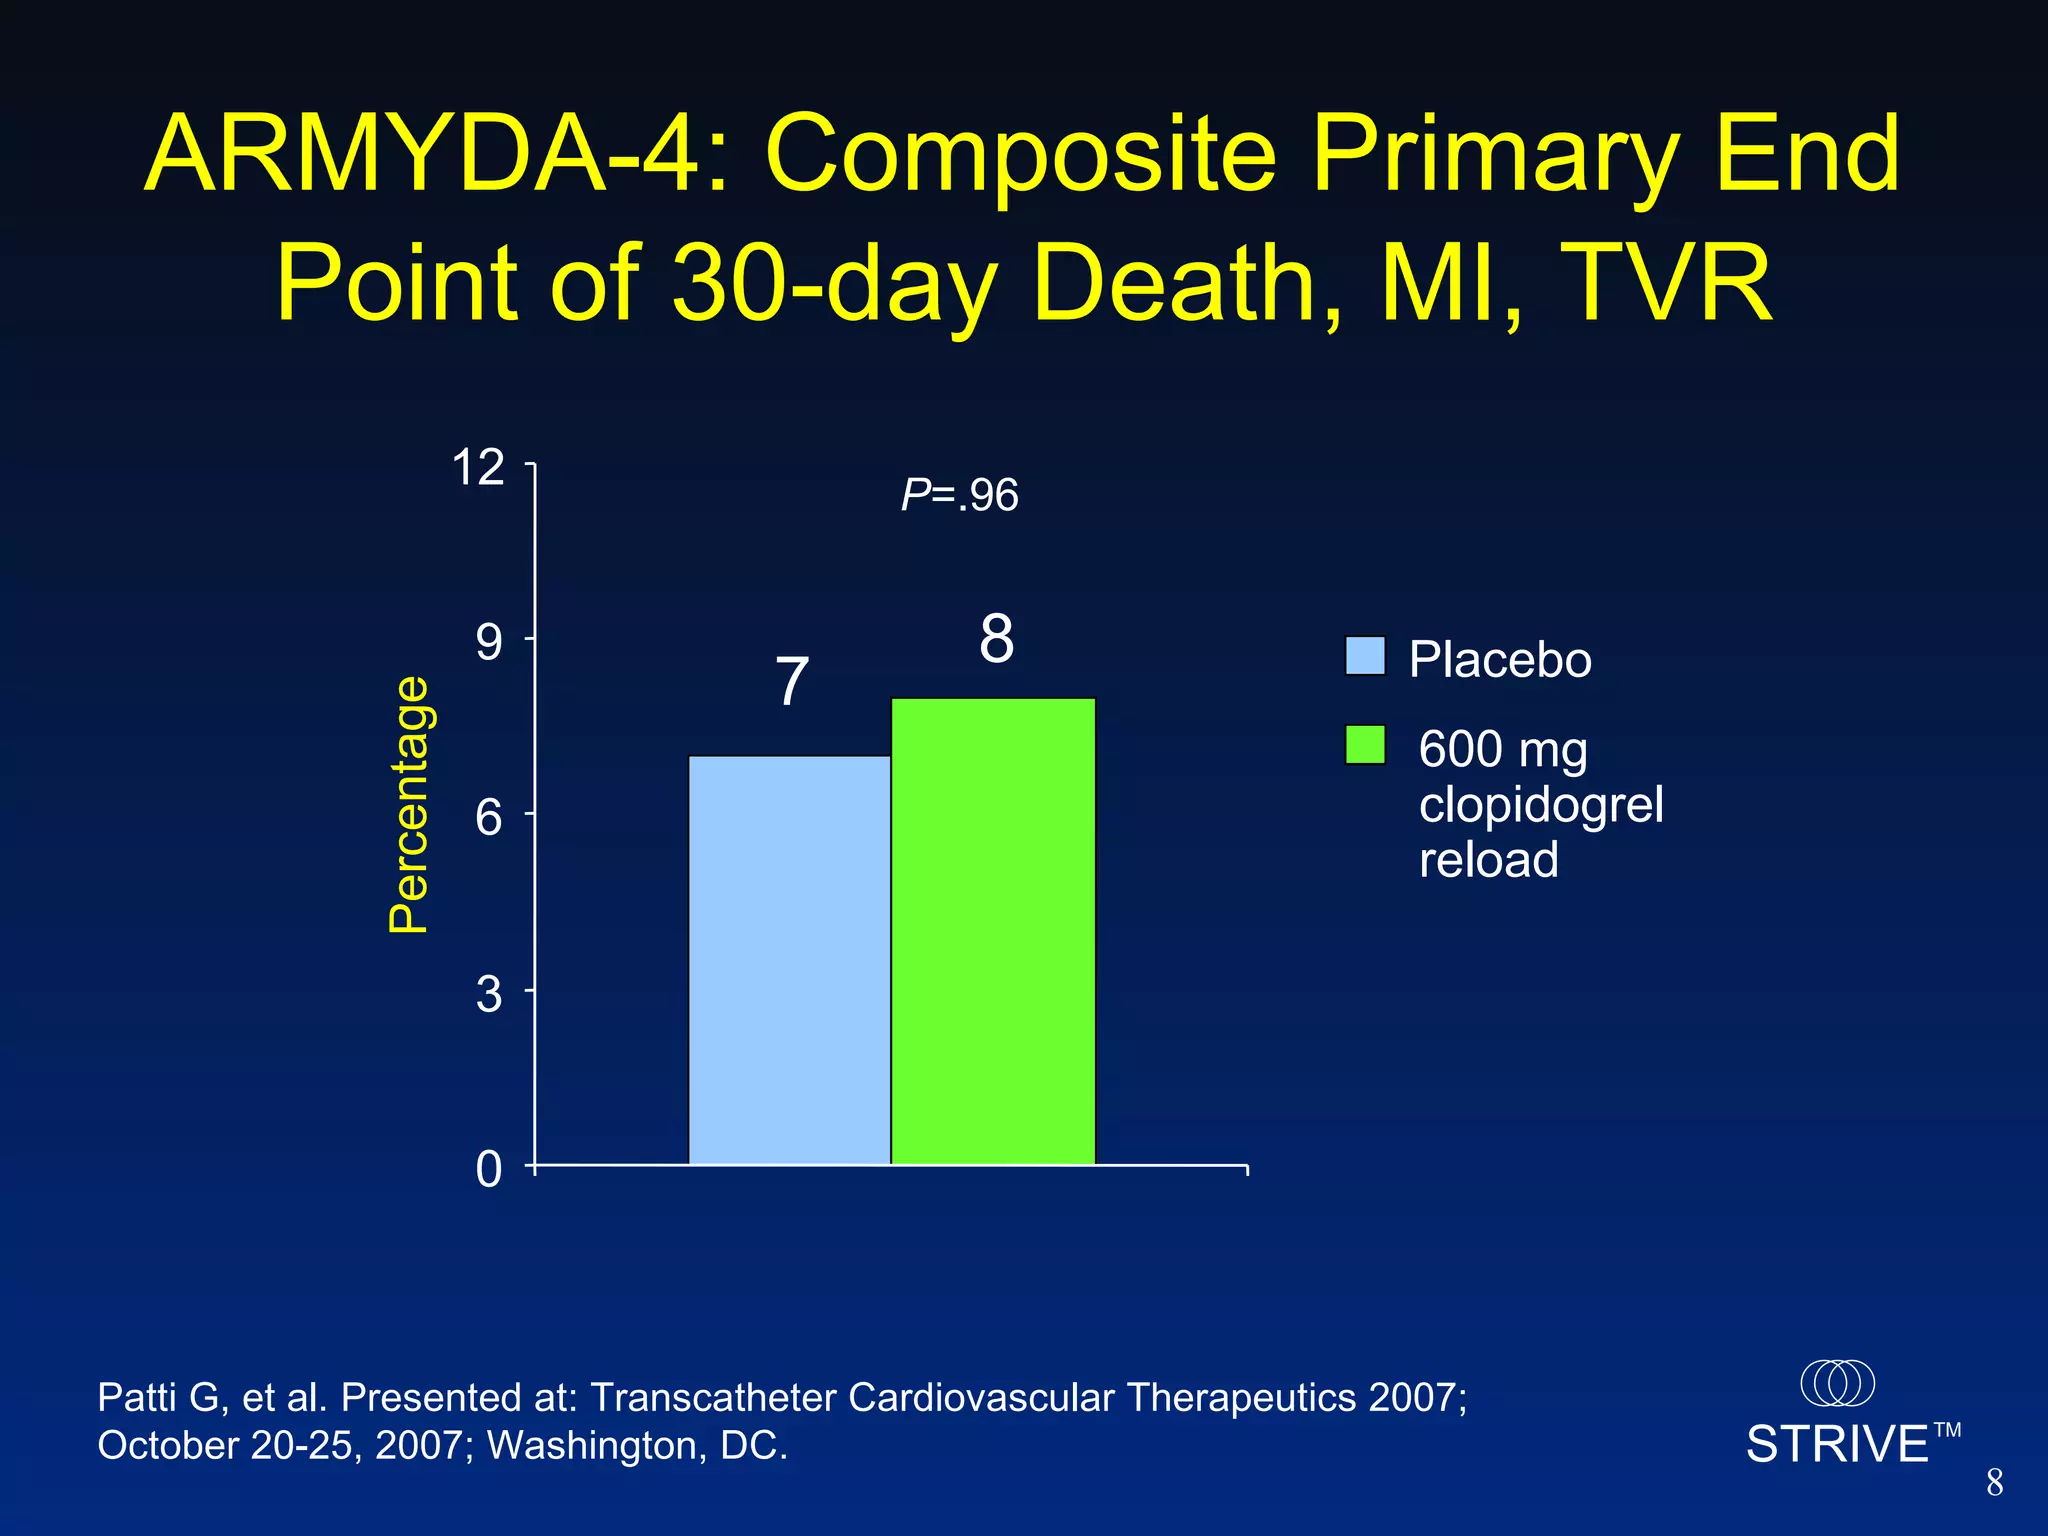
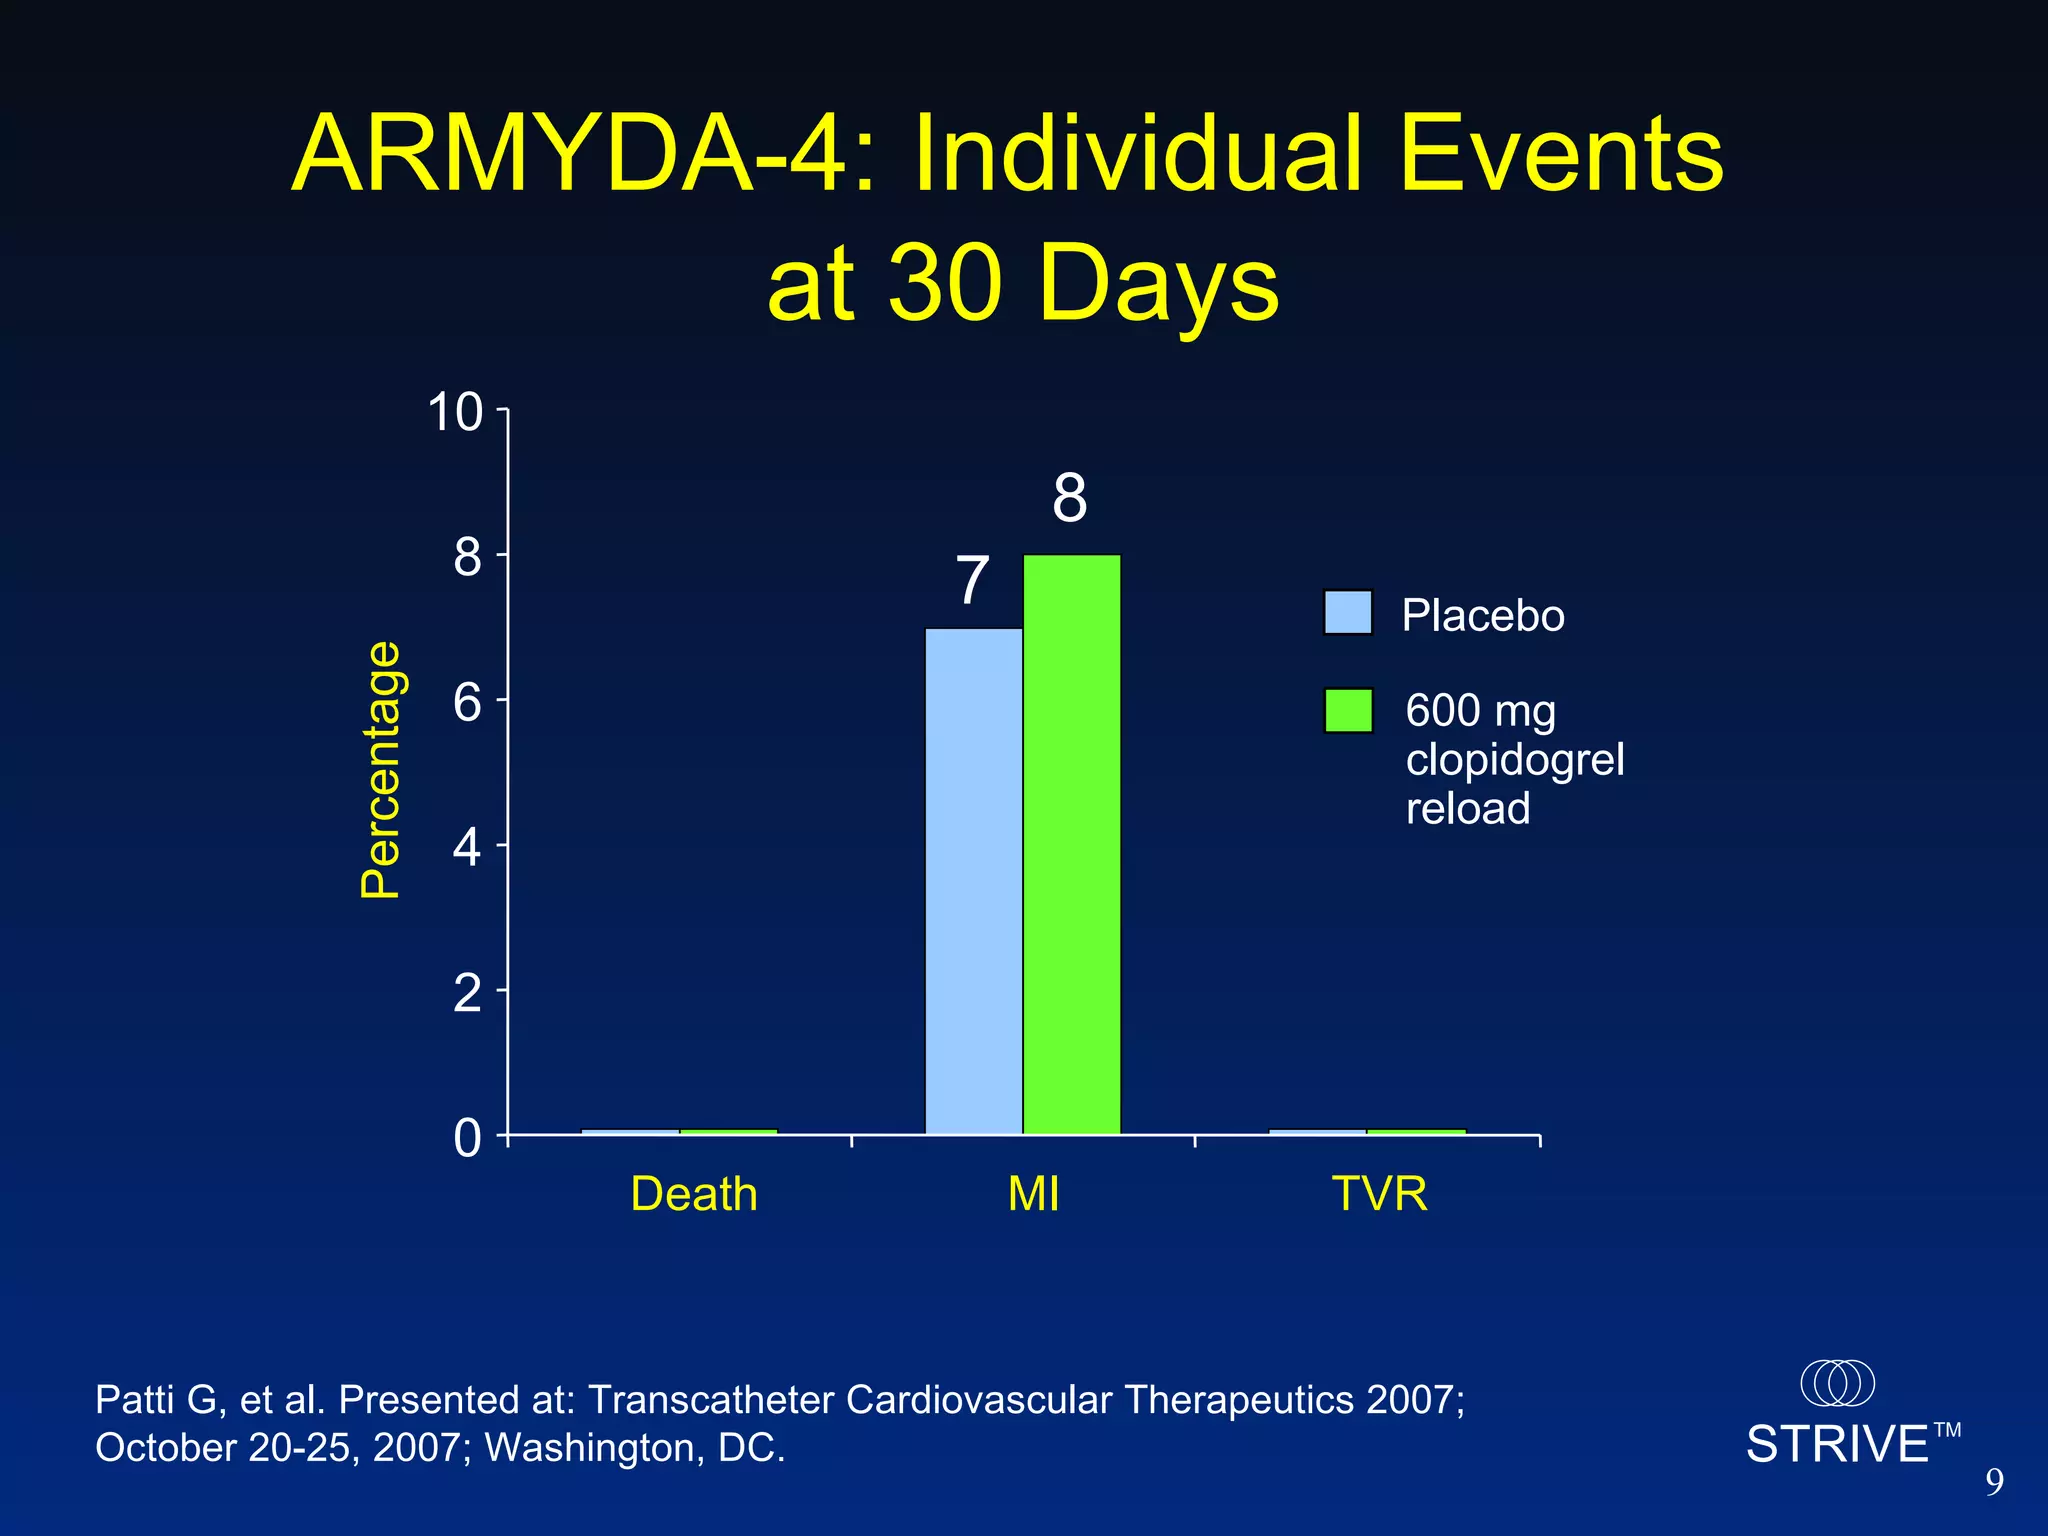
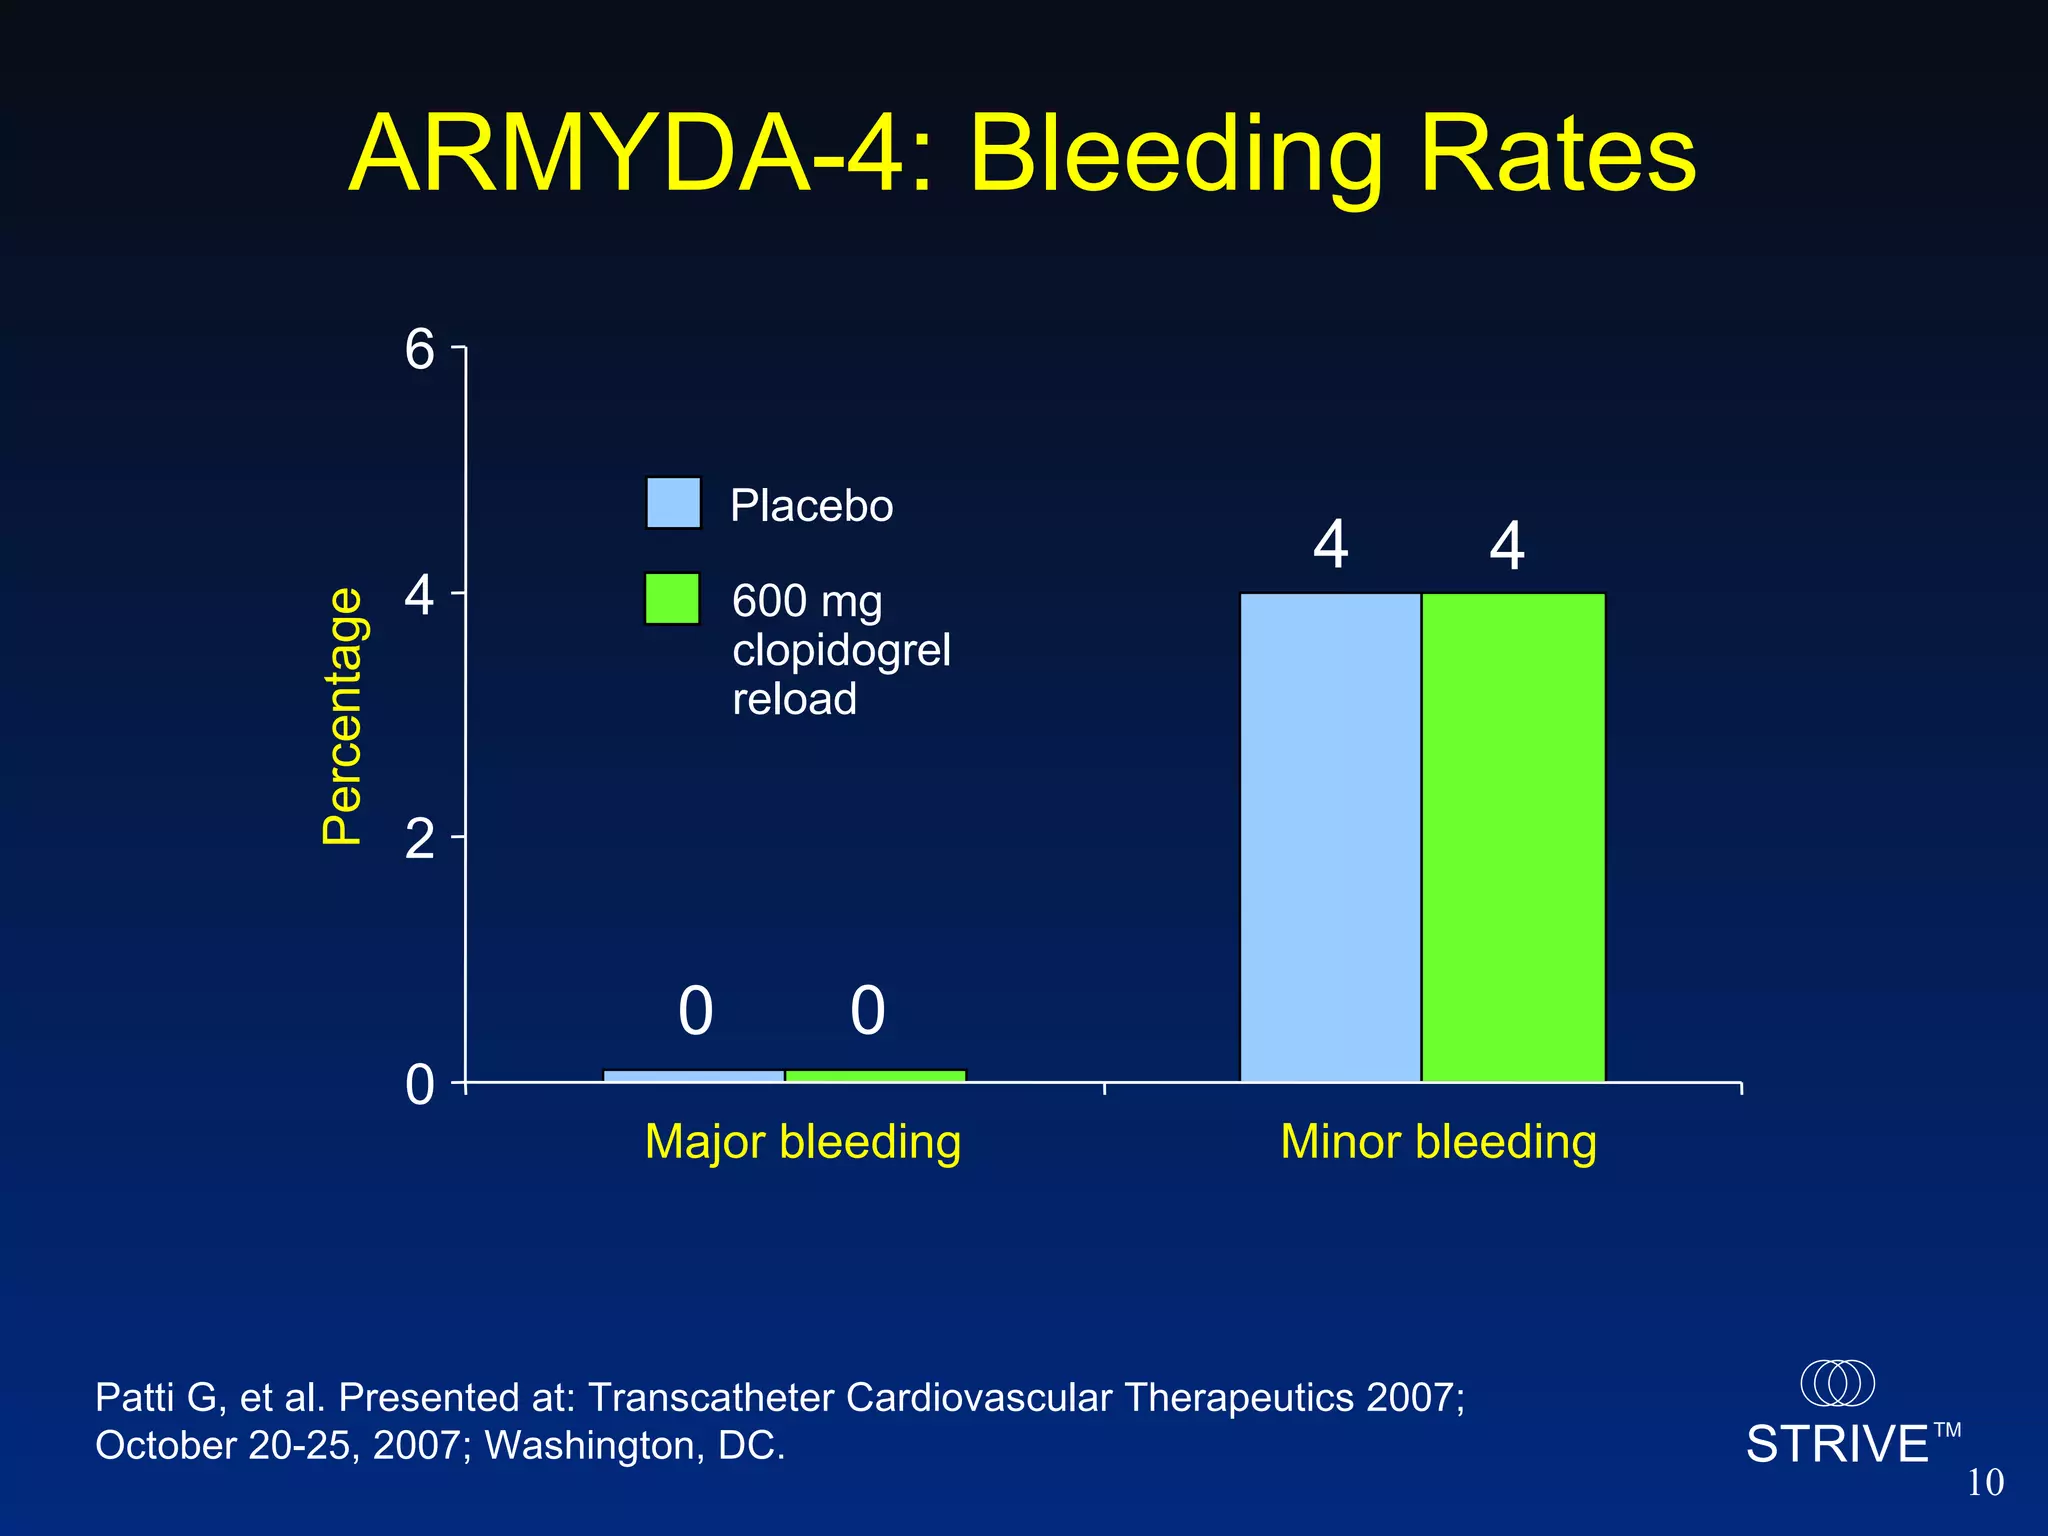
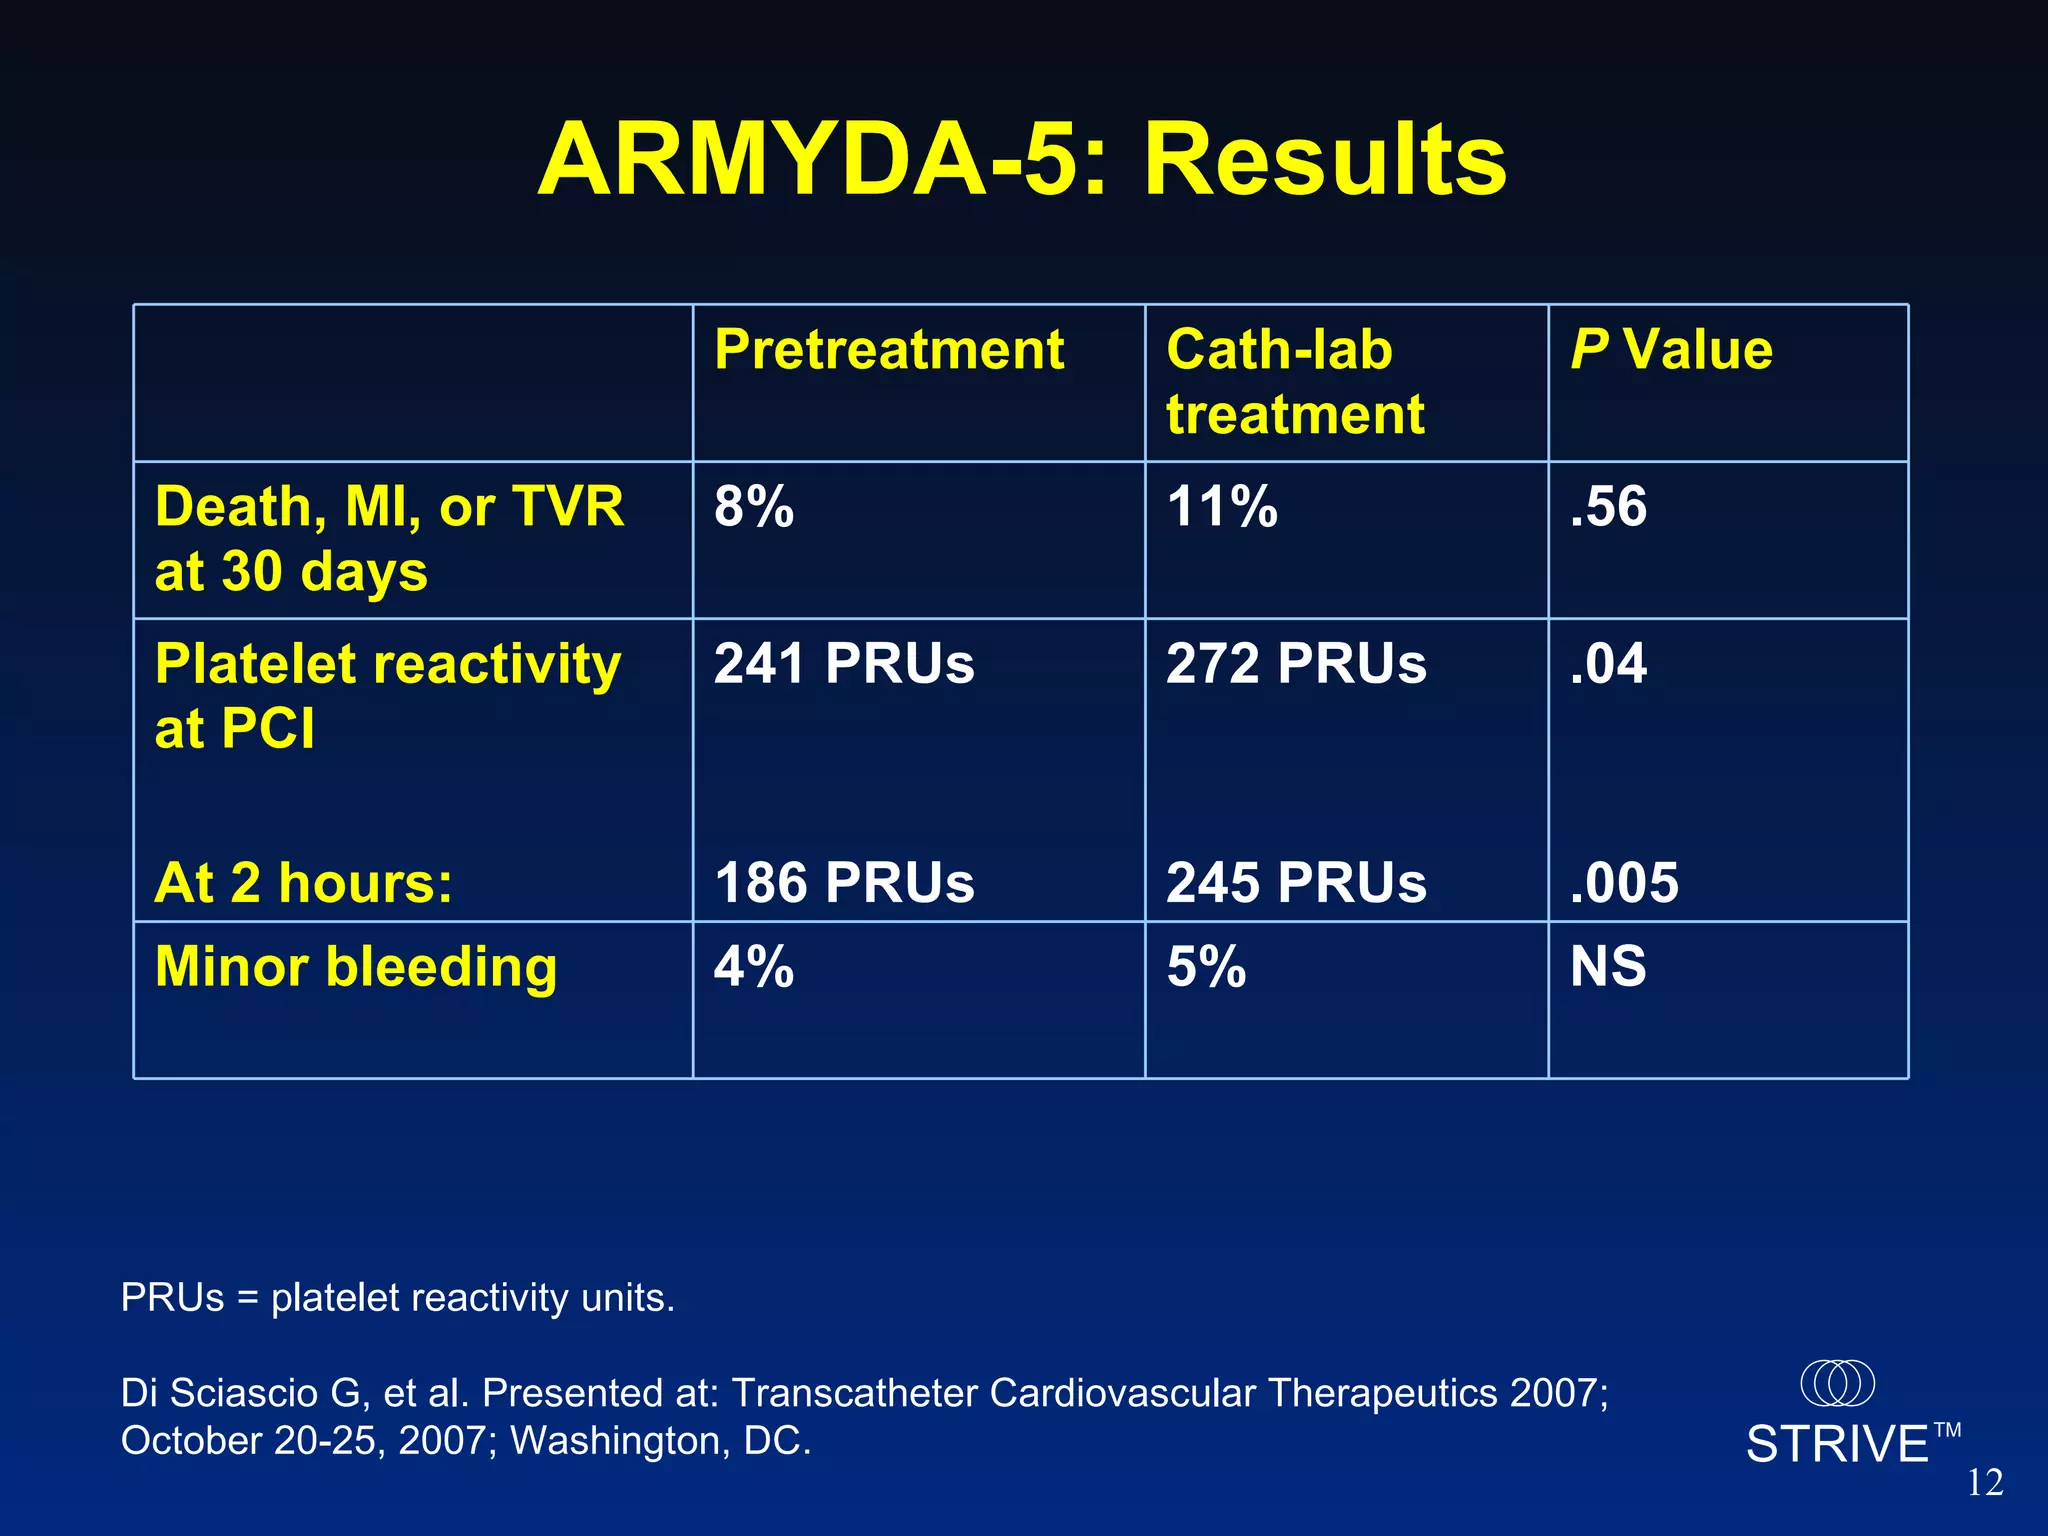
- The ARMYDA-4 trial found that a 600mg clopidogrel loading dose prior to PCI in patients on chronic clopidogrel therapy reduced the risk of death, MI, or TVR at 30 days compared to placebo.
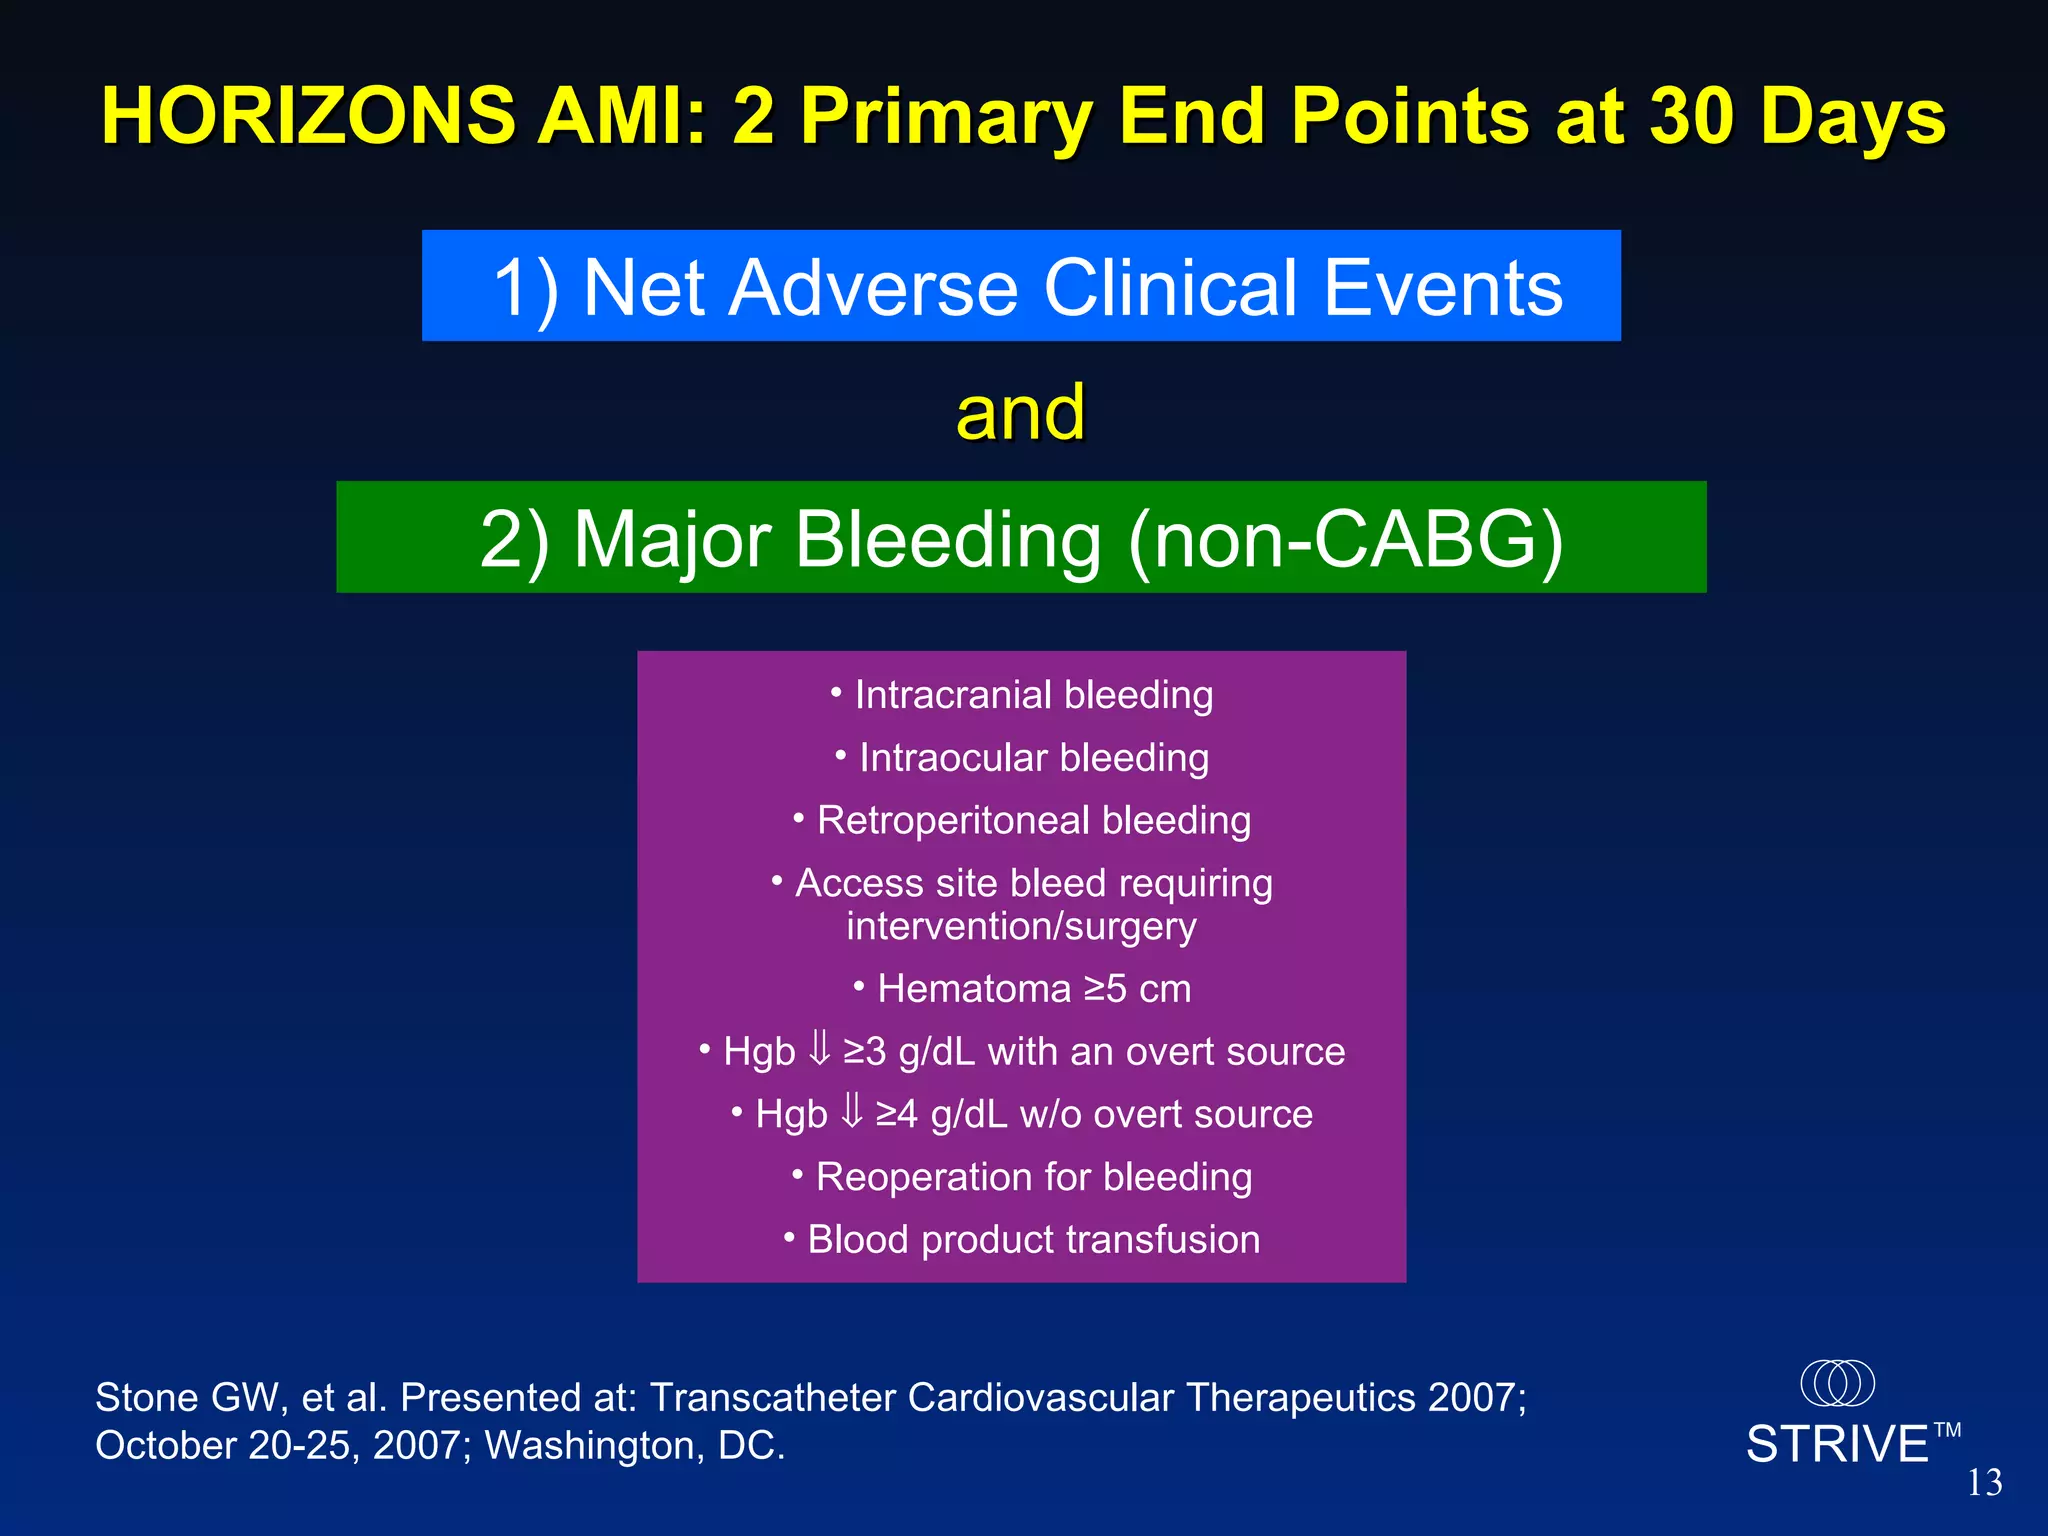
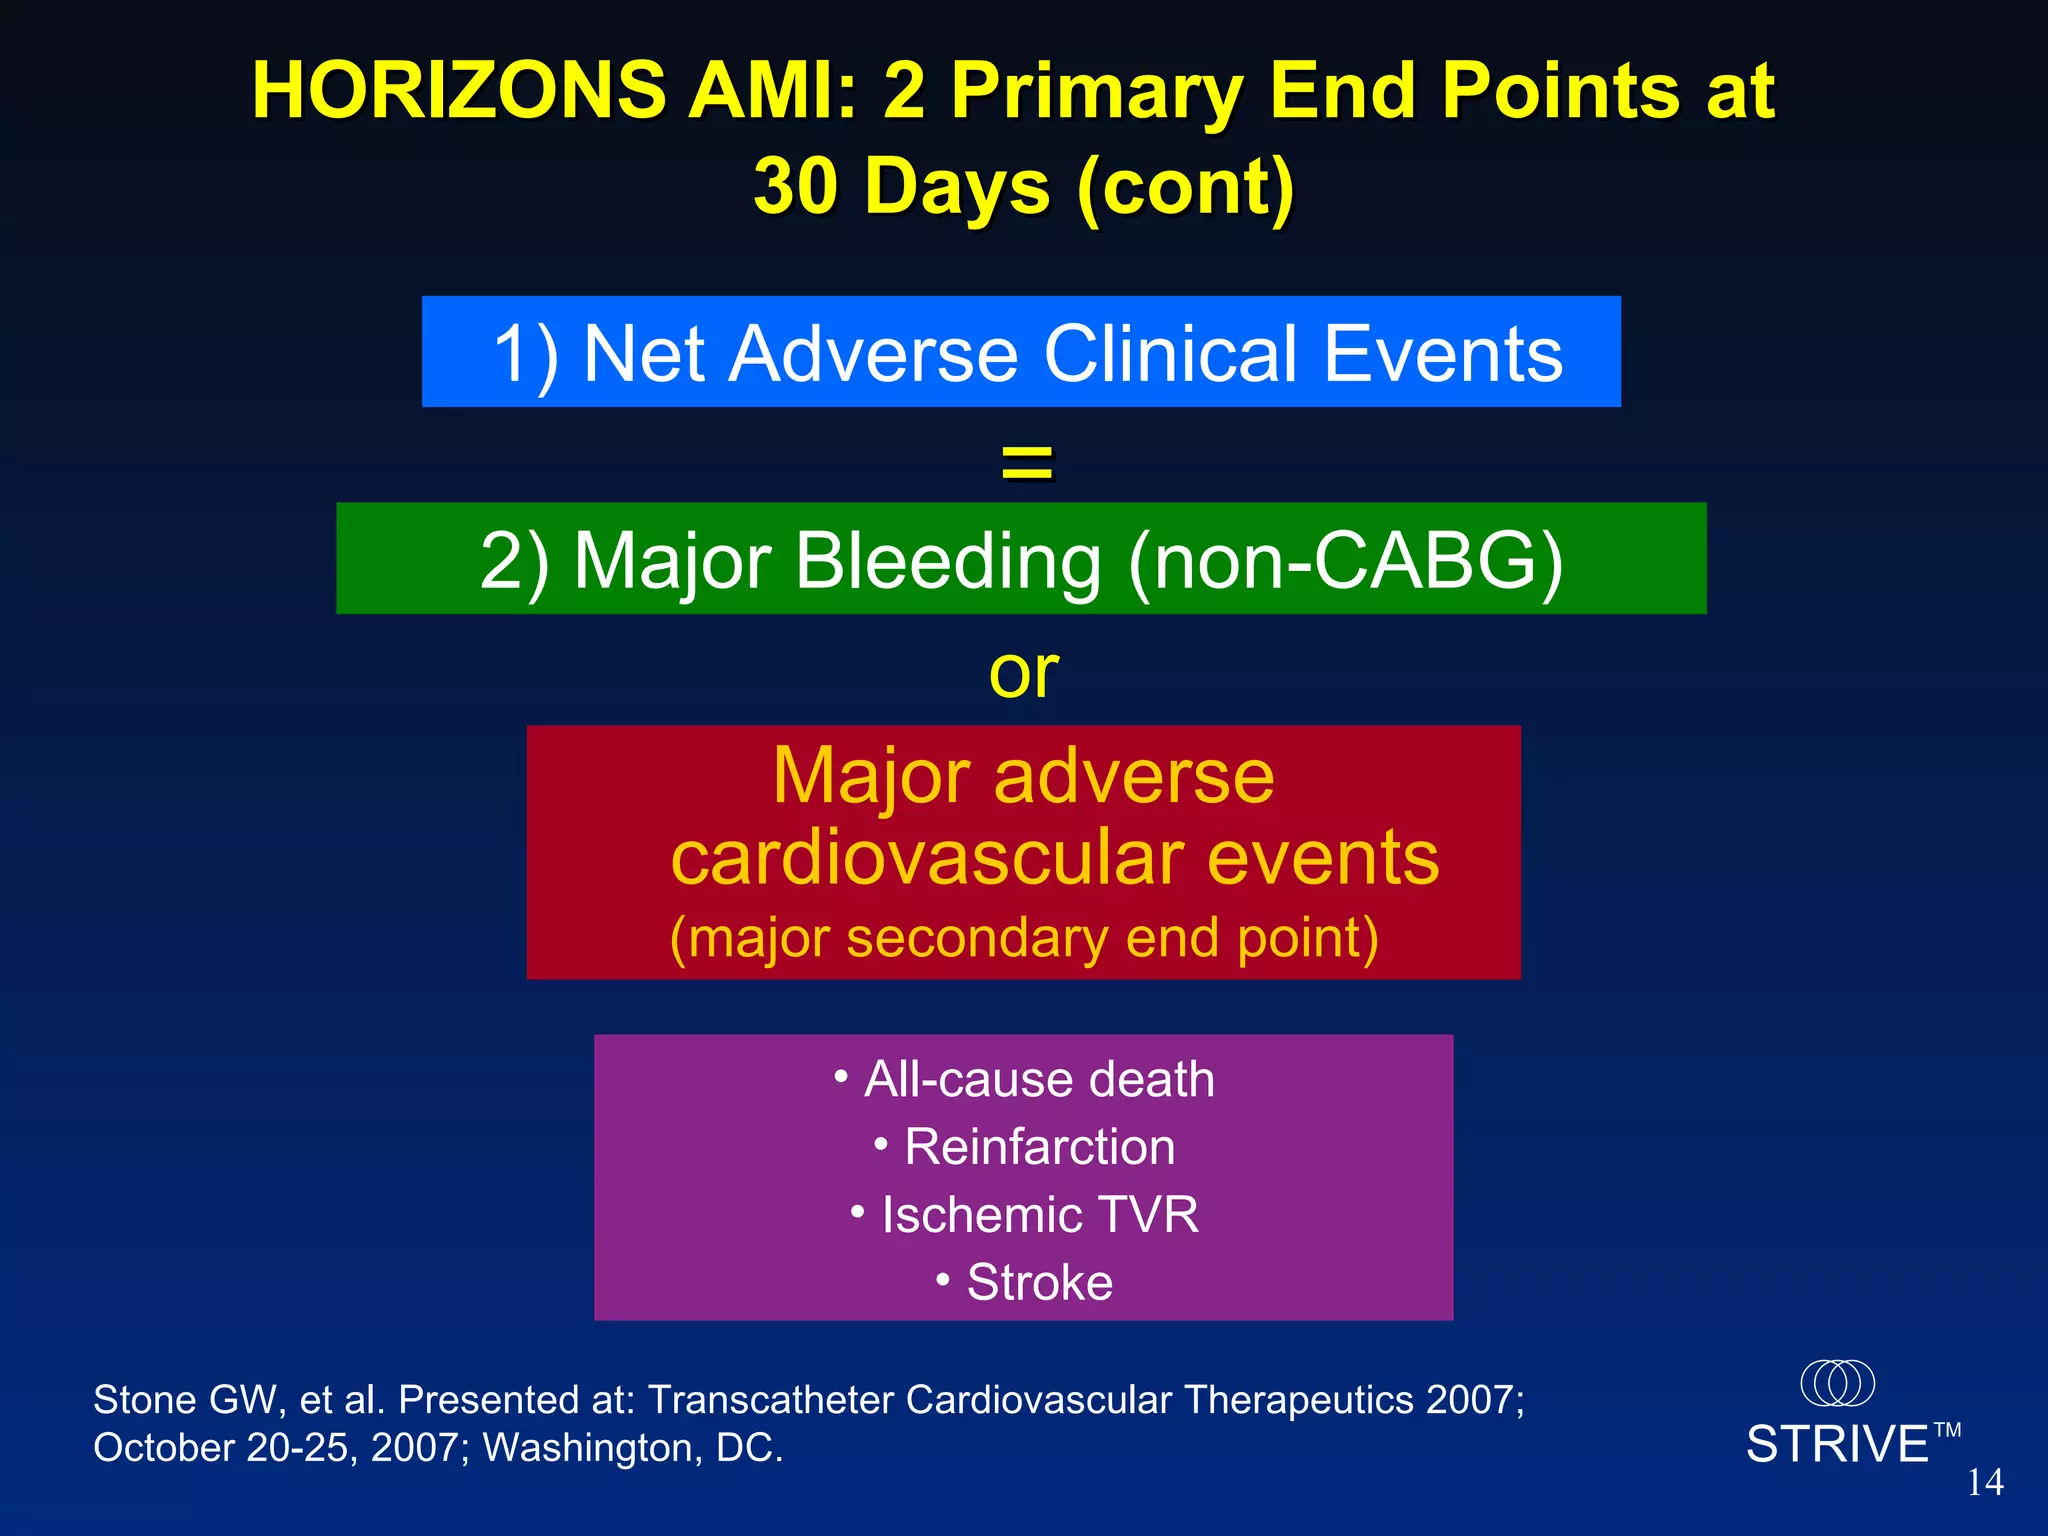
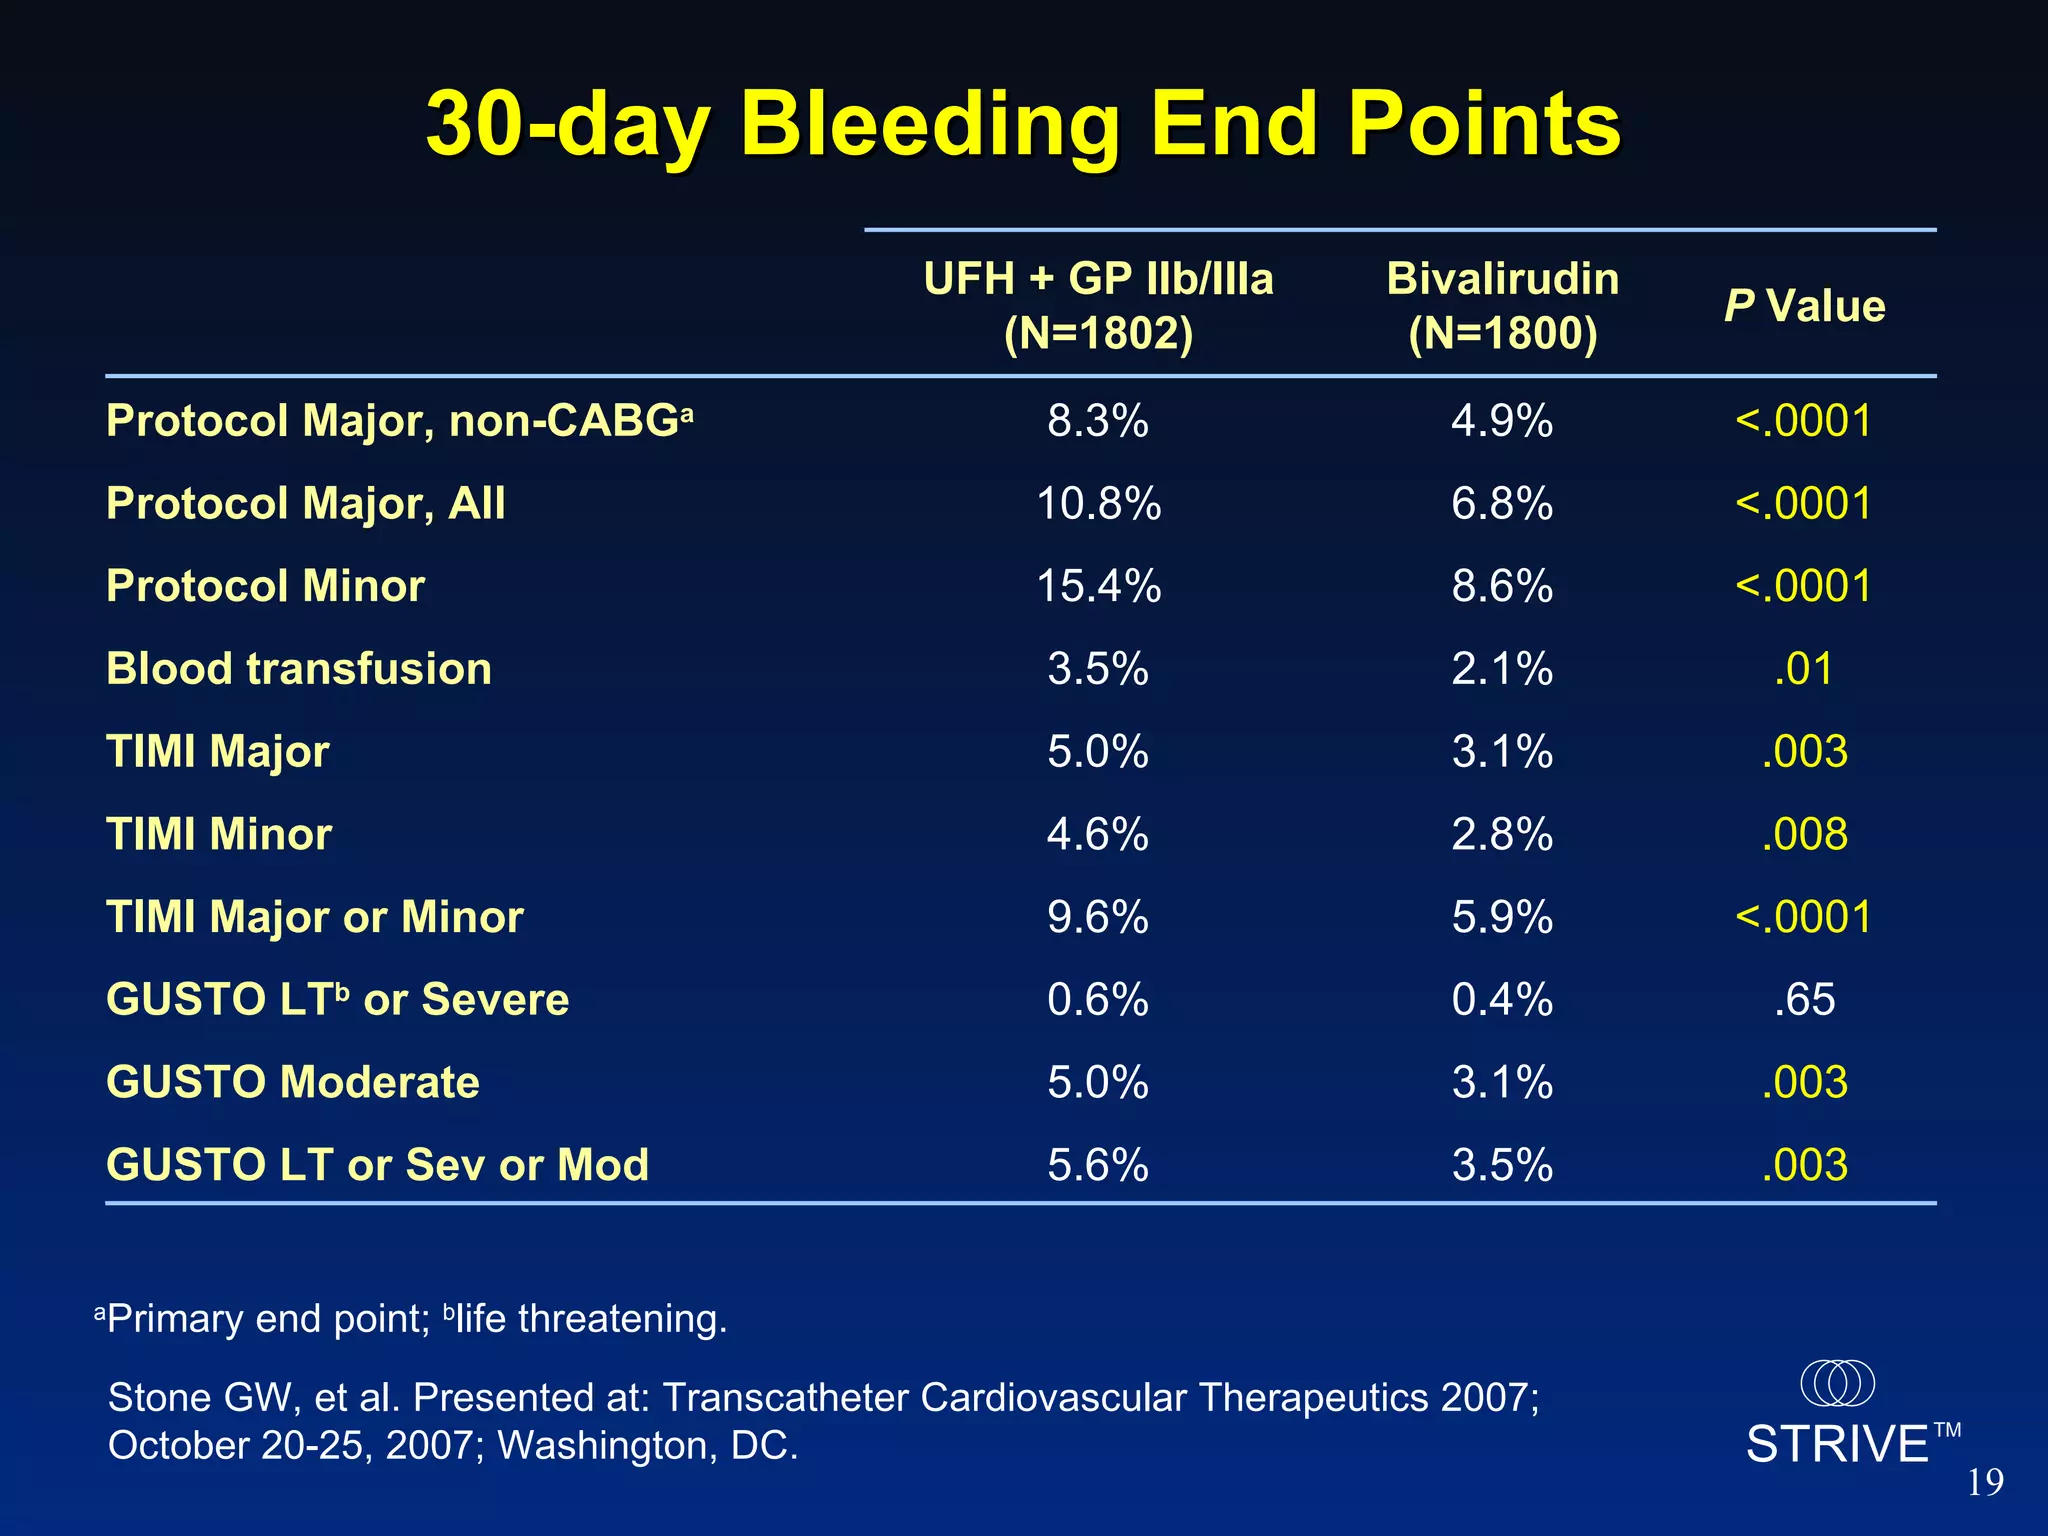
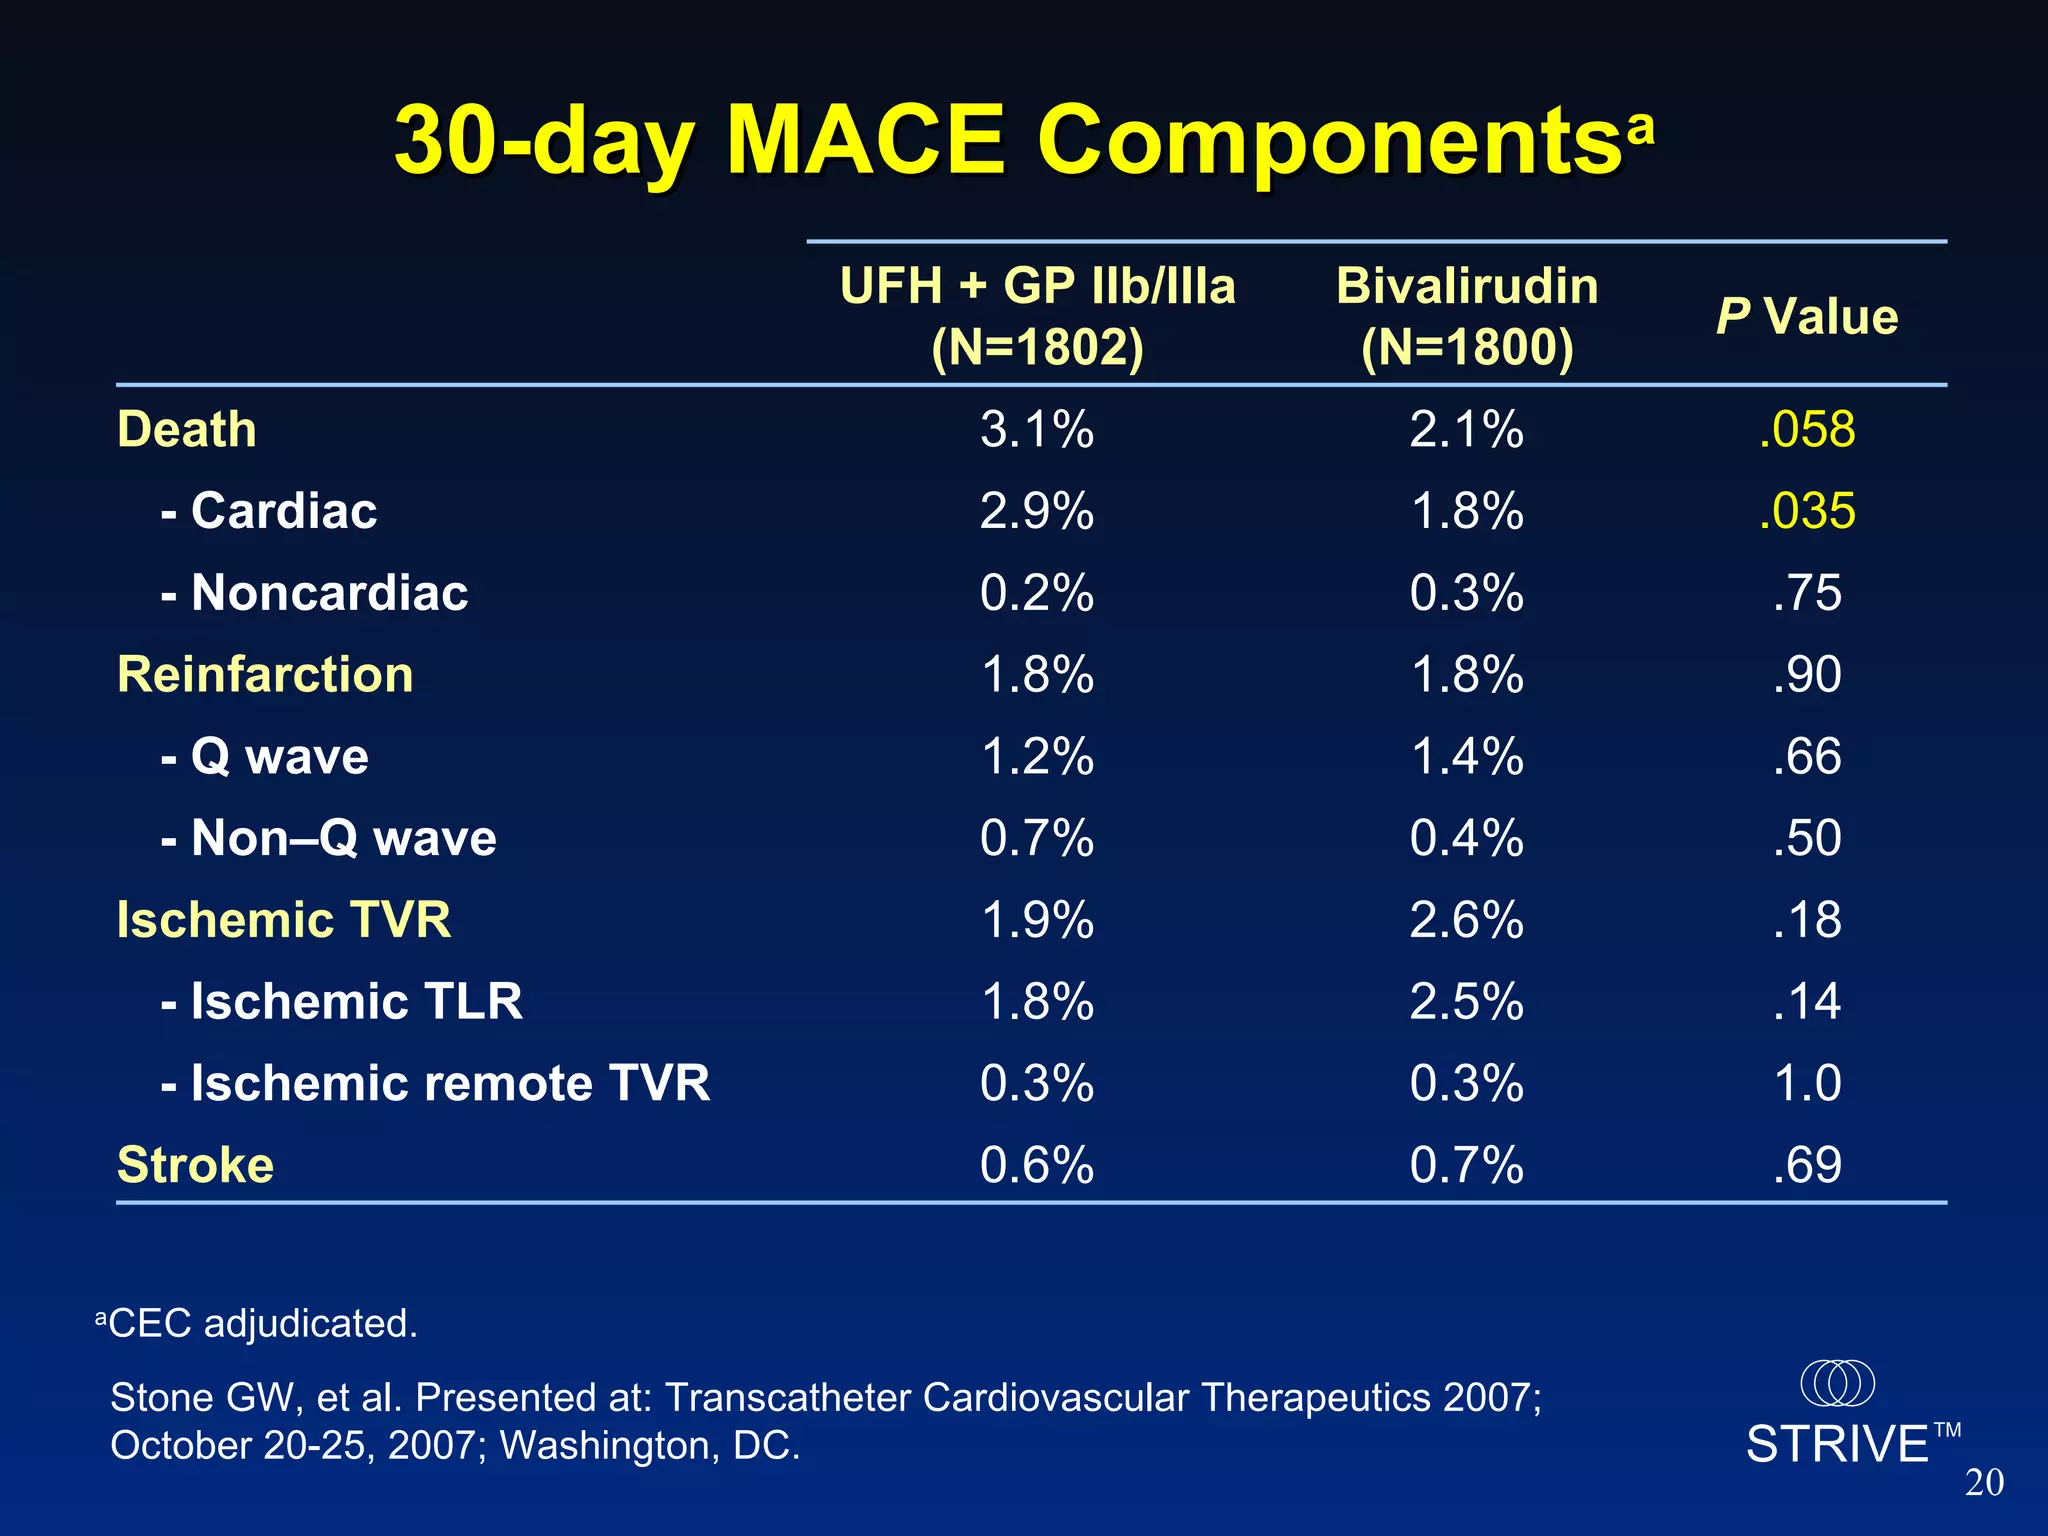
- The HORIZONS AMI trial found that using bivalirudin monotherapy during PCI for AMI reduced major bleeding at 30 days compared to unfractionated heparin plus a GP IIb/IIIa inhibitor, with similar rates of net adverse clinical events.
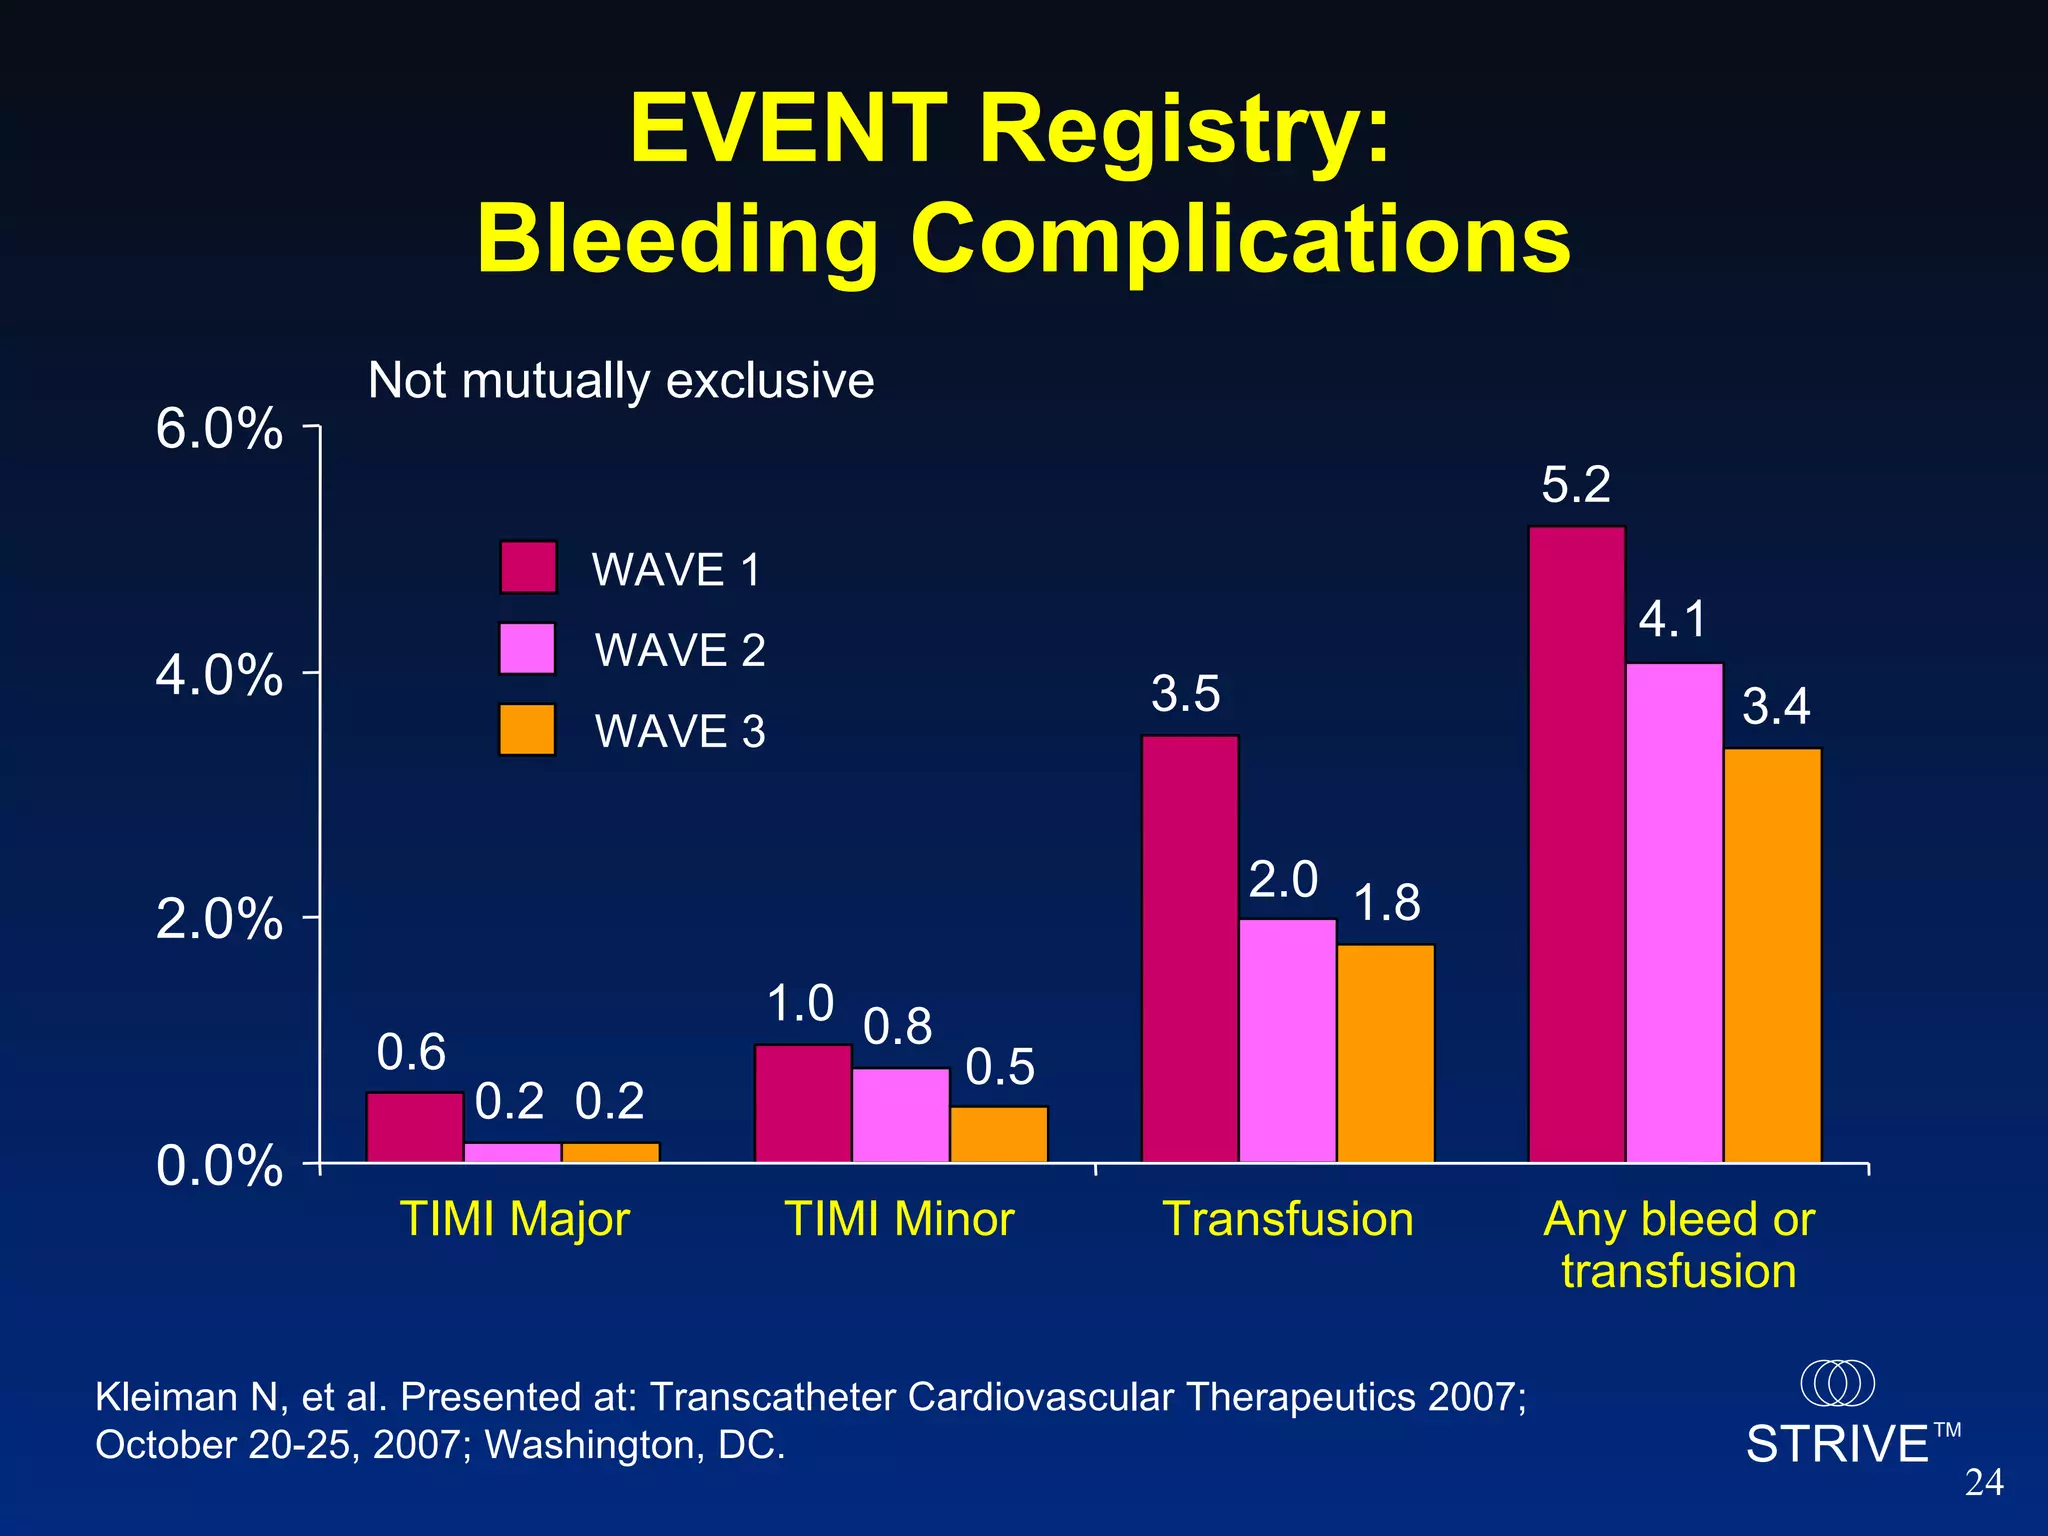
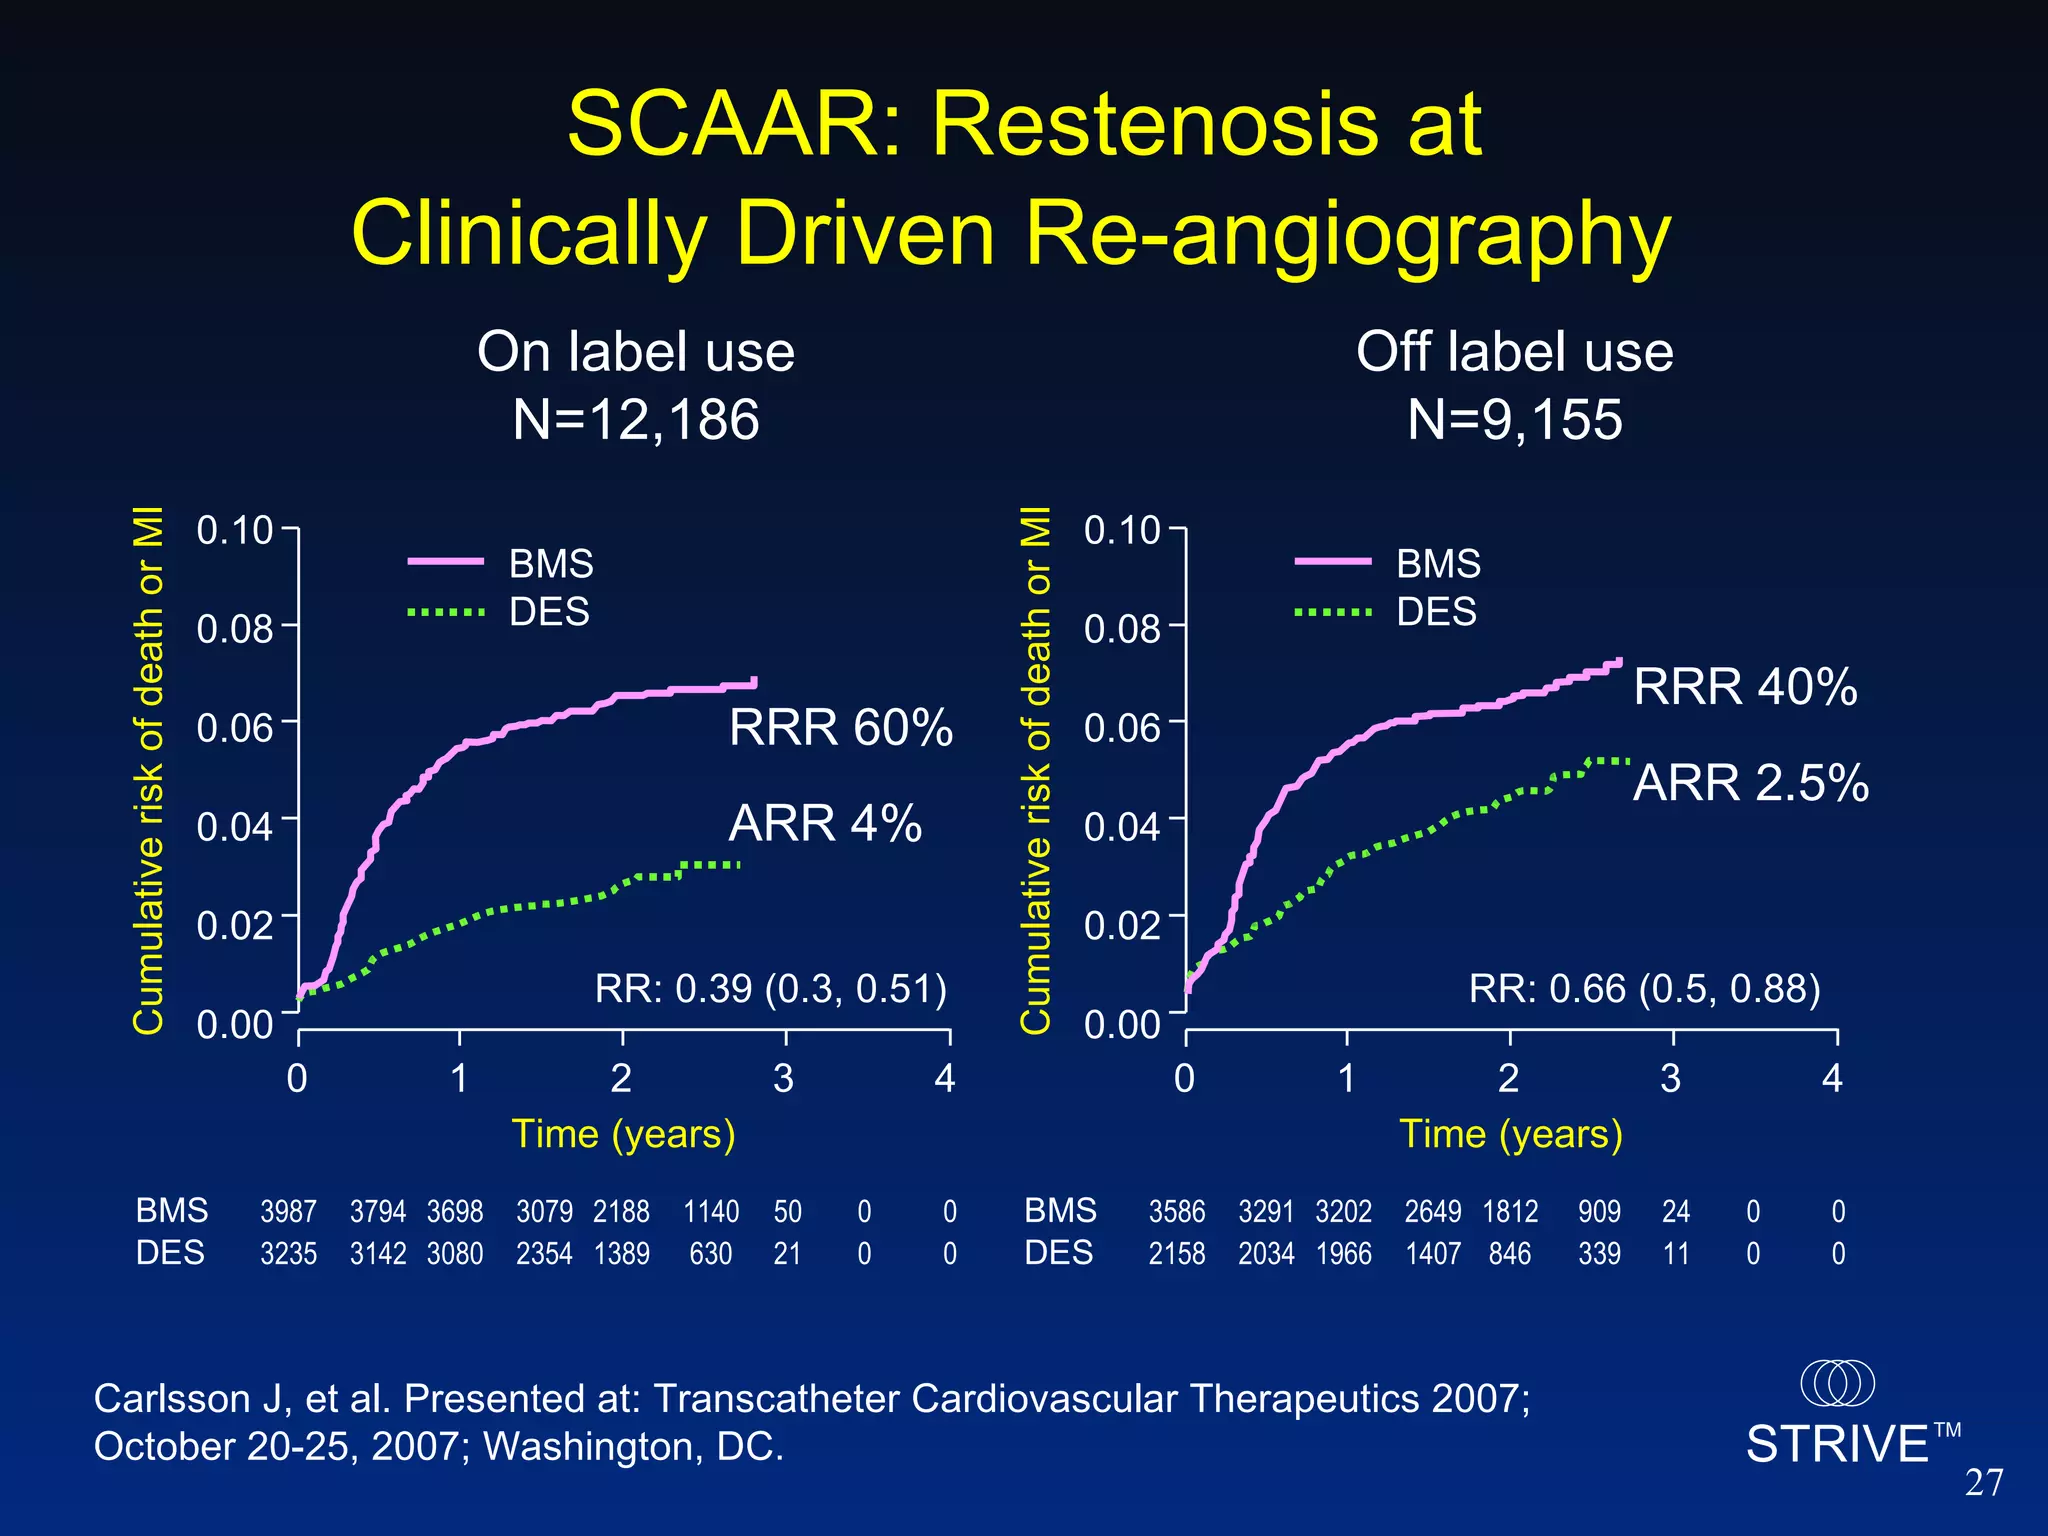
- Data from the EVENT registry showed declining rates of bleeding complications and stent


![HORIZONS AMI: Study Drugs a 97.7% and 7.5% during PCI; b For giant thrombus or refractory no reflow after PCI. CCL = cardiac catheterization laboratory. Stone GW, et al. Presented at: Transcatheter Cardiovascular Therapeutics 2007; October 20-25, 2007; Washington, DC. UFH + GP IIb/IIIa (N=1802) Bivalirudin (N=1800) UFH prerandomization 65.6% 65.6% Antithrombin in CCL - UFH 98.9% 4.1% - Bivalirudin 0.4% 96.9% - Peak ACT 264 [228, 320] 357 [300, 402] GP IIb/IIIa in CCL 94.5% a 7.2% a - Bail-out per protocol b - 4.4% - Abciximab 49.9% 4.0% - Eptifibatide 44.4% 3.1% - Tirofiban 0.2% 0.1%](https://image.slidesharecdn.com/striveteleconfpresentationoct312007-1233742679280243-3/75/TCT-2007-Update-15-2048.jpg)
![Primary Outcome Measures (ITT) a Not related to CABG; b MACE = All-cause death, reinfarction, ischemic TVR or stroke. Stone GW, et al. Presented at: Transcatheter Cardiovascular Therapeutics 2007; October 20-25, 2007; Washington, DC. Diff = 0.0% [-1.6, 1.5] RR = 0.99 [0.76, 1.30] P sup = 1.00 Diff = -3.3% [-5.0, -1.6] RR = 0.60 [0.46, 0.77] P NI ≤ .0001 P sup ≤ .0001 Diff = -2.9% [-4.9, -0.8] RR = 0.76 [0.63, 0.92] P NI ≤ .0001 P sup = .006 1 end point 1 end point 0 5 10 20 15 12.1 9.2 8.3 4.9 5.5 5.4 Net adverse clinical events Major bleeding a MACE b 30-day event rates (%) Bivalirudin monotherapy (N=1800) Heparin + GP IIb/IIIa inhibitor (N=1802)](https://image.slidesharecdn.com/striveteleconfpresentationoct312007-1233742679280243-3/75/TCT-2007-Update-16-2048.jpg)
![30-day Net Adverse Clinical Events Number at risk Bivalirudin 1800 1660 1633 1626 1620 1607 1544 Heparin + GP IIb/IIIa 1802 1635 1591 1578 1569 1552 1482 Primary End Point Net adverse clinical events (%) Time in Days 12.2% 9.3% HR [95%CI] = 0.75 [0.62, 0.92] P =.006 Heparin + GP IIb/IIIa inhibitor (n=1802) Bivalirudin monotherapy (n=1800) Stone GW, et al. Presented at: Transcatheter Cardiovascular Therapeutics 2007; October 20-25, 2007; Washington, DC.](https://image.slidesharecdn.com/striveteleconfpresentationoct312007-1233742679280243-3/75/TCT-2007-Update-17-2048.jpg)
![30-day Major Bleeding (non-CABG) Number at risk Bivalirudin 1800 1697 1675 1668 1664 1653 1590 Heparin + GP IIb/IIIa 1802 1651 1617 1606 1598 1581 1511 Primary End Point Major bleeding (%) Time in Days 8.4% 5.0% HR [95%CI] = 0.59 [0.45, 0.76] P <.0001 Stone GW, et al. Presented at: Transcatheter Cardiovascular Therapeutics 2007; October 20-25, 2007; Washington, DC. Heparin + GP IIb/IIIa inhibitor (n=1802) Bivalirudin monotherapy (n=1800)](https://image.slidesharecdn.com/striveteleconfpresentationoct312007-1233742679280243-3/75/TCT-2007-Update-18-2048.jpg)
![SPIRIT III: MACE Through 365 Days MACE = cardiac death, MI, or ischemia-driven TLR. Stone GW, et al. Presented at: Transcatheter Cardiovascular Therapeutics 2007; October 20-25, 2007; Washington, DC. 0 3 6 12 9 MACE (%) 0 90 180 270 365 Days 9.9% 5.8% TAXUS XIENCE HR = 0.57 [0.36 – 0.90 ] P logrank = .01 Number at risk XIENCE 669 651 642 626 614 TAXUS 332 312 309 292 287](https://image.slidesharecdn.com/striveteleconfpresentationoct312007-1233742679280243-3/75/TCT-2007-Update-21-2048.jpg)