Methods, main results and interpretation of results.
Internal Report.
Design and system Innovation for Sustainability research unit, Design dept., Politecnico di Milano
Human Factors of XR: Using Human Factors to Design XR Systems
STRATEGIC ANALYSIS FOR A SUSTAINABLE TRAVELING EXHIBITION
1. Politecnico di Milano
L’École de design Nantes Atlantique
Aalto University
DIS, DESIGN AND SYSTEM INNOVATION FOR SUSTAINABILIT Y
The TANGO (AH-DEsign) project is funded by the Culture Programme (European Union – Education and Culture DG)
DESIGN
FOR ENVIRONMENTAL
SUSTAINABILITY
course
Professors: Carlo Vezzoli
Sara Cortesi
Design School
Politecnico di Milano (Italy)
Academic year 2011/2012
STRATEGIC ANALYSIS
FOR A SUSTAINABLE
TRAVELING EXHIBITION
methods, main results
and interpretation
of results
Authors:
Carlo Vezzoli
Sara Cortesi
Alberto Aprea
Italian Coordinator: Carlo Vezzoli
2. TABLE OF CONTENTS
EXECUTIVE SUMMARY ...................................................................................2
PART 1 – COURSE BACKGROUND AND GOALS .......................................................3
INTRODUCTION .......................................................................................4
COURSE GOAL AND SYLLABUS......................................................................5
DESIGN METHOD AND TOOLS .......................................................................6
DESIGN BRIEF..........................................................................................8
DESCRIPTION OF THE EXISTING EXHIBITION ELEMENTS........................................9
PART 2 - MAIN RESULTS .............................................................................. 28
ENVIRONMENTAL IMPACTS AND DESIGN PRIORITIES OF THE EXISTING ELEMENTS....... 29
THREE OPTIONS FOR THE WHOLE EXHIBITION ................................................ 48
COMPARISON OF THE ENVIRONMENTAL IMPACTS OF THE THREE OPTIONS............... 52
DETAILED ENVIRONMENTAL IMPACTS OF EACH OPTION ..................................... 56
PART 3 – DESIGNED CONCEPTS ...................................................................... 59
INTRODUCTION ..................................................................................... 60
CONCEPTS FOR THE EXHIBITION WITH POSTERS.............................................. 61
CONCEPTS FOR THE EXHIBITION WITH PROJECTIONS........................................ 89
CONCEPTS FOR THE EXHIBITION OF MODELS .................................................. 96
CONCEPTS FOR THE INFO SIGNS ................................................................106
CONCEPTS FOR THE RECEPTION SYSTEM......................................................143
PART 4 – CONCLUSIONS..............................................................................150
SELECTION OF THE MOST PROMISING CONCEPTS ............................................151
REQUIREMENTS AND MOST PROMISING STRATEGIES TO DESIGN AN ENVIRONMENTALLY
SUSTAINABLE TANGO TRAVELLING EXHIBITION ..............................................156
3. 2
EXECUTIVE SUMMARY
This report presents the method, the results and an interpretation of the results of the
course Design per la Sostenibilità Ambientale (translation: Design for environmental
sustainability), taught by Prof. Carlo Vezzoli and Prof. Sara Cortesi, one of the seven
courses organized during the EU funded TANGO project.
The educational goal of the course is to provide students with knowledge, sensibility,
tools and methods to integrate environmental requirements in the design of industrial
products.
The first part of the course includes a series of ex-cathedra lectures; the second part of
the course is dedicated to a design exercise that aims at presenting how and when tools
to orientate the design towards environmentally sustainable solutions are used.
As a result of this exercise the students design environmental sustainable concepts of
different standard elements for the sustainable travelling TANGO final exhibition.
The MPDS - Method for Product Design for environmental Sustainability used during the
design exercise is presented, and in particular its integration with the strategic analysis
(brief) and concept design phases performed by the students.
During the design exercise the students worked in groups, starting by analysing the
environmental impacts of existing exhibition modules fulfilling the typical needs of a
students’ projects exhibition (i.e. exhibiting posters and models, showing videos, having
signals and a reception), applying the Life Cycle Assessment (LCA) methodology.
On the base of the LCA outcome, they defined the environmental strategic design
priorities for each existing product/functional unit.
The results of the LCAs and the related priorities are presented in Part 2.
As an addition to what included in the course, in this report also a comparison of the
environmental impacts of three possible configurations for the whole exhibition are
presented.
Starting from the defined design priorities, each group generated sustainable product
ideas and then developed a concept. These concepts, along with details on their life
cycles and a comparison of their environmental impact with that of the existing
elements, are presented in Part 3.
In Part 4, a design brief, for what concern the environmental sustainability of the
exhibition and to be integrated in the TANGO travelling exhibition brief, has been
identified, focussing on the following characteristics:
durable/adaptable for different types of students’ projects presentations,
towards an “eternal university-owned exhibition kit”;
digitally travelling, towards a “zero road/rail use”;
minimal and locally-based exhibition elements, towards a “wired-shaped”
exhibition;
low energy consumption/impact for video installation and/or lightening systems,
towards a “zero energy impact exhibition”;
though with a low priority, easily recyclable exhibition components, towards a
“zero waste exhibition”.
5. 4
INTRODUCTION
TANGO (AH-DEsign) is a European Community funded project, lasting from September
2011 until August 2013.
Partners of the project are Aalto University (coordinator – Finland), Politecnico di Milano
(co-organiser - Italy) and L’École de design Nantes Atantique (co-organiser - France).
The main objective of the TANGO project is to explore the issues of social inclusion and
intergenerational dialogue and, through a sustainable travelling exhibition of design
students’ concepts, to propose to the local communities and stakeholders socially and
environmentally promising design concepts, fostering dialogue and setting the stage for
future local implementation.
During the TANGO project, seven courses are organized by the three partner
universities.
Among these is the course Design per la Sostenibilità Ambientale (translation: Design for
environmental sustainability), taught by Prof. Carlo Vezzoli and Prof. Sara Cortesi,
offered to Industrial Design students (BA) in Politecnico di Milano from October 2012 till
January 2013.
The course presents an approach to design environmentally sustainable products and
includes a design exercise aiming at designing different standard elements for a
sustainable travelling exhibition of design students’ concepts.
The method, the results and an interpretation of these results are presented in this
report.
Since the exercise’s focus on the design of exhibition elements, a collaboration was
started with the Laboratorio Allestimenti – Politecnico di Milano, active in the research
and experimentation of new interior exhibition systems, from both technical and
aesthetical point of view, offering technical and consulting service in all the exhibition
areas.
The collaboration involved in particular Paolo Padova (head of the Lab), Mariano
Chernicoff, Chiara Galeazzi and Livio Riceputi.
6. 5
COURSE GOAL AND SYLLABUS
The educational goal of the course Design per la Sostenibilità Ambientale is to provide
students with knowledge, sensibility, tools and methods to integrate environmental
requirements in the design of industrial products.
The first part of the course includes a series of ex-cathedra lectures. The themes of the
lectures are:
sustainable development and the evolution of sustainability in design;
Life Cycle Design concepts and practice;
strategies for the development of low impact products: resources minimisation,
low impact resources selection, product life optimisation, material life extension,
design for disassembly;
method and tools to support design for environmental sustainability.
All the lectures of this part have been recorded. The recordings and the slide shows used
during the lectures are available at www.lens.polimi.it.
Anyone can join the network and login to view and download for free learning resources
and tools1
.
The second part of the course is dedicated to a design exercise that aims at presenting
how and when tools to orientate the design towards environmentally sustainable
solutions are used: Life Cycle Assessment (LCA) of an existing product; IPSA (Indicatori di
Priorità Strategica Ambientale – translation: Indicators of Environmental Strategic
Priority) evaluation; use of idea boards to generate low environmental impact ideas;
representation of the concept as an exploded diagram at the life cycle level; evaluation
of the environmental improvement of the concept in relation to the existing product
(LCA and IPSA).
As a result of this exercise the students design environmental sustainable concepts of
different standard elements for a sustainable travelling exhibition.
1
For more information, go to www.lens.polimi.it and click on Join network.
7. 6
DESIGN METHOD AND TOOLS
The design method used during the design exercise is MPDS - Method for Product Design
for environmental Sustainability2
.
The MPDS method has been developed from the Design and system Innovation for
Sustainability (DIS) research unit of Politecnico di Milano – INDACO department (head:
Prof. Carlo Vezzoli) and aims to integrate and support a product design process for the
development of environmentally sustainable solutions.
The designer who decides to design using the MPDS can integrate the indications
provided at different levels, and decide which tools to use depending on the specific
task he/she is facing and on the context in which he/she operates.
The method is modular, flexible and organized into processes and sub-processes, so that
they can be easily adapted to the specific needs of each designer and company,
facilitating its application in various contexts and design conditions.
During the design exercise, the students, working in group of six, go through the first
two phases of a typical design process, i.e. strategic analysis (brief) and concept design.
The integration of the MPDS with these two phases is detailed in Table 1.
STRATEGICANALYSIS(BRIEF)
PROCESS SUB-PROCESS RESULT TOOL
Definition of the
environmental
design priorities
Life Cycle Assessment (LCA)
of an existing product for
sustainable design
orientation
Environmental indicators functional to identify
design priorities
LCA tool
Definition of the
environmental design
priorities
Environmental priority indicators (high, medium,
low, no)
Tables with eco-
indicators of different
processes
Histograms showing the priorities of intervention
in relation to each strategy
IPSA table (ICS toolkit)
Concise visualisation of
environmental design-
strategic priorities
Radar with a priority indicator in relation to each
Life Cycle Design strategy
Multi-strategy radar (ICS
toolkit)
CONCEPTDESIGN
Generation of
sustainability
focussed ideas
Workshop focussed on the
generation of sustainable
ideas
Set of sustainable ideas for the six Life Cycle
Design strategies with a first selection of the
most promising ones
Eco-ideas board (ICS
toolkit)
Multi-strategy radar (ICS
toolkit)
Redesign of the generated
sustainable ideas
Document with the ideas generated during the
workshop, organized in relation to the
development of a low environmental impact
concept
Sustainable check
of the concepts
and redefinition of
the environmental
priorities
Rendering of the
environmental features of
the concept
Definition and visualisation of the main
characteristics of the life cycle of the designed
concept
Software for 3D
modelling
Exploded view of the
life cycle of the concept
Check of the concepts
improvements (compared
to the assessed product)
Analysis of the environmental impact of the
concept/s and environmental improvements
indicators in relation to the six Life Cycle Design
strategies
LCA tool
Environmental
improvement checklist
IPSA table (ICS toolkit)
Visualization of the
potential environmental
strategic improvements
Multi-strategy radar with the potentials of
environmental improvement for each Life Cycle
Design strategy
Multi-strategy radar (ICS
toolkit)
Table 1 – The integration of MPDS during the strategic analysis (brief) and concept design phases.
2
See Vezzoli C., Ceschin F., Cortesi S. (2010) Metodi e Strumenti per il Life Cycle Design, Maggioli Editore,
Rimini
8. 7
As shown in Table 1, different tools are integrated in different moments during these
two design phases. In the next pages, when summarising the results of the design
exercise, the outcome of only three tools is presented. They are:
a life cycle assessment tool (in the specific instance, the students used SimaPro),
to analyse both the environmental impacts of the existing exhibition elements
and the ones of the designed concepts;
the multi-strategy radar (included in the ICS toolkit3
), to visualise at a glance the
priority (high, medium, low, none) of each design criteria in relation to the
existing element and the related improvements of the designed;
the exploded view of the life cycle of the concepts, showing all the processes
related to each component of the designed elements.
3
The ICS (Ideazione Concept Sostenibili) toolkit is available for free download from www.lens.polimi.it in
the Tools section.
9. 8
DESIGN BRIEF
The brief given to the students is to design different sustainable elements for an
itinerant exhibition that presents concepts of social inclusion and intergenerational
dialogue, developed by design students in the three partner universities.
It’s been considered that the exhibition4
will be travelling in all the partners' cities, and
in particular:
in Milan (April 2013, during the FuoriSalone 2013, in collaboration with
Associazione Tortona Area Lab, open 10 hours/day for 7 days)
in Helsinki (May 2013, at the Helsinki Design Museum, open 10 hours/day for 21
days)
in Nantes (March 2013, during Nantes European Green Capital, open 10 hours/day
for 7 days).
Each group of students has to design for one specific function among those to be
provided for the whole exhibition (the three locations), i.e.:
exhibition of twenty concepts (through A1 posters with two posters per concept,
or four movies projected at the same time with five concepts per each movie);
exhibition of six polyurethane foam small scale models (300x300x150 mm),
properly illuminated and protected;
exhibition of five vertical info signs (800 x 2250 mm), properly illuminated;
information and welcome with a reception desk and a rack with information
brochures, properly illuminated.
The assigned function is also the functional unit to be considered when assessing the
environmental impacts of the existing element and those of the designed concept, thus
making the fulfilment of a need the object of design and comparison and not the
products themselves5
.
4
Set in a minimum space of 75 m2
.
5
See C. Vezzoli, E. Manzini (2008) Design for environmental sustainability, Springer, London
10. 9
DESCRIPTION OF THE EXISTING EXHIBITION
ELEMENTS
Each group should start the design exercise with the analysis of the environmental
impacts of an existing exhibition element having the assigned function/functional unit
described in the previous paragraph (cf. the sub-process of the MPDS method, i.e. Life
Cycle Assessment of an existing product).
Therefore, working in close collaboration with the Laboratorio Allestimenti, for each
function one or more representative/standard exhibition elements have been identified,
among those use by the Laboratorio for its works:
for the exhibition of twenty concepts on A1 posters (two posters per concept),
three possible alternatives are considered:
poster display stands with suspended posters, with two concepts each;
poster display stands with Lycra backdrop, with two concepts each;
poster display stands made of cardboard, with one concept each.
for the exhibition of twenty concepts through four movies projected at the same
time (five concepts per each movie):
projecting systems;
for the exhibition of six polyurethane foam small scale models (300x300x150 mm),
properly illuminated and protected:
model showcases, with two models each;
for the exhibition of five vertical info signs (800 x 2250 mm), properly
illuminated, three possible alternatives are considered:
info modules with rubber feet;
info modules with recycled plastic bases;
info modules with New Jersey base.
for the information and welcome with a reception desk and a rack with
information brochures, properly illuminated:
reception system.
Data about each step of the life cycle of the selected elements, collected and provided
to the students, are presented in the following pages. In particular:
for the PRE-PRODUCTION (PP) stage: weight and material of each component and
its standard lifespan (in terms of number of times the component can be
used/reused);
for the PRODUCTION (P) stage: manufacturing process/es of each component;
for the DISTRIBUTION (DT) stage: estimated distance travelled by each
component6
;
for the USE (U) stage: electric energy consumed during the exhibition (for lighting
and electronic equipment)
for the DISPOSAL (DP) stage: type of disposal7
(i.e. % of recycling, incineration
and landfill for each material/material category).
6
Some components are provided on site, thus they do not travel, others are transported from Milan to
Helsinki, then Nantes and back to Milan, collecting thousands of travelled kilometres.
7
It's been considered that the exhibition starts from Milan and that the exhibition modules, owned by the
Laboratorio Allestimenti – Politecnico di Milano, should come back to Milan and there be disposed.
11. 10
POSTER DISPLAY STAND WITH SUSPENDED POSTERS
Tubes, joints, bolts and the Tahuma fixing system are used for 90 exhibitions before
being disposed.
The Oriented Strand Board (OSB) platform is used for 60 exhibitions before being
disposed.
The triangular reinforcements are used for 39 exhibitions before being disposed.
The support boards made of Forex are used for 12 exhibitions before being disposed.
A1 posters are used for 3 exhibitions before being disposed.
Nylon wires and clamps are disposed and substituted after each stage of the exhibition.
In the following table, data about the life cycle of one module are presented.
12. 11
COMPONENT MATERIAL
PP
7x frame tubes Aluminium
1x light tube Aluminium
6x “Padova” joints Reinforcing steel
2x bases OSB
4x bands Nylon
Nylon wire Nylon
2x panels Forex
8x “Tahuma” fixing systems Reinforcing steel
2x additional triangular supports Varnished OSB
4x A1 posters Paper
COMPONENT MANUFACTURING
P
7x frame tubes Extrusion
1x light tube Extrusion
6x “Padova” joints Extrusion
2x OSB bases [included in the material]
4x bands Extrusion
Nylon wire [included in the material]
2x panels [included in the material]
8x “Tahuma” fixing joints Mechanical manufacturing
2x additional triangular supports [included in the material]
4x A1 posters [included in the material]
MEANS OF TRANSPORT DISTANCE
DT
Heavy lorry
Milano – Helsinki – Nantes - Milano =
6384 km
FUNCTION PROCESS
U
Module lighting in Milan
Electricity (grid) for two 120W light bulb
switched on 10hrs/day, 7 days
Module lighting in Helsinki
Electricity (grid) for two 120W light bulb
switched on 10hrs/day, 21 days
Module lighting in Nantes
Electricity (grid) for two 120W light bulb
switched on 10hrs/day, 7 days
TREATMENTS
DP
Mix of recycle, incineration and landfill
13. 12
POSTER DISPLAY STAND WITH LYCRA BACKDROP
Tubes, joints, bolts and the bases are used for 90 exhibitions before being disposed.
The Lycra sheet and the paperclips are used for 9 exhibitions before being disposed.
The stocking clips are used for 6 exhibition before being disposed
A1 sheets are used for 3 exhibitions before being disposed.
Clamps and nylon wires are disposed and substituted after each stage of the exhibition.
In the following table, data about the life cycle of one module are presented.
14. 13
COMPONENT MATERIAL
PP
8x frame tubes Aluminium
1x light tube Aluminium
10x “Frigerio” joints Aluminium
10x nuts and bolts sets Reinforcing steel
2x New Jersey bases HDPE
1x Lycra sheet Lycra
20x stocking clips (soft part) Rubber
20x stocking clips (hard part) Reinforcing steel
20x bands Nylon
11x Nylon wires Nylon
16x paperclips Reinforcing steel
4x A1 posters Paper
COMPONENT MANUFACTURING
P
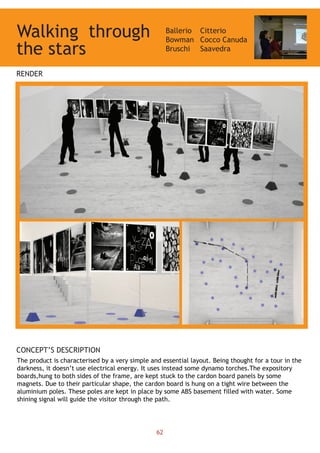
8x frame tubes Extrusion
1x light tube Extrusion
10x “Frigerio” joints Dye casting
10x nuts and bolts sets Mechanical manufacturing
2x New Jersey bases Injection moulding
1x Lycra sheet Weaving
20x stocking clips (soft part) Injection moulding
20x stocking clips (hard part) Mechanical manufacturing
20x bands Injection moulding
11x nylon wires [included in the material]
16x paperclips Mechanical manufacturing
4x A1 posters [included in the material]
MEANS OF TRANSPORT DISTANCE
DT
Heavy lorry
Milano – Helsinki – Nantes - Milano =
6384 km
FUNCTION PROCESS
U
Module lighting in Milan
Electricity (grid) for two 120W light bulb
switched on 10hrs/day, 7 days
Module lighting in Helsinki
Electricity (grid) for two 120W light bulb
switched on 10hrs/day, 21 days
Module lighting in Nantes
Electricity (grid) for two 120W light bulb
switched on 10hrs/day, 7 days
TREATMENTS
DP
Mix of recycle, incineration and landfill
15. 14
POSTER DISPLAY STAND MADE OF CARDBOARD
Tubes and bases are used for 90 exhibitions before being disposed.
The cardboard is used for 48 exhibitions before being disposed.
The paperclips are used for 9 exhibitions before being disposed.
A1 posters are used for 3 exhibitions before being disposed.
Clamps are disposed and substituted after each stage of the exhibition.
In the following table, data about the life cycle of one module are presented.
16. 15
COMPONENT MATERIAL
PP
2x tubes Aluminium
1x recycled plastic base Aluminium
1x panel Reinforcing steel
4x bands Nylon
4x paperclips Steel
2x A1 posters Paper
COMPONENT MANUFACTURING
P
2x tubes Extrusion
1x recycled plastic base Injection moulding
1x panel [included in the material]
4x bands Injection moulding
4x paperclips Mechanical manufacturing
2x A1 posters [included in the material]
MEANS OF TRANSPORT DISTANCE
DT
Heavy lorry
Milano – Helsinki – Nantes - Milano =
6384 km
FUNCTION PROCESS
U
Module lighting in Milan
Electricity (grid) for one 120W light bulb
switched on 10hrs/day, 7 days
Module lighting in Helsinki
Electricity (grid) for one 120W light bulb
switched on 10hrs/day, 21 days
Module lighting in Nantes
Electricity (grid) for one 120W light bulb
switched on 10hrs/day, 7 days
TREATMENTS
DP
Mix of recycle, incineration and landfill
17. 16
PROJECTING SYSTEM
Tubes and joints are used for 90 exhibitions before being disposed.
The sheet is used for 9 exhibitions before being disposed.
The stocking clips are used for 6 exhibitions before being disposed.
A1 posters are used for 3 exhibitions before being disposed.
Clamps and iron wires are disposed and substituted after each stage of the exhibition.
The laptop computer life span is about 10950 hours.
The projector life span is about 6000 hours.
In the following table, data about the life cycle of one module are presented.
18. 17
COMPONENT MATERIAL
PP
4x frame tubes Aluminium
4x L-shaped joints PVC
1x Lycra sheet Lycra
20x stocking clips (soft part) Rubber
20x stocking clips (hard part) Reinforcing steel
2m iron wire Iron
34x clamps Nylon
1x projector Various
1x laptop Various
COMPONENT MANUFACTURING
P
4x frame tubes Extrusion
4x L-shaped joints Injection moulding
1x Lycra sheet Weaving
20x stocking clips (soft part) Injection moulding
20x stocking clips (hard part) Mechanical manufacturing
2m iron wire Wire drawing
34x clamps Injection moulding
1x projector [included in the material]
1x laptop [included in the material]
MEANS OF TRANSPORT DISTANCE
DT
Heavy lorry
Milano – Helsinki – Nantes - Milano =
6384 km
FUNCTION PROCESS
U
Projection in Milano
Electricity (grid) for one 470W projector
switched on 10hrs/day, 7 days
Projection in Helsinki
Electricity (grid) for one 470W projector
switched on 10hrs/day, 21 days
Projection in Nantes
Electricity (grid) for one 470W projector
switched on 10hrs/day, 7 days
Laptop use in Milano
Electricity (grid) for one 50W laptop
switched on 10hrs/day, 7 days
Laptop use in Helsinki
Electricity (grid) for one 50W laptop
switched on 10hrs/day, 21 days
Laptop use in Nantes
Electricity (grid) for one 50W laptop
switched on 10hrs/day, 7 days
TREATMENTS
DP
Mix of recycle, incineration and landfill
19. 18
MODEL SHOWCASE
Tubes, base, panel, angular outline joints and screws are used for 90 exhibitions before
being disposed.
The Oriented Strand Board (OSB) platform is used for 48 exhibitions before being
disposed.
The PMMA showcase is used for 12 exhibitions before being disposed.
Models are used for 3 exhibitions before being disposed.
In the following table, data about the life cycle of one module are presented.
20. 19
COMPONENT MATERIAL
PP
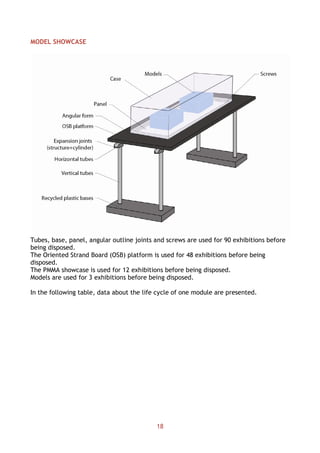
1x OSB platform Varnished OSB
4x vertical tubes Aluminium
4x horizontal tubes Aluminium
2x recycled plastic bases Recycled PE
1x panel Dbond (Aluminium 70%, PE 30%)
1x angular form Aluminium
1x case PMMA
14x screws Reinforcing steel
2x expansion joints (structure) Low-alloyed steel
2x expansion joints (cylinder) Tetrafluoroethylene
2x models Polyurethane foam
COMPONENT MANUFACTURING
P
1x OSB platform [included in the material]
4x vertical tubes Extrusion
4x horizontal tubes Extrusion
2x recycled plastic bases Injection moulding
1x panel [included in the material]
1x angular form Extrusion
1x case [included in the material]
14x screws Mechanical manufacturing
2x expansion joints (structure) Extrusion
2x expansion joints (cylinder) Injection moulding
2x models [included in the material]
MEANS OF TRANSPORT DISTANCE
DT
Heavy lorry
Milano – Helsinki – Nantes - Milano =
6384 km
FUNCTION PROCESS
U
Module lighting in Milan
Electricity (grid) for one 120W light bulb
switched on 10hrs/day, 7 days
Module lighting in Helsinki
Electricity (grid) for one 120W light bulb
switched on 10hrs/day, 21 days
Module lighting in Nantes
Electricity (grid) for one 120W light bulb
switched on 10hrs/day, 7 days
TREATMENTS
DP
Mix of recycle, incineration and landfill
21. 20
INFO MODULE WITH RUBBER FEET
Tubes, joints, tags and bases are used for 90 exhibitions before being disposed.
The PVC sheet is used for 18 exhibitions before being disposed.
Clamps and the iron wire are disposed and substituted after each stage of the
exhibition.
In the following table, data about the life cycle of one module are presented.
22. 21
COMPONENT MATERIAL
PP
4x frame tubes Aluminium
2x joints, L-shaped PVC
2x joints, T-shaped PVC
1x supporting sheet PVC
2x tags Dbond (Aluminium 70%, PE 30%)
4x clamps Nylon
2x bases (internal covering) PVC
2x bases (body) Rubber
2m iron wire Steel
COMPONENT MANUFACTURING
P
4x frame tubes Extrusion
2x joints, L-shaped Injection moulding
2x joints, T-shaped Injection moulding
1x supporting sheet Extrusion
2x tags [included in the material]
2x bands Injection moulding
2x bases (internal covering) Injection moulding
2x bases (body) Injection moulding
2m iron wire Wire drawing
MEANS OF TRANSPORT DISTANCE
DT
Heavy lorry
Milano – Helsinki – Nantes - Milano =
6384 km
FUNCTION PROCESS
U
Module lighting in Milan
Electricity (grid) for one 120W light
bulb switched on 10hrs/day, 7 days
Module lighting in Helsinki
Electricity (grid) for one 120W light
bulb switched on 10hrs/day, 21 days
Module lighting in Nantes
Electricity (grid) for one 120W light
bulb switched on 10hrs/day, 7 days
TREATMENTS
DP
Mix of recycle, incineration and landfill
23. 22
INFO MODULE WITH RECYCLED PLASTIC BASES
Tubes, joints, tags and bases are used for 90 exhibitions before being disposed.
The PVC sheet is used for 18 exhibitions before being disposed.
Clamps and the iron wire are disposed and substituted after each stage of the
exhibition.
In the following table, data about the life cycle of one module are presented.
24. 23
COMPONENT MATERIAL
PP
4x frame tubes Aluminium
2x joints, L-shaped PVC
2x joints, T-shaped PVC
1x supporting sheet PVC
2x tags Dbond (Aluminium 70%, PE 30%)
4x clamps Nylon
2x recycled plastic bases Recycled PE
COMPONENT MANUFACTURING
P
4x frame tubes Extrusion
2x joints, L-shaped Injection moulding
2x joints, T-shaped Injection moulding
1x supporting sheet Extrusion
2x tags [included in the material]
2x bands Injection moulding
2x recycled plastic bases Injection moulding
MEANS OF TRANSPORT DISTANCE
DT
Heavy lorry
Milano – Helsinki – Nantes - Milano =
6384 km
FUNCTION PROCESS
U
Module lighting in Milan
Electricity (grid) for one 120W light bulb
switched on 10hrs/day, 7 days
Module lighting in Helsinki
Electricity (grid) for one 120W light bulb
switched on 10hrs/day, 21 days
Module lighting in Nantes
Electricity (grid) for one 120W light bulb
switched on 10hrs/day, 7 days
TREATMENTS
DP
Mix of recycle, incineration and landfill
25. 24
INFO MODULE WITH NEW JERSEY BASE
Tubes, joints, tags and base are used for 90 exhibition before being disposed.
The PVC sheet is used for 18 exhibitions before being disposed.
Clamps are disposed and substituted after each stage of the exhibition.
In the following table, data about the life cycle of one module are presented.
26. 25
COMPONENT MATERIAL
PP
4x frame tubes Aluminium
2x joints, L-shaped PVC
2x joints, T-shaped PVC
1x supporting sheet PVC
2x tags Dbond (Aluminium 70%, PE 30%)
4x clamps Nylon
1x New Jersey base HDPE
COMPONENT MANUFACTURING
P
4x frame tubes Extrusion
2x joints, L-shaped Injection moulding
2x joints, T-shaped Injection moulding
1x supporting sheet Extrusion
2x tags [included in the material]
4x bands Injection moulding
1x New Jersey base Injection moulding
MEANS OF TRANSPORT DISTANCE
DT
Heavy lorry
Milano – Helsinki – Nantes - Milano =
6384 km
FUNCTION PROCESS
U
Module lighting in Milan
Electricity (grid) for one 120W light bulb
switched on 10hrs/day, 7 days
Module lighting in Helsinki
Electricity (grid) for one 120W light bulb
switched on 10hrs/day, 21 days
Module lighting in Nantes
Electricity (grid) for one 120W light bulb
switched on 10hrs/day, 7 days
TREATMENTS
DP
Mix of recycle, incineration and landfill
27. 26
RECEPTION SYSTEM
The desk is used for 99 exhibitions before being disposed.
The display rack is used for 90 exhibition before being disposed.
Clamps are disposed and substituted after each stage of the exhibition.
In the following table, data about the life cycle of one module are presented.
28. 27
COMPONENT MATERIAL
PP
Desk woody parts Plywood
4x hinges Reinforcing steel
16x screws Reinforcing steel
8x pegs Beech
1x expositor structure Reinforcing steel
1x metal layer Reinforcing steel
1x base weight Reinforcing steel
2x nuts and bolts sets Reinforcing steel
2x clamps Nylon
COMPONENT MANUFACTURING
P
Desk woody parts [included in the material]
4x hinges Mechanical manufacturing
16x screws Mechanical manufacturing
8x pegs [included in the material]
1x expositor structure Mechanical manufacturing
1x metal layer Rolling
1x base weight Mechanical manufacturing
2x nuts and bolts sets Mechanical manufacturing
2x clamps Injection moulding
MEANS OF TRANSPORT DISTANCE
DT
Heavy lorry
Milano – Helsinki – Nantes – Milano =
6384 km
FUNCTION PROCESS
U
Module lighting in Milan
Electricity (grid) for one 100W light bulb
switched on 10hrs/day, 7 days
Module lighting in Helsinki
Electricity (grid) for one 100W light bulb
switched on 10hrs/day, 21 days
Module lighting in Nantes
Electricity (grid) for one 100W light bulb
switched on 10hrs/day, 7 days
TREATMENTS
DP
Mix of recycle, incineration and landfill
30. 29
ENVIRONMENTAL IMPACTS AND DESIGN PRIORITIES
OF THE EXISTING ELEMENTS
Following the MPDS method, using the SimaPro software the students started their
design exercise with the Life Cycle Assessment (LCA) of an existing exhibition element,
based on the information presented in the previous chapter.
In the following paragraphs, the main LCA results for each element are presented, i.e.:
the impact8
of each phase in the life cycle9
of the products10
;
the environmental effects that give a higher contribution to the overall impact of
the products,
the processes11
that give a higher contribution to the overall impact of the
products.
Then, the students used the results from the LCAs to define the environmental strategic
design priorities of the assessed element and visualize them, using, respectively the IPSA
table and the Multi-strategy radar, both part of the ICS toolkit (see the second and third
sub-processes of MPDS).
In the following paragraphs, the strategic environmental priorities are shown through
the Multi-strategy radar.
8
The environmental impacts are expressed in Pt that is the unit of measurement used by Eco-indicator 99,
the assessment method selected for these LCAs.
9
In many of the following cases, the impact of the disposal phase is negative since the avoided impacts of
recycling (i.e. considering the “savings” obtained by not having to produce new virgin material) are taken
into account.
10
The life cycle phases usually considered in a LCA are: pre-production, production, distribution, use and
disposal. Due to the specific organization of the software used for the analysis, the results related to the
first two phase are aggregated.
11
Following what happens in the software Simapro, here the expression “process” can refer to different
phenomena and performances such as materials, production processes, energy consumptions, distribution
tasks, ...
31. 30
POSTER DISPLAY STAND WITH SUSPENDED POSTERS
Overall impact
The evaluation results show that the contribution of the different life cycle phases is, in
descending order:
1. Distribution: 57,02 Pt
2. Use: 33,85 Pt
3. Pre-Production + Production: 12,97 Pt
4. Disposal: 0,08 Pt
Figure 1 – The environmental impacts of the life cycle phases of the Poster display stand with suspended posters.
Environmental effects
The three environmental effects which contribute more to generate the overall impact
are, in descending order:
1. Fossil fuels: 49,39 Pt
2. Resp. Inorganics: 20,41 Pt
3. Carcinogens: 7,16 Pt
PRE-PRODUCTION
+ PRODUCTION
DISTRIBUTION USE DISPOSAL
0
10
20
30
40
50
60
Pt
32. 31
Processes
The three processes which contribute more to the overall life cycle impact are, in
descending order:
1. On road transportation: 25,26 Pt
2. Electricity consumption in Finland: 3,4 Pt
3. Electricity consumption in Italy: 1,71 Pt
Design priorities
On the base of the LCA results, the environmental strategic design priority of each Life
Cycle Design strategy have been calculated and are presented in Figure 2.
Figure 2 – Multi-strategy radar showing the environmental strategic design priority of the Poster display stand with
suspended posters.
33. 32
POSTER DISPLAY STAND WITH LYCRA BACKDROP
Overall impact
The evaluation results show that the contribution of the different life cycle phases is, in
descending order:
1. Distribution: 45,3 Pt
2. Use: 22,57 Pt
3. Pre-Production + Production: 15 Pt
4. Disposal: -2,06 Pt
Figure 3 – The environmental impacts of the life cycle phases of the Poster display stand with Lycra backdrop.
Environmental effects
The three environmental effects which contribute more to generate the overall impact
are, in descending order:
1. Fossil fuels: 40,89 Pt
2. Resp. Inorganics: 18,83 Pt
3. Carcinogens: 7,19 Pt
PRE-PRODUCTION
+ PRODUCTION
DISTRIBUTION USE DISPOSAL
-10
0
10
20
30
40
50
Pt
34. 33
Processes
The three processes which contribute more to the overall life cycle impact are, in
descending order:
1. On road transportation: 45,34 Pt
2. Electricity consumption in Finland: 13,6 Pt
3. Electricity consumption in Italy: 6,88 Pt
Design priorities
On the base of the LCA results, the environmental strategic design priority of each Life
Cycle Design strategy have been calculated and are presented in Figure 4.
Figure 4 – Multi-strategy radar showing the environmental strategic design priority of the Poster display stand with
Lycra backdrop.
35. 34
POSTER DISPLAY STAND MADE OF CARDBOARD
Overall impact
The evaluation results show that the contribution of the different life cycle phases is, in
descending order:
1. Distribution: 62,78 Pt
2. Use: 22,57 Pt
3. Pre-Production + Production: 7,66 Pt
4. Disposal: -0,24 Pt
Figure 5 – The environmental impacts of the life cycle phases of the Poster display stand made of cardboard.
Environmental effects
The three environmental effects which contribute more to generate the overall impact
are, in descending order:
Fossil fuels: 50,5 Pt
Resp. Inorganics: 20,1 Pt
Climate change: 7,17 Pt
PRE-PRODUCTION
+ PRODUCTION
DISTRIBUTION USE DISPOSAL
-10
0
10
20
30
40
50
60
70
Pt
36. 35
Processes
The three processes which contribute more to the overall life cycle impact are, in
descending order:
1. On road transportation: 62,78 Pt
2. Electricity consumption in Finland: 13,62 Pt
3. Electricity consumption in Italy: 6,88 Pt
Design priorities
On the base of the LCA results, the environmental strategic design priority of each Life
Cycle Design strategy have been calculated and are presented in
Figure 6 – Multi-strategy radar showing the environmental strategic design priority of the Poster display stand made of
cardboard.
37. 36
PROJECTING SYSTEM
Overall impact
The evaluation results show that the contribution of the different life cycle phases is, in
descending order:
1. Use: 19,56 Pt
2. Pre-Production + Production: 10,81 Pt
3. Distribution: 3,63 Pt
4. Disposal: -0,14 Pt
Figure 7 – The environmental impacts of the life cycle phases of the Projecting system.
Environmental effects
The three environmental effects which contribute more to generate the overall impact
are, in descending order:
1. Fossil fuels: 11,03 Pt
2. Carcinogens: 8,51 Pt
3. Resp. Inorganics: 8,08 Pt
PRE-PRODUCTION
+ PRODUCTION
DISTRIBUTION USE DISPOSAL
0
5
10
15
20
25
Pt
38. 37
Processes
The three processes which contribute more to the overall life cycle impact are, in
descending order:
1. Electricity consumption in Finland: 11,8 Pt
2. Electricity consumption in Italy: 5,96 Pt
3. Production of the laptop computer components: 4,44 Pt
Design priorities
On the base of the LCA results, the environmental strategic design priority of each Life
Cycle Design strategy have been calculated and are presented in Figure 8.
Figure 8 – Multi-strategy radar showing the environmental strategic design priority of the Projecting system.
39. 38
MODEL SHOWCASE
Overall impact
The evaluation results show that the contribution of the different life cycle phases is, in
descending order:
1. Distribution: 25,40 Pt
2. Pre-Production + Production: 11,27 Pt
3. Use: 3,39 Pt
4. Disposal: 0,60 Pt
Figure 9 – The environmental impacts of the life cycle phases of the Model showcase.
Environmental effects
The three environmental effects which contribute more to generate the overall impact
are, in descending order:
1. Fossil fuels: 24,57 Pt
2. Resp. Inorganics: 8,04 Pt
3. Climate change: 3,22 Pt
PRE-PRODUCTION
+ PRODUCTION
DISTRIBUTION USE DISPOSAL
0
5
10
15
20
25
30
Pt
40. 39
Processes
The three processes which contribute more to the overall life cycle impact are, in
descending order:
1. On road transportation: 25,40 Pt
2. PMMA for the case: 8,08 Pt
3. Electricity consumption in Finland: 2,04 Pt
Design priorities
On the base of the LCA results, the environmental strategic design priority of each Life
Cycle Design strategy have been calculated and are presented in Figure 10.
Figure 10 – Multi-strategy radar showing the environmental strategic design priority of the Model showcase.
41. 40
INFO MODULE WITH RUBBER FEET
Overall impact
The evaluation results show that the contribution of the different life cycle phases is, in
descending order:
1. Use: 5,64 Pt
2. Distribution: 4,40 Pt
3. Pre-Production + Production: 1,24 Pt
4. Disposal: -0,28 Pt
Figure 11 – The environmental impacts of the life cycle phases of the Info module with rubber feet.
Environmental effects
The three environmental effects which contribute more to generate the overall impact
are, in descending order:
1. Fossil fuels: 4,99 Pt
2. Resp. Inorganics: 2,69 Pt
3. Carcinogens: 1,3 Pt
PRE-PRODUCTION
+ PRODUCTION
DISTRIBUTION USE DISPOSAL
-1
0
1
2
3
4
5
6
Pt
42. 41
Processes
The three processes which contribute more to the overall life cycle impact are, in
descending order:
1. On road transportation – 4,4 Pt
2. Electricity consumption in Finland - 3,4 Pt
3. Electricity consumption in Italy - 1,72 Pt
Design priorities
On the base of the LCA results, the environmental strategic design priority of each Life
Cycle Design strategy have been calculated and are presented in Figure 12.
Figure 12 – Multi-strategy radar showing the environmental strategic design priority of the Info module with rubber
feet.
43. 42
INFO MODULE WITH RECYCLED PLASTIC BASES
Overall impact
The evaluation results show that the contribution of the different life cycle phases is, in
descending order:
1. Distribution: 25,26 Pt
2. Use: 5,64 Pt
3. Pre-Production + Production: 2,81 Pt
4. Disposal: -0,1 Pt
Figure 13 - The environmental impacts of the life cycle phases of the Info module with recycled plastic bases.
Environmental effects
The three environmental effects which contribute more to generate the overall impact
are, in descending order:
1. Fossil fuels: 19,21 Pt
2. Resp. Inorganics: 6,99 Pt
3. Climate change: 2,57 Pt
PRE-PRODUCTION
+ PRODUCTION
DISTRIBUTION USE DISPOSAL
-5
0
5
10
15
20
25
30
Pt
44. 43
Processes
The three processes which contribute more to the overall life cycle impact are, in
descending order:
1. On road transportation: 25,26 Pt
2. Electricity consumption in Finland: 3,4 Pt
3. Electricity consumption in Italy: 1,71 Pt
Design priorities
On the base of the LCA results, the environmental strategic design priority of each Life
Cycle Design strategy have been calculated and are presented in Figure 14.
Figure 14 – Multi-strategy radar showing the environmental strategic design priority of the Info module with recycled
plastic bases.
45. 44
INFO MODULE WITH NEW JERSEY BASE
Overall impact
The evaluation results show that the contribution of the different life cycle phases is, in
descending order:
1. Distribution: 8,19 Pt
2. Use: 5,64 Pt
3. Pre-Production + Production: 1,54 Pt
4. Disposal: -0,29 Pt
Figure 15 – The environmental impacts of the life cycle phases of the Info module with New Jersey base.
Environmental effects
The three environmental effects which contribute more to generate the overall impact
are, in descending order:
1. Fossil fuels: 7,56 Pt
2. Resp. Inorganics: 3,42 Pt
3. Climate change: 1,43 Pt
PRE-PRODUCTION
+ PRODUCTION
DISTRIBUTION USE DISPOSAL
-1
0
1
2
3
4
5
6
7
8
9
Pt
46. 45
Processes
The three processes which contribute more to the overall life cycle impact are, in
descending order:
1. On road transportation: 8,18 Pt
2. Electricity consumption in Finland: 3,4 Pt
3. Electricity consumption in Italy: 1,72 Pt
Design priorities
On the base of the LCA results, the environmental strategic design priority of each Life
Cycle Design strategy have been calculated and are presented in Figure 16.
Figure 16 – Multi-strategy radar showing the environmental strategic design priority of the Info module with New
Jersey base.
47. 46
RECEPTION SYSTEM
Overall impact
The evaluation results show that the contribution of the different life cycle phases is, in
descending order:
1. Distribution: 5,19 Pt
2. Use: 0,94 Pt
3. Pre-Production + Production: 0,1 Pt
4. Disposal: 0 Pt
Figure 17 – The environmental impacts of the life cycle phases of the Reception system.
Environmental effects
The three environmental effects which contribute more to generate the overall impact
are, in descending order:
1. Fossil fuels: 3,63 Pt
2. Resp. Inorganics: 1,3 Pt
3. Climate change: 0,47 Pt
PRE-PRODUCTION
+ PRODUCTION
DISTRIBUTION USE DISPOSAL
0
1
2
3
4
5
6
Pt
48. 47
Processes
The three processes which contribute more to the overall life cycle impact are, in
descending order:
1. On road transportation: 5,19 Pt
2. Electricity consumption in Finland: 0,57 Pt
3. Electricity consumption in Italy: 0,19 Pt
Design priorities
On the base of the LCA results, the environmental strategic design priority of each Life
Cycle Design strategy have been calculated and are presented in Figure 18Figure 18.
Figure 18 – Multi-strategy radar showing the environmental strategic design priority of the Reception system.
49. 48
THREE OPTIONS FOR THE WHOLE EXHIBITION
As said, during the course each group of students focussed on the analysis, and then
design, of a single element of the exhibition.
Nevertheless, in this report it was deemed useful to imagine also three possible
configurations for the whole exhibition (i.e. fulfilling all the necessary functions
presented in the previous pages) then showing and comparing their environmental
impact, in order to define first possible directions for the design of the complete
sustainable exhibition.
Taking in consideration the need to exhibit the same contents with different media,
three possible configurations have been imagined, the results of the combination of
different elements selected among those presented in the previous pages:
a poster based exhibition, where all the contents are presented in a printed form;
a video based exhibition, where the contents are presented in a digital form with
little use of printed material, e.g. only as introduction to the project and the
contents;
an ½ video – ½ poster based exhibition, where a mixed use of printed and digital
supports is made.
When more than one module was available to satisfy the same function, the one with
the lowest environmental impact, but at the same time granting reliability and
flexibility, was preferred.
Also in this case, in order to have comparable results, the same functional unit was
considered and it is defined as:
exhibition of twenty concepts (through A1 posters with two posters per concept,
or four movies projected at the same time with five concepts per each movie);
exhibition of five vertical info signs (800 x 2250 mm), properly illuminated;
information and welcome with a reception desk and a rack with information
brochures, properly illuminated.
50. 49
POSTER BASED EXHIBITION
Composition:
5x Info modules with New Jersey base;
10x Poster display stands with Lycra backdrop;
1x Reception system.
The poster based configuration provides the printed exposition of all the twenty system
concepts. Each concept is displayed in two A1 posters.
In addition, the use of five info spots is considered, where information about the
exhibition in general and about the orientation order inside the exhibition venue is
presented.
For the interaction with the visitors a reception system (desk + rack) is also provided,
where brochures about the TANGO project, its development, the event setting and so on
can be distributed.
On the overall, the lighting of this configuration is provided by twenty-six 120W
incandescent bulbs.
The exhibition is fully transported on road through all the stages scheduled for the
exhibition (from Milano to Helsinki, then to Nantes and back to Milano).
51. 50
VIDEO BASED EXHIBITION
Composition:
11x Info modules with New Jersey base;
10x Projecting systems;
1x Reception systems.
The video based exhibition provides the exhibition of all the contents through the use of
digital projecting systems. As for the first configuration, twenty concepts are exhibited
using ten digital exhibition units with two concepts in loop on each system.
In addition, the use of eleven info spots is also considered, one per each projecting
system (in order to introduce the contents on the videos) and the remaining one to give
general information about the exhibition structure and orientation.
As for the poster based configuration it is also used a reception desk, in order to
distribute brochures and additional information to the visitors.
The reception desk, the projecting sheets and the info spots are transported on road
through each exhibition stage. The electronic components are hired in the place where
the exhibition is taking place.
The lightning system is composed of twelve 120W incandescent light bulbs, one per each
info spot and one for the reception desk.
52. 51
½ VIDEO – ½ POSTER BASED EXHIBITION
Composition:
8x Info modules with New Jersey base;
5x Poster display stands with Lycra backdrop;
1x Reception system;
5x Projecting systems.
The ½ poster – ½ video configuration provides the exhibition of the contents with a mix
of printed posters and projected of videos and pictures. In this case each one of the
twenty concept ideas is described in one A1 paper and a video. On the overall five
exhibition units (with fours concepts each) and five digital exhibition units (with four
videos each) are used.
In addition, eight info spots (one per each digital system and three to give information
about the orientation order) and a reception desk are also considered.
As for the other two configurations, all the non-digital elements are transported on road
through all the exhibition stages. On the other hand, the electronics are hired in the
place where the exhibition is taking place.
The lightning system is composed of nineteen 120W incandescent light bulbs, one per
each info spot, two per each exhibition unit and the remaining one for the reception.
53. 52
COMPARISON OF THE ENVIRONMENTAL IMPACTS OF
THE THREE OPTIONS
In this chapter the comparison of the life cycle environmental impacts of the three
configurations is presented as well as a first interpretation of the results.
Considering the overall impact of the three configurations, it emerges that the one with
the lower global environmental impact is the poster based one (Figure 19).
Figure 19 – Comparison of the global environmental impact of the configurations considered for the whole exhibition.
The three configurations impact as follows:
Poster based – 104,91 Pt
Video based – 127,12 Pt
½ video – ½ poster based – 115,1 Pt
In Figure 19 it can be seen also how the single life cycle phases contribute to the overall
impact of each configuration:
for the poster based configuration the main impact is given by the distribution
phase, which determines 55% of the overall impact;
for the video based configuration the main impact is given by the use phase,
which determines about 47% of the overall impact;
for the ½ video – ½ poster based configuration use and distribution equally
contribute to the overall impact, determining 40% of the impact each.
In Figure 20 the life cycle phases for the three configurations are directly compared.
POSTER VIDEO ½ VIDEO – ½ POSTER
-20
0
20
40
60
80
100
120
140
PRE-PRODUCTION +
PRODUCTION
DISTRIBUTION
USE
DISPOSAL
Pt
54. 53
Figure 20 – Comparison of the impacts of the life cycle phases of each configuration.
The impact of the pre-production and production phases changes in relation to the
quantity (weight) and the type (material and manufacturing) of components used. The
video based mounting has the highest impact compared to the others due to the
materials used for the electronic elements (laptop and projector).
The impact of the distribution phase changes in relation to the variation of the
transported global weight. The poster based configuration is the heaviest one and for
this reason the distribution phase of this configuration is the one with the highest
impact.
The impact of the use phase is mainly determined by the electricity consumption. The
significant use of electronic systems for the projections of the concepts of the video
based exhibition determines a substantial rise in the impact of the use phase of this
configuration.
For all the three configurations the processes12
which impact more to the overall impact
are related to the distribution and the use phase. In particular they are:
on road transportation;
electricity consumption in Finland;
electricity consumption in Italy.
From a design point of view, few considerations based on these Life Cycle Assessment
results can already be made.
To reduce the impact of the use phase, that's one of the most relevant for all the
configurations, different design guidelines could be evaluated, such as to design for the
use of more energy efficient electronic and lighting equipment.
12
The electronic components are considered at a system level, not splitting the process further, since the
objective of the TANGO project is not the redesign of those components or to work on the processes used
to produce them.
PRE-PRODUCTION
+ PRODUCTION
DISTRIBUTION USE DISPOSAL
-10
0
10
20
30
40
50
60
70
POSTER
VIDEO
½ VIDEO – ½ POSTER
Pt
55. 54
For example, replacing the 120W incandescent bulbs with 15W LED spots (which have an
equivalent quantity of emitted light), it's possible to obtain a significant impact
reduction for the use phase of the three configurations: about 90% for the poster based;
about 20% for the video based and about 40% for the ½ poster – ½ video based (Figure
21);
Figure 21 – Impact reduction using LED spots instead of incandescent bulbs.
To reduce the energy consumption in the video based and ½ poster – ½ video based
configurations, also more efficient projectors can be considered. For example, by
replacing the 470W UHB projectors with 90W LED ones (which have comparable
functional results), it’s possible to obtain a significant impact reduction for the use
phase: about 55% for the video based configuration and about 40% for the ½ video – ½
poster based one (Figure 22).
Figure 22 – Impact reduction using LED projectors instead of UHB ones.
Another guideline to reduce energy consumption could be to design the exhibition
system in order to better adapt the switching on/off of electronic and lighting
POSTER POSTER
W/LED
LIGHTS
VIDEO VIDEO
W/LED
LIGHTS
½ VIDEO
½ POSTER
½ VIDEO
½ POSTER
W/LED
LIGHTS
-20
0
20
40
60
80
100
120
140
DISPOSAL
USE
DISTRIBUTION
PRE-PRODUCTION +
PRODUCTION
Pt
VIDEO VIDEO
W/LED
PROJECTOR
½ VIDEO ½
POSTER
½ VIDEO ½
POSTER W/
LED PRO-
JECTOR
-20
0
20
40
60
80
100
120
140
DISPOSAL
USE
DISTRIBUTION
PRE-PRODUCTION +
PRODUCTION
Pt
56. 55
equipment to actual audience needs (e.g. at the moment they are turned on 10 hrs/day,
not considering if someone is really visiting the exhibition or not).
Also to reduce the impact of the distribution phase, the other relevant one for every
configuration, different design guidelines can be taken in consideration, such as to
reduce the weight of the equipment to be transported or the need of transportation
tout court, by providing the exhibition elements in each venue, not having the same
equipment travelling across Europe (cf. what it’s already been considered for the video
configuration).
Another guideline to reduce the impact of the distribution phase could be use to design
in order to favour the use of transportation means with a reduced environmental
impact. A reduction of about 75% in the impact of the distribution phase can be
obtained for each configuration, as shown in Figure 23.
Figure 23 – Impact reduction transporting the exhibition by train instead that by truck.
POSTER POSTER
TRAIN
VIDEO VIDEO
TRAIN
½ VIDEO
½ PO-
STER
½ VIDEO
½ PO-
STER
TRAIN
-20
0
20
40
60
80
100
120
140
DISPOSAL
USE
DISTRIBUTION
PRE-PRODUCTION +
PRODUCTION
Pt
57. 56
DETAILED ENVIRONMENTAL IMPACTS OF EACH
OPTION
In the following pages the LCA results of each considered exhibition configuration are
returned, in order to give detailed information about the impact of the single phases,
processes and effects.
POSTER BASED EXHIBITION
Overall impact
The evaluation results show that the contribution of the different life cycle phases is, in
descending order:
1. Distribution: 58,68 Pt
2. Use: 29,13 Pt
3. Pre-Production + Production: 17,1 Pt
4. Disposal: -2,36 Pt
Figure 24 – The environmental impacts of the life cycle phases of the poster based exhibition.
Processes
The three processes which contribute more to the overall life cycle impact are, in
descending order:
1. On road transportation: 58,7 Pt
2. Electricity consumption in Finland: 17,6 Pt
3. Electricity consumption in Italy: 8,88 Pt
4. Aluminium for the exhibition structure: 5,6 Pt
5. Lycra for sheets: 3,07 Pt
6. HDPE for New Jersey bases: 1,72 Pt
7. Aluminium for the exhibition modules joints: 1,43 Pt
PRE-PRODUCTION
+ PRODUCTION
DISTRIBUTION USE DISPOSAL
-10
0
10
20
30
40
50
60
70
Pt
58. 57
VIDEO BASED EXHIBITION
Overall impact
The evaluation results show that the contribution of the different life cycle phases is, in
descending order:
1. Use: 60,32 Pt
2. Pre-Production + Production: 33,5 Pt
3. Distribution: 33,3 Pt
4. Disposal: -1,03Pt
Figure 25 - The environmental impacts of the life cycle phases of the video based exhibition.
Processes
The three processes which contribute more to the overall life cycle impact are, in
descending order:
1. Electricity consumption in Finland: 35,6 Pt
2. On road transportation: 33,3 Pt
3. Electricity consumption in Italy: 19 Pt
4. Aluminium for screen structure tubes: 4 Pt
5. Lycra for sheets: 3,38 Pt
6. Weaving process to produce Lycra sheets: 1,41 Pt
7. Nylon for clamps: 1,3 Pt
The contribution of the pre-production and production of the electronic components to
the overall life cycle impact is:
Laptop computer: 12,2 Pt
Projector: 8,67 Pt
PRE-PRODUCTION
+ PRODUCTION
DISTRIBUTION USE DISPOSAL
-10
0
10
20
30
40
50
60
70
Pt
59. 58
½ VIDEO – ½ POSTER BASED EXHIBITION
Overall impact
The evaluation results show that the contribution of the different life cycle phases is, in
descending order:
1. Distribution: 45,5 Pt
2. Use: 45,7 Pt
3. Pre-Production + Production: 23,9 Pt
4. Disposal: -1,67 Pt
Figure 26 - The environmental impacts of the life cycle phases of the ½ video – ½ poster based exhibition.
Processes
The three processes which contribute more to the overall life cycle impact are, in
descending order:
1. On road transportation: 45,5 Pt
2. Electricity consumption in Finland: 27,6 Pt
3. Electricity consumption in Italy: 13,9Pt
4. Aluminium for modules structure: 4,7 Pt
5. Lycra for sheets: 3,07 Pt
6. Weaving process to produce Lycra sheets: 1,28 Pt
7. HDPE for New Jersey bases: 1,24 Pt
The contribution of the pre-production and production of the electronic components to
the overall life cycle impact is:
Laptop computer: 5,55 Pt
Projector: 3,94 Pt
PRE-PRODUCTION
+ PRODUCTION
DISTRIBUTION USE DISPOSAL
-10
0
10
20
30
40
50
60
70
Pt
61. 60
INTRODUCTION
After having identified the design priorities using the results of the Life Cycle
Assessment, each group of students engaged in the generation of sustainable ideas that,
revised and re-elaborated further, led to the design of a new concept for a travelling
exhibition element/function (cf. the second process in the MPDS).
The main environmental characteristics of the life cycle of each component of the
concept was visualized, facilitating the calculation of the potential environmental
impact of the concept (through a Life Cycle Assessment) and the visualization of its
potential environmental improvements in relation to the correspondent existing element
(cf. the third process in the MPDS).
In the following pages the results of this last phase of the design exercise is summarised
and for each project the following are presented:
a brief description of the designed concept;
a life cycle exploded view, which describes the product in detail, resuming
considerations related to each life cycle phase of each component;
the Multi-strategy radar, including the improvements/worsening of the new
concept in relation to the analyzed product;
a graph showing the comparison of the overall environmental impact of the new
concept and the one of the analyzed one.
The concepts designed by the students are grouped according to the function/functional
unit they designed for.
63. Walking Ballerio
Bowman
Bruschi
Citterio
Cocco Canuda
Saavedra
RENDER
CONCEPT’S DESCRIPTION
The product is characterised by a very simple and essential layout. Being thought for a tour in the
darkness, it doesn’t use electrical energy. It uses instead some dynamo torches.The expository
boards,hung to both sides of the frame, are kept stuck to the cardon board panels by some
magnets. Due to their particular shape, the cardon board is hung on a tight wire between the
aluminium poles. These poles are kept in place by some ABS basement filled with water. Some
shining signal will guide the visitor through the path.
through
the stars
62
64. CONCEPT’S ENVIROMENTAL CHARACTERISTICS
COVER
PP: ABS (35g)
P: Injection
DT: 6384 km
U: 80 times
DM: Recycle
MAGNETS
PP: NdFeB (130g)
P: magnetization
DT: 6384 km
U: 100 times
DM: Reuse
BASE
PP: ABS (5kg), full of
water
P: rotational molding
DT: 6384 km
U: 100 times
DM: Recycle
1 PIPE
PP: Alluminium (1kg),
P: extrusion
DT: 6384 km
U: 100 times
DM: Recycle
2 SUPPORTS
PP: cardboard (5kg)
P: corrugated cardboard
manufacturing
DT: 6384 km
U: 10 times
DM: Recycle
THREAD
PP: steel (1kg)
P: extrusion
DT: 6384 km
U: 100 times
DM: Recycle
63
65. IMPROVEMENT RADAR
LCA COMPARISON
6.Resources conservation
Resources conservation
1. Intensfication
and extension
of the use
Intens./ext.of the use
P: LOW
+ ++ ++ + = +
P: HIGH P: HIGH P: LOW P: NONE P: HIGH
4. Materials’
life extension
Materials’ life extension
2. Materials
reduction
Materials reduction
PRIORITY
H: HIGH
M: MEDIUM
L: LOW
N: NONE
IMPROVEMENT’S
FACTORS
- WORSENING
= NO CHANGE
+ IMPROVEMENT
++ EXCELLENT
IMPROVEMENT
L
H
H
L
H
N
5.Toxicity
reduction
Toxicity reduction
3. Energy reduction
Priority
Improvement’s factors
Energy reduction
64
66. STAND-ino
Airoldi
Beretta
Caprioli
Casiraghi
Cavalleri
Degano
Faverio
RENDER
CONCEPT’S DESCRIPTION
The module is mainly composed of three spring steel tapes that stand tighter because of two
spruce bases. The entire structure is kept in tensions by two crossed steel cables connected with
the bases and placed at the same level. The boards are printed on hard corrugated paper
(1700x1200mm) and hanged on the central arch by a Nylon wire and Metal rings. The lighting
system is composed by six high led technology spots (12W each.) The spots are located on the
external arches and oriented to the central arch.
The environment impact is extremely reduced even in the transportation because arranged on rail.
65
68. IMPROVEMENT RADAR
LCA COMPARISON
6.Resources conservation
Resources conservation
1. Intensfication
and extension
of the use
Intens./ext.of the use
P: LOW
+ + + + = +
P: HIGH P: HIGH P: LOW P: NONE P: HIGH
4. Materials’
life extension
Materials’ life extension
2. Materials
reduction
Materials reduction
PRIORITY
H: HIGH
M: MEDIUM
L: LOW
N: NONE
IMPROVEMENT’S
FACTORS
- WORSENING
= NO CHANGE
+ IMPROVEMENT
++ EXCELLENT
IMPROVEMENT
L
H
H
L
H
N
5.Toxicity
reduction
Toxicity reduction
3. Energy reduction
Priority
Improvement’s factors
Energy reduction
67
70. CONCEPT’S ENVIROMENTAL CHARACTERISTICS
LAMP
PP: PMMA
P: Injection molding
DT: 6384 km
U: 50 exhibits
DM: Recycle
Mass: 1,324 kg
VIEW MASTER
PP: Abs+ PP (0,22 kg)
P: Injection molding
DT: 6384 km
U: 40 exhibits
DM: RSU
VIEW MASTER TIE
PP: steel (0,12 kg)
P: lamination
DT: 6384 km
U: 60 exhibits
DM: recycle
CORRUGATED TUBE
PP: PE (0,203 kg)
P: co-extrusion
DT: 6384 km
U: 10 exhibit
DM: Recycle
SCREWS
PP: steel
P: cold impact extrusion
DT: 6384 km
U: 30 exhibits
DM: recycle
BOTTOM
PP: steel (0,280 kg)
P: extrusion
DT: 6384 km
U: 100 exhibits
DM: recycle
LAMP SUPPORT
PP: steel (1,043 kg)
P: extrusion
DT: 6384 km
U: 100 exhibits
DM: recycle
SUPPORT PIPES
PP: steel (8,412 kg)
P: extrusion
DT: 6384 km
U: 100 exhibits
DM: recycle
CENTRAL PIPE
PP: steel
P: extrusion
DT: 6384 km
U: 100 exhibits
DM: recycle
Mass: 8,181 kg
69
71. IMPROVEMENT RADAR
LCA COMPARISON
6.Resources conservation
Resources conservation
1. Intensfication
and extension
of the use
Intens./ext.of the use
P: LOW
+ + + + = +
P: HIGH P: HIGH P: LOW P: NONE P: HIGH
4. Materials’
life extension
Materials’ life extension
2. Materials
reduction
Materials reduction
PRIORITY
H: HIGH
M: MEDIUM
L: LOW
N: NONE
IMPROVEMENT’S
FACTORS
- WORSENING
= NO CHANGE
+ IMPROVEMENT
++ EXCELLENT
IMPROVEMENT
L
H
H
L
H
N
5.Toxicity
reduction
Toxicity reduction
3. Energy reduction
Priority
Improvement’s factors
Energy reduction
70
72. The Raft
Jona
Pino
Prandolini
Rizzo
Saragossi
Wang
RENDER
CONCEPT’S DESCRIPTION
Two large transparent panels are holding the paper sheets between them, joined together by
screws, illuminated by LED lights from below.
The light will spread between the two panels according to the Total Internal Reflection principle
and will illuminate the paper sheets.
To hold the panels in place are used 4 inflatable, cylindrical shaped, boat buoys. Tied each to the
other with a nylon rope, the buoys are filled with half water and air to make them more stable. At
last, industrial rubber bands are stretched around the entire structure to make it steady and
strong in place.
71
73. DOCK BUOYS(x4)
PP: PVC (1,4 kg)
P: Blow Molding
DT: 6384 km
U: 3 volte
DM: recycling
NYLON THRED
PP: NYLON (0.05 kg)
P: Wire Drawing
DT: 6384 km
U: 3 times
DM: recycling
PANELS (x2)
PP: PMMA (29 kg)
P: EXSTRUSION
DT: 6384 km
U: 3 times
DM: RSU
SCREWS & BOLTS (x2)
PP: Metal (0.01 kg)
P: Turning
DT: 6384 km
U: 3 times
DM: RSU
RUBBER BANDS (X2)
PP: EPDM (0,3 kg)
P: Injection Molding
DT: 6384 km
U: 3 times
DM: recycling
LED LIGHT STRIPE 9W (x1)
PP: PVC (1,4 kg)
P: Blow Molding
DT: 6384 km
U: 3 volte
DM: recycling
CONCEPT’S ENVIROMENTAL CHARACTERISTICS
72
74. IMPROVEMENT RADAR
LCA COMPARISON
6.Resources conservation
Resources conservation
1. Intensfication
and extension
of the use
Intens./ext.of the use
P: LOW
+ + ++ + = +
P: HIGH P: HIGH P: LOW P: NONE P: HIGH
4. Materials’
life extension
Materials’ life extension
2. Materials
reduction
Materials reduction
PRIORITY
H: HIGH
M: MEDIUM
L: LOW
N: NONE
IMPROVEMENT’S
FACTORS
- WORSENING
= NO CHANGE
+ IMPROVEMENT
++ EXCELLENT
IMPROVEMENT
L
H
H
L
H
N
5.Toxicity
reduction
Toxicity reduction
3. Energy reduction
Priority
Improvement’s factors
Energy reduction
Confronto di 1 p '4.TAVOLE CON LYCRA_CV' con 1 p 'NUOVO CONCEPT CV'; Metodo: Eco-indicator 99 (H) V2.07 / Europe EI 99 H/A / P unteggio singolo
Carcinogens Resp. organics Resp. inorganics Climate change
Radiation Ozone layer Ecotoxicity Acidification/ Eutrophication
Land use Minerals Fossil fuels
VCTPECNOCOVOUNVC_ARCYLNOCELOVAT.4
Pt
80
75
70
65
60
55
50
45
40
35
30
25
20
15
10
5
0
73
75. Blum
Loria
Marengoni
Miotti
Nasi
Pina
Pollio
RENDER
CONCEPT’S DESCRIPTION
SNAKE is designed in such a way that allows the exposure of sheets on both sides of the structure.
In this way it is halved the number of modules necessary for the exhibition. For this reason, we
have also changed the lighting system, setting four lamps on two pipes joined to them through
joints (there is a lamp on each ending part of the pipes).
The basement has been changed too: it will be composed by a pedestal in which the vertical pipe
fits and is fixed.
In order to decrease the number of components necessary to realize the structure, we have deci-
ded to create a continuous structure with movable joints and with some vertical pipes in common.
Snake
74
77. IMPROVEMENT RADAR
LCA COMPARISON
6.Resources conservation
Resources conservation
1. Intensfication
and extension
of the use
Intens./ext.of the use
P: LOW
+ ++ ++ + = +
P: HIGH P: HIGH P: LOW P: NONE P: HIGH
4. Materials’
life extension
Materials’ life extension
2. Materials
reduction
Materials reduction
PRIORITY
H: HIGH
M: MEDIUM
L: LOW
N: NONE
IMPROVEMENT’S
FACTORS
- WORSENING
= NO CHANGE
+ IMPROVEMENT
++ EXCELLENT
IMPROVEMENT
L
H
H
L
H
N
5.Toxicity
reduction
Toxicity reduction
3. Energy reduction
Priority
Improvement’s factors
Energy reduction
76
78. Piezoeletric Mancini
Martinetti
Meloda
Merlotti
Piazzesi
Zucchi
RENDER
CONCEPT’S DESCRIPTION
In the final proposal we decided to totally change the structure by defining a minimal one.
We kept the Nylon threads because it seemed to us an elegant and efficient solution to keep up
boards.
PIEZOELECTRIC TILES: These kind of hi-tech tiles (width- 90cm², thickness- 2.5 cm) contains a
piezoelectric layer on the inside able to catch the energy produced by the people walking on it. By
walking two times on the tiles, a person of 60 kg is able to generate 0.5W. Tiles can be easily
installed in the Exhibition’s space.
To increase the production of energy we found interesting to study an interactive way in order to
spur visitors to walk on ours piezoelectric carpets.
By this way all the energy needed for the exhibition is produced by the same people going there to
visit it.
Walk
77
79. CONCEPT’S ENVIROMENTAL CHARACTERISTICS
ALUMINIUM TUBES x6
PP: Aluminium (about 9kg)
P: Cold impact extrusion
D: 6384 km
U: 90 times
DM: 100% recyclable
SCREWS AND BOLTS x4
PP: Reinforcing steel
(0,021kg)
P: Metal working
D: 6384 km
U: 90 times
DM: 100% recyclable
A1 BOARDS x2
PP: Paper+Board (0,26kg)
P: Included in the material
D: 6384 km
U: 3 times
DM: Dismissione mostra
Europa DIS (30% discarica)
T-JOINTS x4
PP: Pvc (0,36kg)
P: Injection moulding
D: 6384 km
U: 90 times
DM: 90% recyclable
CORRUGATED
BOARD x1
PP: Board (4,291kg)
P: Included in
the material
D: 6384 km
U: 48 times
DM: 100% recyclable
NYLON THREADS x2
PP: Nylon (0,02kg)
P: Wire drawing
D: 6384 km
U: 1 time
DM: Dismissione mostra
Europa DIS (30% discarica)
CAPS x6
PP: Pvc (0,24kg)
P: Injection moulding
D: 6384 km
U: 90 times
DM: 90% recyclable
78
80. IMPROVEMENT RADAR
LCA COMPARISON
6.Resources conservation
Resources conservation
1. Intensfication
and extension
of the use
Intens./ext.of the use
P: LOW
+ + + + = +
P: HIGH P: HIGH P: LOW P: NONE P: HIGH
4. Materials’
life extension
Materials’ life extension
2. Materials
reduction
Materials reduction
PRIORITY
H: HIGH
M: MEDIUM
L: LOW
N: NONE
IMPROVEMENT’S
FACTORS
- WORSENING
= NO CHANGE
+ IMPROVEMENT
++ EXCELLENT
IMPROVEMENT
L
H
H
L
H
N
5.Toxicity
reduction
Toxicity reduction
3. Energy reduction
Priority
Improvement’s factors
Energy reduction
79
81. Show Gambino
Goldin
Iannuzzi
Leni
Li
Schiavi
RENDER
CONCEPT’S DESCRIPTION
For the design of the concept we decided to use elements from the world of fishing. In this regard,
we have decided to replace the aluminum tubes with real-bearing rods.
The structure will be modular and adaptable to any type of arrangement, for example, only two
will be enough for an exhibition linear rods. Increase the complexity of the space to set up
backups increase.
Master
80
83. IMPROVEMENT RADAR
LCA COMPARISON
6.Resources conservation
Resources conservation
1. Intensfication
and extension
of the use
Intens./ext.of the use
P: MEDIUM
+ + ++ + = +
P: MEDIUM P: HIGH P: LOW P: NONE P: HIGH
4. Materials’
life extension
Materials’ life extension
2. Materials
reduction
Materials reduction
PRIORITY
H: HIGH
M: MEDIUM
L: LOW
N: NONE
IMPROVEMENT’S
FACTORS
- WORSENING
= NO CHANGE
+ IMPROVEMENT
++ EXCELLENT
IMPROVEMENT
M
M
H
L
H
N
5.Toxicity
reduction
Toxicity reduction
3. Energy reduction
Priority
Improvement’s factors
Energy reduction
82
84. Bender
Belloni
Bertoni
Cappelletti
Caprari
Cattaneo
Cavallini
RENDER
CONCEPT’S DESCRIPTION
Bender is an aluminium sheet that visitors can lift with their hands and feet. Bender lies on the
ground and it is bent so that visitors can lift it: they push a proper fold in the sheet with their feet
and pull the display unit with their arms, in order to watch the tables which are stuck on the unit.
The concept therefore aims to reduce the use of materials and to allow the visitors interaction
with the product.
Bender is made of a cut-and-bend sheet and is used as a lever.
83
85. CONCEPT’S ENVIROMENTAL CHARACTERISTICS
1 Display Unit
Weight: 1,4 kg
Material: RECYCLED ALUMINIUM
Processing: SHEET EXTRUSION, SHEA-
RING, FOLDING
Disposal: RECYCLE
2 Display Unit
Weight: 2 kg
Material: CORRUGATED BOARD,
TWO LAYERS
Processing: CUT
Disposal: RECYCLE
3 Tables
Weight: 0,26 kg
Material: PAPER
Disposal: RECYCLE
4 Lighting
Quantity: 2
Material: POWER LED
Use ratio: 10 h per 21 days
84
86. IMPROVEMENT RADAR
LCA COMPARISON
6.Resources conservation
Resources conservation
1. Intensfication
and extension
of the use
Intens./ext.of the use
P: LOW
+ + ++ + = +
P: HIGH P: HIGH P: LOW P: NONE P: HIGH
4. Materials’
life extension
Materials’ life extension
2. Materials
reduction
Materials reduction
PRIORITY
H: HIGH
M: MEDIUM
L: LOW
N: NONE
IMPROVEMENT’S
FACTORS
- WORSENING
= NO CHANGE
+ IMPROVEMENT
++ EXCELLENT
IMPROVEMENT
L
H
H
L
H
N
5.Toxicity
reduction
Toxicity reduction
3. Energy reduction
Priority
Improvement’s factors
Energy reduction
85
89. IMPROVEMENT RADAR
LCA COMPARISON
6.Resources conservation
Resources conservation
1. Intensfication
and extension
of the use
Intens./ext.of the use
P: MEDIUM
+ ++ + + = +
P: MEDIUM P: HIGH P: LOW P: NONE P: HIGH
4. Materials’
life extension
Materials’ life extension
2. Materials
reduction
Materials reduction
PRIORITY
H: HIGH
M: MEDIUM
L: LOW
N: NONE
IMPROVEMENT’S
FACTORS
- WORSENING
= NO CHANGE
+ IMPROVEMENT
++ EXCELLENT
IMPROVEMENT
M
M
H
L
H
N
5.Toxicity
reduction
Toxicity reduction
3. Energy reduction
Priority
Improvement’s factors
Energy reduction
88
91. Triangle
Acerbi
Avi
Bassani
Bouzin
Ceccotto
Civarci
RENDER
CONCEPT’S DESCRIPTION
The structure is designed to support bilateral projections. A calendered PVC sheet (with black
central layer and white external sheets) is stuck in an aluminum tube (diameter 50 mm with
rubber caps on the ends) and kept taut by an aluminum rod stuck at lower end, and it is supported
at each end by a cardboard sheet structure (thickness 13 mm) bent to form an angle of 60°; the
two "sides" of cardboard (1 m long each) are held in place by two strips of cardboard obtained by
pulling them from pre-cuts on the cardboard sheet itself (the openings thus created can be used to
easily move the structure), positioned into suitably threaded holes in the structure.
90
92. CONCEPT’S ENVIROMENTAL CHARACTERISTICS
ALUMINIUM TUBE
PP: Aluminium (2,8 Kg approx.)
P: Extrusion
DT: 6384 Km
U: 200 times
DM: Recycle
PVC SHEET
PP: 3 layer PVC (5 Kg approx.)
P: Calendering
DT: 6384 Km
U: 200 times
DM: Recycle
CARDBOARD SHEET
PP: Structural cardboard (10 Kg approx.)
P: Cut in form
DT: 6384 Km
U: 3 Exhibitions
DM: Recycle
ALLUMINIUM ROD
PP: Aluminium (1,8 Kg approx.)
P: Extrusion
DT: 6384 Km
U: 200 times
DM: Recycle
RUBBER TUBE ENDS
PP: rubber (100 g approx.)
P: Injection molding
DT: 6384 Km
U: 100 times
DM: Recycle
91
93. IMPROVEMENT RADAR
LCA COMPARISON
6.Resources conservation
Resources conservation
1. Intensfication
and extension
of the use
Intens./ext.of the use
P: LOW
+ + + + = +
P: MEDIUM P: HIGH P: LOW P: NONE P: MEDIUM
4. Materials’
life extension
Materials’ life extension
2. Materials
reduction
Materials reduction
PRIORITY
H: HIGH
M: MEDIUM
L: LOW
N: NONE
IMPROVEMENT’S
FACTORS
- WORSENING
= NO CHANGE
+ IMPROVEMENT
++ EXCELLENT
IMPROVEMENT
L
H
H
L
H
N
5.Toxicity
reduction
Toxicity reduction
3. Energy reduction
Priority
Improvement’s factors
Energy reduction
92
94. Cross Cube
Lucas
Oliveira
Prati
Rebuzzi
Savina
Simonelli
Tedoldi
Vitali
RENDER
CONCEPT’S DESCRIPTION
The structure is a parallelepipedon made of poplar (18x18x14.4 cm)designed to support eight
aluminium tubes (200x2.5 cm) inserted by 10 cm in wood and extending along its diagonals, with
four sheets in lycra fixed at its edges (250x200 cm) thanks to steel rings.
On each face of the parallelepipedon, the sheets create an "X" structure which turns out to be
self-supporting due to the voltage applied by projection sheets.
93
95. CONCEPT’S ENVIROMENTAL CHARACTERISTICS
PIPES
PP: Aluminum
P: extrusion + cut
DT: 6384 km
U: 90 times
DM: Ricycle
CUBE
PP: Poplar (2 Kg)
P: planing + perforation
DT: 6384 Km
U: 45 times
DM: recycle
PROJECTORS
SHEET (x4)
PP: Lycra (2,432 Kg)
P: sewing
DT: 6384 Km
U: 9 times
DM: Dismission
94
96. T RADAR
LCA COMPARISON
6.Resources conservation
Resources conservation
1. Intensfication
and extension
of the use
Intens./ext.of the use
P: LOW
+ + ++ = = +
P: HIGH P: HIGH P: LOW P: NONE P: HIGH
4. Materials’
life extension
Materials’ life extension
2. Materials
reduction
Materials reduction
PRIORITY
H: HIGH
M: MEDIUM
L: LOW
N: NONE
IMPROVEMENT’S
FACTORS
- WORSENING
= NO CHANGE
+ IMPROVEMENT
++ EXCELLENT
IMPROVEMENT
L
H
H
L
H
N
5.Toxicity
reduction
Toxicity reduction
3. Energy reduction
Priority
Improvement’s factors
Energy reduction
95
98. T-Eco
Baldassari
Biancaccio
Carbone
Corbella
Donida Maglio
D’Urbano
RENDER
CONCEPT’S DESCRIPTION
T-eco is a table display showing 3D models.
It is made of birch plywood plane whose held up on four supporting hollow bars in alluminium.
The structure stability is ensured by four bars fitted in the upper part.
Four PLA sheet held up on bars and protect the models. T-eco has a low environment impact due
to the simple components disassembly, the modularity and the recyclable materials used.
97
99. CONCEPT’S ENVIROMENTAL CHARACTERISTICS
STABILITY BARS
PP:ALUMINIUM (~50X4 g)
P:EXTRUSION+
BEND
DT:6384 km
U:200 times
DM:RECYCLE
SCREW HOOKS
PP:STEEL (~5X4 g)
P:EXTRUSION+
THREADING
DT:6384 km
U:200 times
DM:RECYCLE
PLAN
PP:PLYWOOD
DI BIRCH (~4000 g)
P:CUT
DT:6384 km
U:150 times
DM:RECYCLE
CARRIER BAR
PP:ALUMINIUM (~600X4 g)
P:EXTRUSION+
HOLING+WELDING
DT:6384 km
U:200 volte
DM:RECYCLE
FEET
PP:SILYCON (~20X4 g)
P:INJECTION MOLDING
DT:6384 km
U:100 volte
DM:RECYCLE
PROTECTION SHEETS
PP:PLA (~0,5X4 g)
P:ESTRUSIONE
DT:6384 km
U:3 volte
DM:RECYCLE + COMPO-
STING
SPRING HOOKS
PP:ACCIAIO (~3X32
g)
P:ESTRUSIONE+
PIEGATURA
DT:6384 km
U:30 volte
DM:RECYCLE
98
100. IMPROVEMENT RADAR
LCA COMPARISON
6.Resources conservation
Resources conservation
1. Intensfication
and extension
of the use
Intens./ext.of the use
P: LOW
+ ++ ++ + = +
P: HIGH P: HIGH P: LOW P: NONE P: HIGH
4. Materials’
life extension
Materials’ life extension
2. Materials
reduction
Materials reduction
PRIORITY
H: HIGH
M: MEDIUM
L: LOW
N: NONE
IMPROVEMENT’S
FACTORS
- WORSENING
= NO CHANGE
+ IMPROVEMENT
++ EXCELLENT
IMPROVEMENT
L
H
H
L
H
N
5.Toxicity
reduction
Toxicity reduction
3. Energy reduction
Priority
Improvement’s factors
Energy reduction
99
101. Sixty
Locatelli
Marchesi
Monfort
Pucci
Signorelli
RENDER
CONCEPT’S DESCRIPTION
The showcase takes advantage of its special shape to create a psychological barrier between the
viewer and the exhibition showcase itself. This barrier is formed due to the lower body of the
structure, being extended forward, keep the viewer at arm’s lenght; to get it to take models the
viewer should become unbalanced. The presence of other people at the exhibition joined to the
distance imposed by the structure should notlead the viewer to touch the models.
100
102. CONCEPT’S ENVIROMENTAL CHARACTERISTICS
PRESSURE JOINT
STRUCTURAL PIPES
PP: Steel (16KG)
P: Extrusion
DT: 6400km
U: 500
DM: Recycle
SUPPORT PLANE
PP: Wood
P:Circle saw cut
DT:6400km
U:500
DM: Recycle
STRUCTURAL PLANES
PP: Wood
P: Circle saw cut
DT: 6400KM
U: 500
Recycle
V Corner joint has bolts that
are used to fix the tubes
when they’re inserted. The
bolts allow to disassemble.
CORNER JOINTS
PP: Steel (2kg)
P Extrusion Fusion
DT: 6400km
U: 500
DM: Recycle
101
103. IMPROVEMENT RADAR
LCA COMPARISON
6.Resources conservation
Resources conservation
1. Intensfication
and extension
of the use
Intens./ext.of the use
P: LOW
+ + + + = +
P: HIGH P: HIGH P: LOW P: NONE P: HIGH
4. Materials’
life extension
Materials’ life extension
2. Materials
reduction
Materials reduction
PRIORITY
H: HIGH
M: MEDIUM
L: LOW
N: NONE
IMPROVEMENT’S
FACTORS
- WORSENING
= NO CHANGE
+ IMPROVEMENT
++ EXCELLENT
IMPROVEMENT
L
H
H
L
H
N
5.Toxicity
reduction
Toxicity reduction
3. Energy reduction
Priority
Improvement’s factors
Energy reduction
102
104. Tripla-hoop
Ornati
Palmiotti
Pecorari
Rossi
Selvaggi
Silva
RENDER
CONCEPT’S DESCRIPTION
TRIPLA HOOP” display-case can hold 3 different scale models (instead of just 2).
The counter top is made by a cardboard sheet of triangular shape (side= 1 metre circa) with 2
holes next to each angle. These holes allows the intersection of the cardboard sheet with 3 tubes
made in polyethylene.
This tubes are the main structure of the object and each one of them is closed in a ring by a small
rubber tube: this structures is a perfect example of ready made, actually we can use 3 hula hoop
for this purpose, they are easy to found and standard dimensioned (diameter= 1 metre), so that
there could be no need to transport them for the exhibition and they can be given in charity to
primary schools after the end of the exhibition.
103
106. IMPROVEMENT RADAR
LCA COMPARISON
6.Resources conservation
Resources conservation
1. Intensfication
and extension
of the use
Intens./ext.of the use
P: MEDIUM
+ ++ + + = +
P: MEDIUM P: HIGH P: LOW P: NONE P: HIGH
4. Materials’
life extension
Materials’ life extension
2. Materials
reduction
Materials reduction
PRIORITY
H: HIGH
M: MEDIUM
L: LOW
N: NONE
IMPROVEMENT’S
FACTORS
- WORSENING
= NO CHANGE
+ IMPROVEMENT
++ EXCELLENT
IMPROVEMENT
5.Toxicity
reduction
Toxicity reduction
3. Energy reduction
Priority
Improvement’s factors
Energy reduction
L
H
H
L
H
N
105
110. IMPROVEMENT RADAR
LCA COMPARISON
6.Resources conservation
Resources conservation
1. Intensfication
and extension
of the use
Intens./ext.of the use
P: LOW
+ + ++ + = +
P: MEDIUM P: HIGH P: LOW P: NONE P: MEDIUM
4. Materials’
life extension
Materials’ life extension
2. Materials
reduction
Materials reduction
PRIORITY
H: HIGH
M: MEDIUM
L: LOW
N: NONE
IMPROVEMENT’S
FACTORS
- WORSENING
= NO CHANGE
+ IMPROVEMENT
++ EXCELLENT
IMPROVEMENT
M
M
H
L
M
N
5.Toxicity
reduction
Toxicity reduction
3. Energy reduction
Priority
Improvement’s factors
Energy reduction
Confronto di 1 p '1.SEGNALETICA - Base New Jersey_CV' con 1 p 'MODULAIR - CV'; Metodo: Eco-indicator 99 (H) V2.07 / Europe EI 99 H/A / Punteggio sin
Human Health Ecosystem Quality Resources
1.SEGNALETICA
- Base New Jersey
MODULAIR - CV
Pt
15
14
13
12
11
10
9
8
7
6
5
4
3
2
1
0
109
111. Pluma Box
Colaci
Cosco
Costantini
Di Felice
Gandini
Rodrìguez
RENDER
CONCEPT’S DESCRIPTION
The concept is based on the idea of a temporary made-on-site show, which is biodegradable and
recyclable. The starting point is the “american box”, the dominant license in the whole world of
packaging. The idea is based on reusing these boxes once their used, for being able to generate a
preparation, providing the necessary instructions for designers and installers to create a show, to
minimize the costs and the efforts. The boxes will be made out of the waste of the highly
distributed boxes, in our case IKEA, because it has branches in all the three cities, and it allows us
to have boxes with big dimensions (114cm x 91 cm x 106 cm), the quality of the boxes is great and
they are in perfect condition, due to the fact that they do not contain any liquid or perishable
material.
110
112. CONCEPT’S ENVIROMENTAL CHARACTERISTICS
CARDBOAD
PP: Cardboard (0,38 kg)
P: cut
DT: 6384 km
DM: recycling
LED LIGHT
40 watt/h
4 SHEETS
PP: PVC (0,94kg)
P: extrusion plastic film
DT: 6384 km
DM: recycled
INSTRUCTION PAPER
111
113. IMPROVEMENT RADAR
LCA COMPARISON
6.Resources conservation
Resources conservation
1. Intensfication
and extension
of the use
Intens./ext.of the use
P: LOW
+ + ++ + = +
P: MEDIUM P: HIGH P: LOW P: NONE P: MEDIUM
4. Materials’
life extension
Materials’ life extension
2. Materials
reduction
Materials reduction
PRIORITY
H: HIGH
M: MEDIUM
L: LOW
N: NONE
IMPROVEMENT’S
FACTORS
- WORSENING
= NO CHANGE
+ IMPROVEMENT
++ EXCELLENT
IMPROVEMENT
M
M
H
L
M
N
5.Toxicity
reduction
Toxicity reduction
3. Energy reduction
Priority
Improvement’s factors
Energy reduction
112
114. Spider
Frazzini
Forti
Lo Bianco
Longo
Mambrini
Negri
RENDER
CONCEPT’S DESCRIPTION
Spider replaces the current structure, New Jersey, reducing the number of materials used and a
simplifying the transportation.
The New Jersey base has been removed in favor of an alluminium self-supporting framework.
Each unit allows to display two sheets, making possible the use of three supports instead of five.
The simplyfied disassembly allows an easier transport.
113
115. CONCEPT’S ENVIROMENTAL CHARACTERISTICS
BARB
PP: PVC (~0,298 Kg)
P:Iniection moulding
DT: 6384 Km
U: 90 times
DM: recycling
COMBINED JOINT HINGE
DOUBLE IN LINE
PP: Galvanized malleable
cast iron (~1,64 Kg)
P: die casting
DT: 6384 Km
U: 90 times
DM: recycling
PIPE1
PP: Aluminium (~1,6 Kg)
P: Extrusion
DT: 6384 Km
U: 90 volte
DM: Recycling
PIPE 2
PP: Aluminium (~0,9 Kg)
P: Extrusion
DT: 6384 Km
U: 90 volte
DM: Recycling
PIPE 3
P: Extrusion
DT: 6384 Km
U: 90 volte
DM: Recycling
METAL CORE
PP: Iron (~0,0135 Kg)
P: Extrusion
DT: 6384 Km
U: 90 times
DM: Recycling
SHEET
PP: PVC (~0,94 Kg)
P: Extrusion
DT: 6384 Km
U: 18 times
DM: Recycling
114
116. IMPROVEMENT RADAR
LCA COMPARISON
6.Resources conservation
1. Intensfication
and extension
of the use
4. Materials’
life extension
2. Materials
reduction
PRIORITY
H: HIGH
M: MEDIUM
L: LOW
N: NONE
IMPROVEMENT’S
FACTORS
- WORSENING
= NO CHANGE
+ IMPROVEMENT
++ EXCELLENT
IMPROVEMENT
M
M
H
L
M
N
5.Toxicity
reduction
3. Energy reduction
Resources conservationIntens./ext.of the use
P: LOW
+ + + + = +
P: HIGH P: HIGH P: LOW P: NONE P: HIGH
Materials’ life extensionMaterials reduction Toxicity reduction
Priority
Improvement’s factors
Energy reduction
!
115
117. Plotterstein
Hongjun
Mignani
Negri
Poggi
Viganò
Vinto
RENDER
CONCEPT’S DESCRIPTION
The product is a composed of a cardboard sheet which bends in the lower part to give a better
stability.
The entire structure is supported by plotter tubes to be retrieved on-site in the different
universities and cut to build the legs and the protection for the upper and lower part of the sheet.
This way we can reduce the transport impact because the sheets require less space while the
tubes are found on site.
116
119. IMPROVEMENT RADAR
LCA COMPARISON
6.Resources conservation
1. Intensfication
and extension
of the use
4. Materials’
life extension
2. Materials
reduction
PRIORITY
H: HIGH
M: MEDIUM
L: LOW
N: NONE
IMPROVEMENT’S
FACTORS
- WORSENING
= NO CHANGE
+ IMPROVEMENT
++ EXCELLENT
IMPROVEMENT
M
M
H
L
M
N
5.Toxicity
reduction
3. Energy reduction
Resources conservationIntens./ext.of the use
P: LOW
+ + + + = +
P: HIGH P: HIGH P: LOW P: NONE P: HIGH
Materials’ life extensionMaterials reduction Toxicity reduction
Priority
Improvement’s factors
Energy reduction
118
121. CONCEPT’S ENVIROMENTAL CHARACTERISTICS
CUP
PP: ABS (0,06kg)
P: molding
DT: 6384 km
U: 90 times
DM: recycling
FEET
PP: Plywood(0,3kg)
P: cutting
DT: 6384 km
U: 90 times
DM: recycling
PIPE
PP: Alluminium(5,45kg)
P: extrusion
DT: 6384 km
U: 90 times
DM: recycling
ABS
PP: ABS (0,19kg)
P: extrusion
DT: 6384 km
U: 90 times
DM: recycling
SHEET
PP: PVC (0,8kg)
P: cutting, sewing
DT: 6384 km
U: 20 times
DM: composting
ROD
PP: Plywood
(0,29kg)
P: cutting
DT: 6384 km
U: 90 times
DM: recycling
LIGHT
U: 120 Watt x 350h
120
122. IMPROVEMENT RADAR
LCA COMPARISON
6.Resources conservation
Resources conservation
1. Intensfication
and extension
of the use
Intens./ext.of the use
P: LOW
+ ++ + + = +
P: HIGH P: HIGH P: LOW P: NONE P: HIGH
4. Materials’
life extension
Materials’ life extension
2. Materials
reduction
Materials reduction
PRIORITY
H: HIGH
M: MEDIUM
L: LOW
N: NONE
IMPROVEMENT’S
FACTORS
- WORSENING
= NO CHANGE
+ IMPROVEMENT
++ EXCELLENT
IMPROVEMENT
L
H
H
L
H
N
5.Toxicity
reduction
Toxicity reduction
3. Energy reduction
Priority
Improvement’s factors
Energy reduction
121
123. P-Prisma
Boix
Colombo
Cordara
Covello
Dipierro
Fadda
RENDER
CONCEPT’S DESCRIPTION
The project is an informative element easy to use and handly.The body consists in 5 tubes, which
rotate around a central axis and draw a pentagon in the space. Five PVC sheets are inserted in
those elements in order to give informations to the visitors of the exhibition. Phisically the object
reveals linear geometries, and it get better the previous concept by eliminating needless
materials, focusing on the theme of the string. In other words the things the proposal of five
modules with important weights and dimensions is now substituted by one product, which reveals
to be lighter and interesting. Considering the itinerant nature of the exhibition also the transport
is improved.
122
124. CONCEPT’S ENVIROMENTAL CHARACTERISTICS
PIPE (X5)
P: Extusion
DT: 6384 km
U: 90 times
DM: recycle
BAR (X10)
PP: Aliminium
P: EXTRUSION
DT: 6384 km
U: 90 times
DM: Recycle
LENGHT OF CLOTH (X5)
PP: PVC
P: Extrusion
DT:6384 km
U: 18 times
DM: Recycle/RSU*
SHEET (x1)
PP: Nylon
P: Wire drawing
DT: 6384 km
U: 90 times
DM: Recycle
BAND (x1)
PP: Lattice
P: Moulding
DT: 6384 km
U: 90 times
DM: RSU
FEETS(X5)
PP: PA
P: Injection
DT: 6384 km
U: 90 times
DM: Recycle
LIGHT MILANO
U: 4,2 kW/h
LIGHT HELSINKI
U: 12,6 kW/h
LIGHT NANTES
U: 4,2 kW/h
123
125. IMPROVEMENT RADAR
LCA COMPARISON
6.Resources conservation
Resources conservation
1. Intensfication
and extension
of the use
Intens./ext.of the use
P: LOW
+ ++ ++ + = +
P: HIGH P: HIGH P: LOW P: NONE P: HIGH
4. Materials’
life extension
Materials’ life extension
2. Materials
reduction
Materials reduction
PRIORITY
H: HIGH
M: MEDIUM
L: LOW
N: NONE
IMPROVEMENT’S
FACTORS
- WORSENING
= NO CHANGE
+ IMPROVEMENT
++ EXCELLENT
IMPROVEMENT
L
H
H
L
H
N
5.Toxicity
reduction
Toxicity reduction
3. Energy reduction
Priority
Improvement’s factors
Energy reduction
124
126. Baloon
Limatola
Malfatti
Marangoni
Parisi
Pezzella
Pontillo
RENDER
CONCEPT’S DESCRIPTION
A vertical signposting module that consists of a sheet made of a very light material (flag), printed
and supported by a balloon filled with helium, through four nylon threads. The balloon has the
same size of the sheet and is placed behind it; it is anchored to the ground with a recycled plastic
base and it is connected to it through two of the four nylon threads.
Dimensions: 225x80x15 cm; ground clearance: 20 cm
The aim of the project was to lighten the parts and reduce the material needed to realize the
object, in order to minimize the environmental impact of production and transport.
125
128. IMPROVEMENT RADAR
LCA COMPARISON
6.Resources conservation
Resources conservation
1. Intensfication
and extension
of the use
Intens./ext.of the use
P: LOW
+ ++ ++ + = +
P: HIGH P: HIGH P: LOW P: NONE P: HIGH
4. Materials’
life extension
Materials’ life extension
2. Materials
reduction
Materials reduction
PRIORITY
H: HIGH
M: MEDIUM
L: LOW
N: NONE
IMPROVEMENT’S
FACTORS
- WORSENING
= NO CHANGE
+ IMPROVEMENT
++ EXCELLENT
IMPROVEMENT
L
H
H
L
H
N
5.Toxicity
reduction
Toxicity reduction
3. Energy reduction
Priority
Improvement’s factors
Energy reduction
127
129. MONOlith
Galanti
Gaverina
Gao
Grasso
Xu
Yin
Zhang
RENDER
CONCEPT’S DESCRIPTION
Monolith is an exhibitor for signals made of a lightweight and flexible single sheet of low density
polyethylene.
From a bi-dimensional sheet, using creases and tabs, it can be easily reconfigured into a three-
dimensional space object.
Having used a single piece of a single material (there are no joints or additional support) the
product is entirely recyclable.
128
130. The joints are made of simple tabs, the easiest way of joining two different surfaces. The structu-
re is furtherly stiffened by a rib at the top, which allows the display area to remain rigid.
The signal is fixed to the central panel with less complex tabs, which keeps the package "hung".
EXHIBITOR
PP: PE (1,1kg)
P: Extrusion
DT: 6384KM
U: 70 times
DM: Recycle
CONCEPT’S ENVIROMENTAL CHARACTERISTICS
129
131. IMPROVEMENT RADAR
LCA COMPARISON
6.Resources conservation
Resources conservation
1. Intensfication
and extension
of the use
Intens./ext.of the use
P: LOW
+ ++ ++ + = +
P: HIGH P: HIGH P: LOW P: NONE P: HIGH
4. Materials’
life extension
Materials’ life extension
2. Materials
reduction
Materials reduction
PRIORITY
H: HIGH
M: MEDIUM
L: LOW
N: NONE
IMPROVEMENT’S
FACTORS
- WORSENING
= NO CHANGE
+ IMPROVEMENT
++ EXCELLENT
IMPROVEMENT
L
H
H
L
H
N
5.Toxicity
reduction
Toxicity reduction
3. Energy reduction
Priority
Improvement’s factors
Energy reduction
130