IBM SPSS Statistics Subscription (월 구독) 제품 구성
•
0 likes•155 views

IBM 마켓플레이스를 통해 구독하실 수 있는 SPSS Statistics의 제품 구성 브로셔입니다

Recommended
Recommended
More Related Content
Similar to IBM SPSS Statistics Subscription (월 구독) 제품 구성
Similar to IBM SPSS Statistics Subscription (월 구독) 제품 구성 (20)
More from Jin Sol Kim 김진솔
More from Jin Sol Kim 김진솔 (13)
Recently uploaded
Recently uploaded (20)
IBM SPSS Statistics Subscription (월 구독) 제품 구성
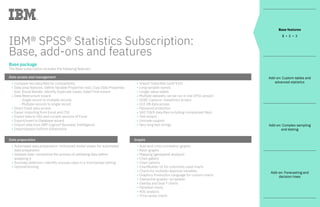
- 1. IBM® SPSS® Statistics Subscription: Base, add-ons and features Base package The Base subscription includes the following features: Data access and management • Compare two data files for compatibility • Data prep features: Define Variable Properties tool; Copy Data Properties tool, Visual Bander, Identify Duplicate Cases; Date/Time wizard • Data Restructure wizard - Single record to multiple records - Multiple records to single record • Direct Excel data access • Easier importing from Excel and CSV • Export data to SAS and current versions of Excel • Export/insert to Database wizard • Import data from IBM Cognos® Business Intelligence • Import/export to/from Dimensions • Import Stata files (until V14) • Long variable names • Longer value labels • Multiple datasets can be run in one SPSS session • ODBC Capture—DataDirect drivers • OLE DB data access • Password protection • SAS 7/8/9 data files including compressed files) • Text wizard • Unicode support • Very long text strings Data preparation • Automated data preparation—enhanced model viewer for automated data preparation • Validate data—streamline the process of validating data before analyzing it • Anomaly detection—identify unusual cases in a multivariate setting • Optimal binning Graphs • Auto and cross correlation graphs • Basic graphs • Mapping (geospatial analysis) • Chart gallery • Chart options • ChartBuilder UI for commonly used charts • Charts for multiple response variables • Graphics Production Language for custom charts • Interactive graphs—scriptable • Overlay and dual Y charts • Panelled charts • ROC analysis • Time series charts Base features 1 • 2 • 3 Add-on: Custom tables and advanced statistics Add-on: Complex sampling and testing Add-on: Forecasting and decision trees
- 2. Output • Case summaries • Style output • Conditional formatting • Codebook • Export charts as Microsoft Graphic Object • Export model as XML to SmartScore • Export to PDF • Export to Word/Excel/PowerPoint • HTML output • Improved performance for large pivot tables • OLAP cubes/pivot tables • Output management system • Output scripting • Reports summaries in rows and columns • Search and replace • Smart devices (tablets and phones) • Table to graph conversion • Web reports Help features • Application examples • Index • Statistics coach • Tutorial • Extensions Data editor enhancements • Custom attributes for user-defined metadata • Spell checker • Splitter controls • Variable sets for wide data • Variable icons Extended programmability • Custom UI builder enhancements (work seamlessly with Python and R and can be used in IBM SPSS Modeler) • New Extensions hub • Custom dialog builder for Extensions • Flow control or syntax jobs • Partial least squares regression • Python, .NET and Java for front-end scripting • SPSS equivalent of the SAS DATA STEP • Support for R algorithms and graphics • User-defined procedures Base features 1 • 2 • 3 Add-on: Custom tables and advanced statistics Add-on: Complex sampling and testing Add-on: Forecasting and decision trees
- 3. Statistics • ANOVA (in syntax only) • Automatic linear models • Cluster • Correlate—bivariate, partial, distances • Crosstabs • Define variable sets • Descriptive ratio statistics (PVA) • Descriptives • Discriminant analysis • Enhanced model viewer on two-step cluster and new nonparametrics • Explore • Factor analysis • Frequencies • Geo-spatial analytics (STP and GSAR) (NEW!) • Improved performance for frequencies, crosstabs, descriptives (Statistics Base Server) • Matrix operations • Means • Monte Carlo simulation • Nearest neighbor analysis • New nonparametric tests • One way ANOVA • Ordinal regression (PLUM) • Ordinary least squares regression • PP plots • QQ plots • Ratio • Reliability and ALSCAL multidimensional scaling • ROC curve • Compare ROC curves • Rule checking on secondary SPC charts • Summarize data • T tests: paired samples, independent samples, one-samples • Two-step cluster: categorical and continuous data/large data sets Multithreaded algorithms • SORT Bootstrapping • Sampling and pooling • Descriptive procedures that can be bootstrapped - Correlations/nonparametric correlations - Crosstabs - Descriptives - Examine - Frequencies - Means - Partial correlations - T tests Base features 1 • 2 • 3 Add-on: Custom tables and advanced statistics Add-on: Complex sampling and testing Add-on: Forecasting and decision trees
- 4. Base features Add-on: Custom tables and advanced statistics Add-on: Complex sampling and testing Add-on: Forecasting and decision trees Add-on: Custom tables and advanced statistics This add-on to the Base subscription includes the following features: Custom tables • 35 descriptive statistics • Drag and drop interface • Inferential statistics • Nested tables • Place totals in any row, column, or layer • Post computed categories • Effective base for weighted sample results • Put multiple variables into the same table • Significance tests on multiple response variables • Significance test in custom tables main table • Significance values for column means and column proportion tests • Specialized multiple response set tables • False discovery correction method for multiple comparisons • Syntax converter ble preview Regression • Binary logistic regression • Logit response models • Multinomial logistic regression • Nonlinear regression • Probit response analysis • Two stage least squares • Weighted least squares • Quantile regression Advanced statistics • Cox regression • General linear modeling (GLM) - General factorial - Multivariate (MANOVA) - Repeated measures - Variance components • Generalized linear models and generalized estimating equations - Gamma regression - Poisson regression - Negative binomial • GENLOG for loglinear and logit • Generalized linear mixed models (GLMM) (ordinal targets included) • Bayesian statistics • Hierarchical loglinear models • Kaplan Meier • Linear mixed-level models (aka hierarchical linear models) • Survival • Variance component estimation
- 5. Add-on: Complex sampling and testing This add-on to the Base subscription includes the following features: Complex samples (CS) • CS Cox regression (also multithreaded) • CS descriptives • CS general linear models • CS logistic regression • CS ordinal regression • CS selection • CS tabulate • Sampling wizard/Analysis Plan wizard Base features Add-on: Custom tables and advanced statistics Add-on: Complex sampling and testing Add-on: Forecasting and decision trees Exact tests • Cochran’s Q test • Contingency coefficient • Cramer’s V • Fisher’s exact test • Somers’ D—symmetric and asymmetric • Friedman test • Gamma • Goodman and Kruskal tau • Jonckheere-Terpstra test • Kappa • Kendall’s coefficient of concordance • Kendall’s tau-b and tau-c • Kruskal-Wallis test • Likelihood ratio test • Linear-by-linear association test • Mann-Whitney U or Wilcoxon rank-sum W test • Marginal homogeneity test • McNemar test • Median test • Pearson Chi-square test • Pearson’s R • Phi • Sign test • Spearman correlation • Uncertainty coefficient—symmetric or asymmetric • Wald-Wolfowitz runs test • Wilcoxon signed-rank test Categories • Correspondence analysis (ANACOR) • Principal components analysis for categorical data (CATPCA; replaces PRINCALS) • Ridge regression, lasso, elastic net (CATREG) • CORRESPONDENCE • Nonlinear canonical correlation (OVERALS) • Multidimensional scaling for individual differences scaling with constraints (PROXSCAL) • Preference scaling (PREFSCAL; multidimensional unfolding) • Multiple correspondence analysis Missing values • Data patterns table • Imputation with means estimation or regression • Listwise and pairwise statistics • Missing patterns table • Multiple imputation of missing data • Pooling Conjoint • Estimate utilities (CONJOINT) • For conjoint analysis (ORTHOPLAN) • PLANCARDS
- 6. Add-on: Forecasting and decision trees This add-on to the Base subscription includes the following features: Decision trees • C&RT • CHAID • Exhaustive CHAID • QUEST Forecasting • Auto regressive integrated moving average • Autoregression • Expert modeler exponential smoothing methods • Forecast multiple series (outcomes) at once • Temporal causal modeling • Seasonal decomposition • Spectral analysis Neural networks • Multilayer perception • Radial basis function Direct marketing • Cluster analysis • Contact profiling • Control package test • Propensity to purchase • RFM analysis: recency, frequency, monetary • Zip code response Base features Add-on: Custom tables and advanced statistics Add-on: Complex sampling and testing Add-on: Forecasting and decision trees
- 7. Base features Add-on: Custom tables and advanced statistics Add-on: Complex sampling and testing Add-on: Forecasting and decision trees © Copyright IBM Corporation 2018 IBM Corporation New Orchard Road Armonk, NY 10504 Produced in the United States of America November 2018 IBM, the IBM logo, ibm.com, Cognos and SPSS are trademarks of International Business Machines Corp., registered in many jurisdictions worldwide. Other product and service names might be trademarks of IBM or other companies. A current list of IBM trademarks is available on the web at “Copyright and trademark information” at ibm.com/legal/copytrade.shtml Microsoft, Windows, Windows NT, and the Windows logo are trademarks of Microsoft Corporation in the United States, other countries, or both. Java and all Java-based trademarks and logos are trademarks or registered trademarks of Oracle and/or its affiliates. This document is current as of the initial date of publication and may be changed by IBM at any time. Not all offerings are available in every country in which IBM operates. THE INFORMATION IN THIS DOCUMENT IS PROVIDED “AS IS” WITHOUT ANY WARRANTY, EXPRESS OR IMPLIED, INCLUDING WITHOUT ANY WARRANTIES OF MERCHANTABILITY, FITNESS FOR A PARTICULAR PURPOSE AND ANY WARRANTY OR CONDITION OF NON-INFRINGEMENT. IBM products are warranted according to the terms and conditions of the agreements under which they are provided. 92022092USEN-01