Download to read offline

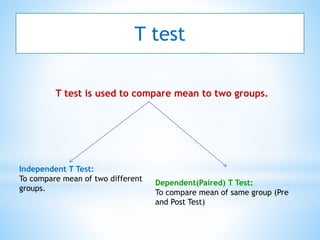
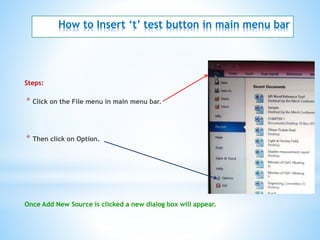
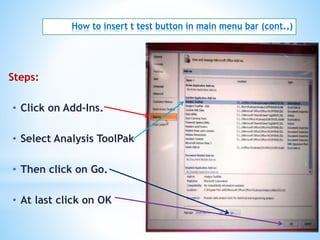
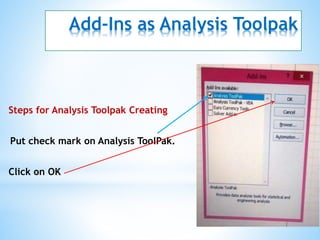
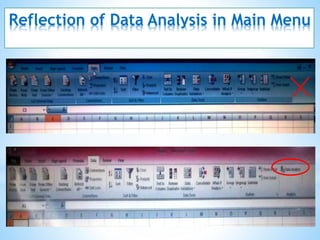
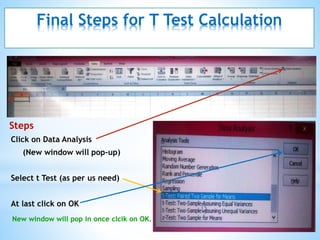
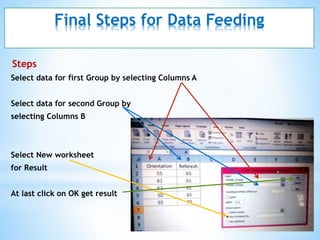
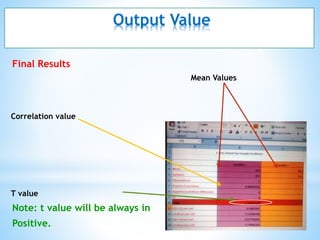


The document discusses how to add a t-test button to the Excel main menu bar to perform t-tests. It provides steps to add the Analysis ToolPak add-in, which will make the t-test options available. It then outlines the steps to run independent and paired t-tests, including selecting the data, choosing the appropriate t-test, and interpreting the output values such as the means, correlation, and t-value.


![Psychodiagnostic technique[1]](https://cdn.slidesharecdn.com/ss_thumbnails/psychodiagnostictechnique1-191031121907-thumbnail.jpg?width=640&height=640&fit=bounds)


