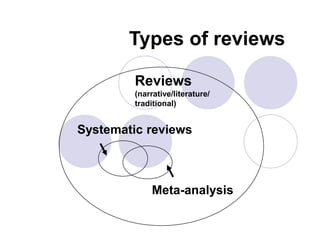
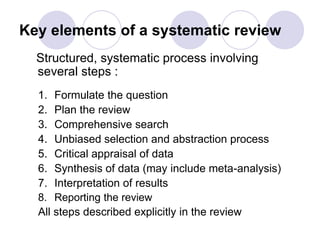
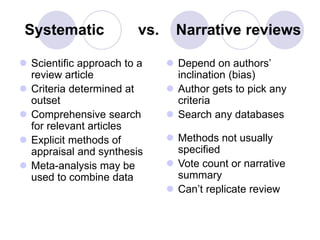
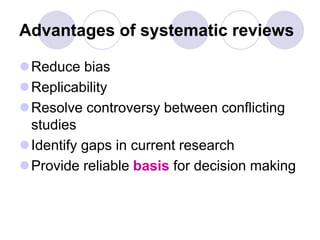
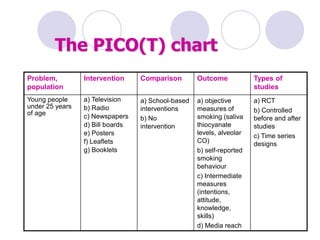
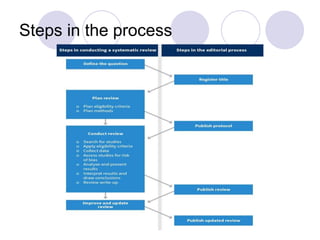
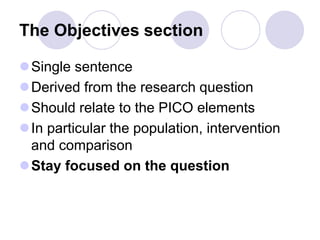
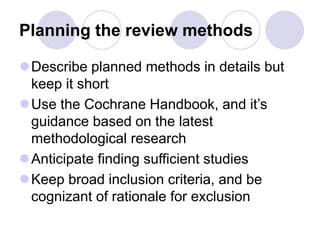
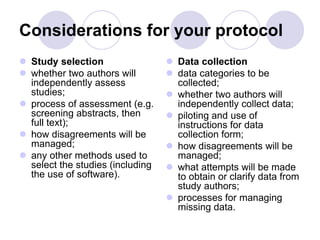
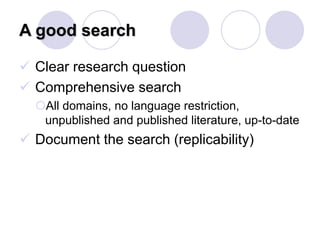
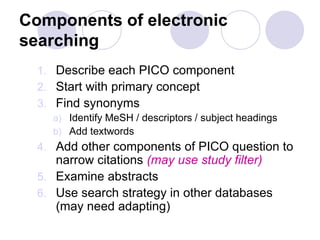
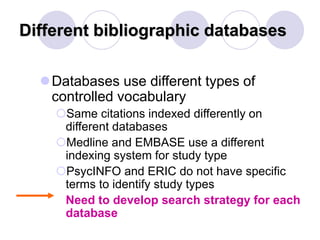
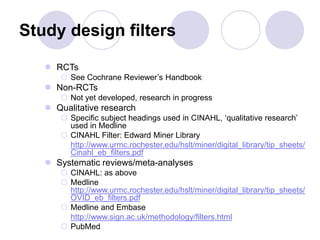
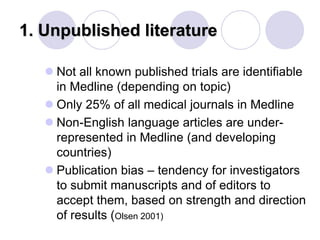
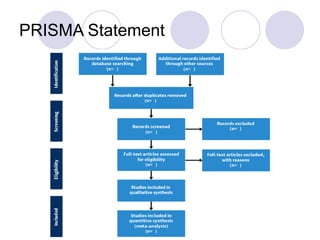
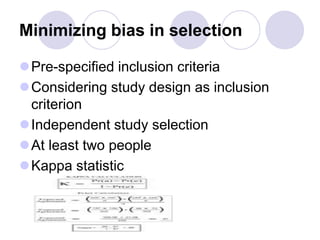
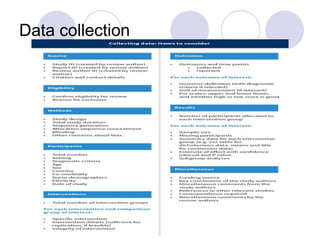
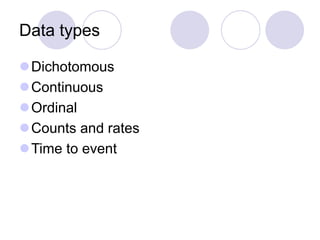
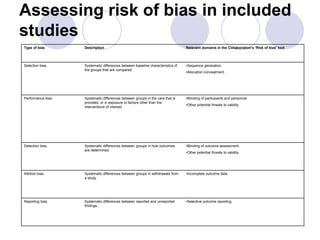
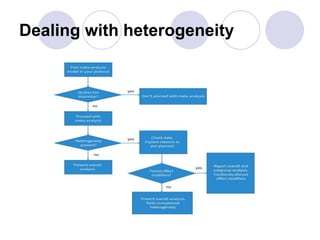
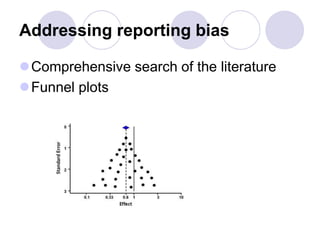
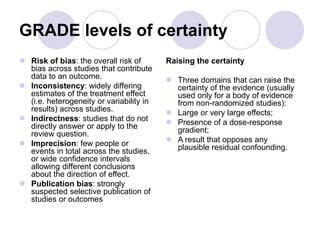
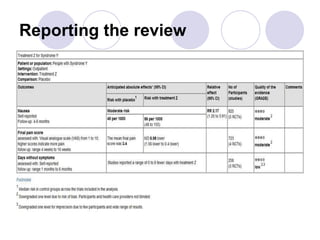
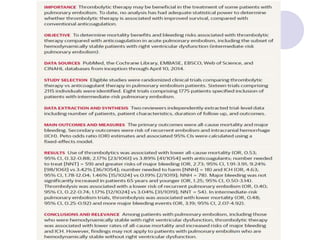
Systematic Reviews and Meta-
analysis 101
Saurav Chatterjee MD
Disclosures
None
Overview-
https://training.cochrane.org/intera
ctivelearning
• Introduction to conducting systematic reviews
• Writing the review protocol
• Searching for studies
• Selecting studies and collecting data
• Introduction to study quality and risk of bias
• Analysing the data
• Interpreting the findings
• Reporting the review
Meta-analysis
Systematic reviews
Reviews
(narrative/literature/
traditional)
Types of reviews
Narrative reviews
Usually written by experts in the field
Use informal and subjective methods to
collect and interpret information
Usually narrative summaries of the
evidence
Read: Klassen et al. Guides for Reading and Interpreting Systematic
Reviews. Arch Pediatr Adolesc Med 1998;152:700-704.
What is a systematic review?
A review of the evidence on a clearly
formulated question that uses systematic
and explicit methods to identify, select
and critically appraise relevant primary
research, and to extract and analyse data
from the studies that are included in the
review*
*Undertaking Systematic Reviews of Research on Effectiveness. CRD’s Guidance for those Carrying Out or
Commissioning Reviews. CRD Report Number 4 (2nd Edition). NHS Centre for Reviews and Dissemination,
University of York. March 2001.
Key elements of a systematic review
Structured, systematic process involving
several steps :
1. Formulate the question
2. Plan the review
3. Comprehensive search
4. Unbiased selection and abstraction process
5. Critical appraisal of data
6. Synthesis of data (may include meta-analysis)
7. Interpretation of results
8. Reporting the review
All steps described explicitly in the review
Systematic vs. Narrative reviews
 Scientific approach to a
review article
 Criteria determined at
outset
 Comprehensive search
for relevant articles
 Explicit methods of
appraisal and synthesis
 Meta-analysis may be
used to combine data
 Depend on authors’
inclination (bias)
 Author gets to pick any
criteria
 Search any databases
 Methods not usually
specified
 Vote count or narrative
summary
 Can’t replicate review
Advantages of systematic reviews
Reduce bias
Replicability
Resolve controversy between conflicting
studies
Identify gaps in current research
Provide reliable basis for decision making
Limitations of systematic reviews
Results may still be inconclusive
There may be no trials/evidence
The trials may be of poor quality
The intervention may be too complex to be
tested by a trial
Practice does not change just because
you have the evidence of
effect/effectiveness
Asking an answerable
question
Types of review questions
Intervention review
Diagnostic test accuracy review
Prognostic review
Methodological review
Qualitative review
Questions of interest
Effectiveness:
 Does the intervention work/not work?
 Who does it work/not work for?
Other important questions:
 How does the intervention work?
 Is the intervention appropriate?
 Is the intervention feasible?
 Is the intervention and comparison relevant?
Answerable questions
EFFECTIVENESS
A description of the populations P
An identified intervention I
An explicit comparison C
Relevant outcomes O
A PICO question
Time-consuming question:
What is the best strategy to prevent smoking
in young people?
An answerable question
Q. Are mass media (or school-based or
community-based) interventions effective in
preventing smoking in young people?
Problem,
population
Intervention Comparison Outcome Types of
studies
Young people
under 25 years
of age
a) Television
b) Radio
c) Newspapers
d) Bill boards
e) Posters
f) Leaflets
g) Booklets
a) School-based
interventions
b) No
intervention
a) objective
measures of
smoking (saliva
thiocyanate
levels, alveolar
CO)
b) self-reported
smoking
behaviour
c) Intermediate
measures
(intentions,
attitude,
knowledge,
skills)
d) Media reach
a) RCT
b) Controlled
before and after
studies
c) Time series
designs
The PICO(T) chart
Finding the evidence
Steps in the process
Writing the review protocol
Ensuring transparency
Ensuring accountability
Avoiding duplication-PROSPERO
Writing the Background section of
the protocol
The Background section of the protocol
should put your review in the context of
what you already know, and the questions
you want to answer.
The Objectives section
Single sentence
Derived from the research question
Should relate to the PICO elements
In particular the population, intervention
and comparison
Stay focused on the question
Planning the review methods
Describe planned methods in details but
keep it short
Use the Cochrane Handbook, and it’s
guidance based on the latest
methodological research
Anticipate finding sufficient studies
Keep broad inclusion criteria, and be
cognizant of rationale for exclusion
Considerations for your protocol
 Study selection
 whether two authors will
independently assess
studies;
 process of assessment (e.g.
screening abstracts, then
full text);
 how disagreements will be
managed;
 any other methods used to
select the studies (including
the use of software).
 Data collection
 data categories to be
collected;
 whether two authors will
independently collect data;
 piloting and use of
instructions for data
collection form;
 how disagreements will be
managed;
 what attempts will be made
to obtain or clarify data from
study authors;
 processes for managing
missing data.
Systematic review process
1. Well formulated question
2. Comprehensive data search
3. Unbiased selection and abstraction process
4. Critical appraisal of data
5. Synthesis of data
6. Interpretation of results
A good search
 Clear research question
 Comprehensive search
All domains, no language restriction,
unpublished and published literature, up-to-date
 Document the search (replicability)
Components of electronic
searching
1. Describe each PICO component
2. Start with primary concept
3. Find synonyms
a) Identify MeSH / descriptors / subject headings
b) Add textwords
4. Add other components of PICO question to
narrow citations (may use study filter)
5. Examine abstracts
6. Use search strategy in other databases
(may need adapting)
So you want to do a ‘quick & dirty’?
 DARE
 CENTRAL
 PubMed (clinical queries, related records)
 CDC
 NICE
 Organisations who do work in your area
 References
 GOOGLE!!!!
Different bibliographic databases
Databases use different types of
controlled vocabulary
Same citations indexed differently on
different databases
Medline and EMBASE use a different
indexing system for study type
PsycINFO and ERIC do not have specific
terms to identify study types
Need to develop search strategy for each
database
Study design filters
 RCTs
 See Cochrane Reviewer’s Handbook
 Non-RCTs
 Not yet developed, research in progress
 Qualitative research
 Specific subject headings used in CINAHL, ‘qualitative research’
used in Medline
 CINAHL Filter: Edward Miner Library
http://www.urmc.rochester.edu/hslt/miner/digital_library/tip_sheets/
Cinahl_eb_filters.pdf
 Systematic reviews/meta-analyses
 CINAHL: as above
 Medline
http://www.urmc.rochester.edu/hslt/miner/digital_library/tip_sheets/
OVID_eb_filters.pdf
 Medline and Embase
http://www.sign.ac.uk/methodology/filters.html
 PubMed
1. Unpublished literature
 Not all known published trials are identifiable
in Medline (depending on topic)
 Only 25% of all medical journals in Medline
 Non-English language articles are under-
represented in Medline (and developing
countries)
 Publication bias – tendency for investigators
to submit manuscripts and of editors to
accept them, based on strength and direction
of results (Olsen 2001)
2. Unpublished literature
Hand searching of key journals and
conference proceedings
Scanning bibliographies/reference lists
of primary studies and reviews
Contacting individuals/agencies/
academic institutions
Neglecting certain sources may result in
reviews being biased
Sources
Managing the references
Endnote
Zotero, etc
Organize your search results, and to
identify and remove any duplicate
Reasons for exclusion
Importing references to analytic software
Librarians are your friends!
Searching for relevant studies
Enlist help of librarian/information
specialist
Broadly inclusive strategy
Cochrane resources-
https://training.cochrane.org/interactivelear
ning/modules/672/course/en/assets/531c8
17131d01f30b8c9be2e27411d417937dd2
6.pdf
Selecting studies
Keep accurate records and track
give a summary of the total number of
records identified in your search
identify the number excluded at each
stage of the screening process
provide reasons for any articles excluded
when assessed in full text
present a PRISMA flow diagram.
Keeping records complete
PRISMA Statement
Minimizing bias in selection
Pre-specified inclusion criteria
Considering study design as inclusion
criterion
Independent study selection
At least two people
Kappa statistic
Data collection
Data types
Dichotomous
Continuous
Ordinal
Counts and rates
Time to event
Assessing risk of bias in included
studies
Type of bias Description Relevant domains in the Collaboration’s ‘Risk of bias’ tool
Selection bias. Systematic differences between baseline characteristics of
the groups that are compared.
•Sequence generation.
•Allocation concealment.
Performance bias. Systematic differences between groups in the care that is
provided, or in exposure to factors other than the
interventions of interest.
•Blinding of participants and personnel.
•Other potential threats to validity.
Detection bias. Systematic differences between groups in how outcomes
are determined.
•Blinding of outcome assessment.
•Other potential threats to validity.
Attrition bias. Systematic differences between groups in withdrawals from
a study.
•Incomplete outcome data
Reporting bias. Systematic differences between reported and unreported
findings.
•Selective outcome reporting
Bias due to missing data
Type of missing data
Reason for missing data
Intention to treat analysis
Address with-
Sensitivity analysis
Leave-one-out analysis
Imputed data
Analyzing the data
‘Doing a meta-analysis is easy, doing one
well is hard.’
Three of the most common effect
measures for a dichotomous outcome are:
risk ratios (also known as relative risk);
odds ratios;
risk difference (also known as absolute
risk reduction).
Risk ratio
To calculate the risk ratio (RR), take the
risk in the intervention group, and divide it
by the risk in the control group.
Risk is calculated by dividing the number
of events by the total number of people in
a group.
Odds ratio
The odds ratio (OR) takes the odds of an
event in the intervention group, and
divides them by the odds in the control
group.
Odds are calculated by dividing the
number of events by the number of non-
events.
Risk difference
RD is an absolute measure, giving you the
absolute difference between the risks in
each group.
Assess risk (events/total no. of population)
in the intervention group, and subtract the
risk in the control group.
Combining the data
Step 1: Identify comparisons
Pairwise comparisons
Step 2: Identify outcomes and effect
measures
Step 3: Collect data from each relevant
study
Step 4: Combine the results to obtain the
summary of effect
Step 5: Choosing a statistical method
Heterogeneity
 Heterogeneity means variation or differences
across studies.
 clinical;
 methodological;
 statistical.
 There are three tools you can use to identify
heterogeneity:
 a visual inspection of the forest plot;
 the Chi-squared (χ2, or Chi2) test, otherwise known
as the Q test;
 the I2 statistic.
Dealing with heterogeneity
Subgroup analysis
 Sensitivity analysis vs Subgroup analysis
 First, while some sensitivity analyses might
analyse a subgroup of studies, they do not attempt
to estimate the effect of the intervention in the
excluded studies. In subgroup analyses, estimates
are produced for each subgroup.
 Second, in sensitivity analyses, informal
comparisons are made between different ways of
estimating the same thing, whereas in subgroup
analyses, formal statistical comparisons are made
between the subgroups.
Studies with more than two groups
Focus on relevant interventions
Shared control group
Combined intervention arms
Three separate analyses
Network meta-analysis
OBTAIN STATISTICAL HELP
Interpreting confidence intervals
Results of meta-analyses (and individual
studies) are reported with a point estimate
and a confidence interval (CI), which is a
measure of the uncertainty inherent in any
estimate.
Reporting bias
Addressing reporting bias
Comprehensive search of the literature
Funnel plots
GRADE levels of certainty
 Risk of bias: the overall risk of
bias across studies that contribute
data to an outcome.
 Inconsistency: widely differing
estimates of the treatment effect
(i.e. heterogeneity or variability in
results) across studies.
 Indirectness: studies that do not
directly answer or apply to the
review question.
 Imprecision: few people or
events in total across the studies,
or wide confidence intervals
allowing different conclusions
about the direction of effect.
 Publication bias: strongly
suspected selective publication of
studies or outcomes
Raising the certainty
 Three domains that can raise the
certainty of the evidence (usually
used only for a body of evidence
from non-randomized studies):
 Large or very large effects;
 Presence of a dose-response
gradient;
 A result that opposes any
plausible residual confounding.
Reporting the review
Working example
Thank you!

مراجعة الأدبيات المنهجيةsystematic literature review .ppt

  • 1.
    Systematic Reviews andMeta- analysis 101 Saurav Chatterjee MD
  • 2.
  • 3.
    Overview- https://training.cochrane.org/intera ctivelearning • Introduction toconducting systematic reviews • Writing the review protocol • Searching for studies • Selecting studies and collecting data • Introduction to study quality and risk of bias • Analysing the data • Interpreting the findings • Reporting the review
  • 4.
  • 5.
    Narrative reviews Usually writtenby experts in the field Use informal and subjective methods to collect and interpret information Usually narrative summaries of the evidence Read: Klassen et al. Guides for Reading and Interpreting Systematic Reviews. Arch Pediatr Adolesc Med 1998;152:700-704.
  • 6.
    What is asystematic review? A review of the evidence on a clearly formulated question that uses systematic and explicit methods to identify, select and critically appraise relevant primary research, and to extract and analyse data from the studies that are included in the review* *Undertaking Systematic Reviews of Research on Effectiveness. CRD’s Guidance for those Carrying Out or Commissioning Reviews. CRD Report Number 4 (2nd Edition). NHS Centre for Reviews and Dissemination, University of York. March 2001.
  • 7.
    Key elements ofa systematic review Structured, systematic process involving several steps : 1. Formulate the question 2. Plan the review 3. Comprehensive search 4. Unbiased selection and abstraction process 5. Critical appraisal of data 6. Synthesis of data (may include meta-analysis) 7. Interpretation of results 8. Reporting the review All steps described explicitly in the review
  • 8.
    Systematic vs. Narrativereviews  Scientific approach to a review article  Criteria determined at outset  Comprehensive search for relevant articles  Explicit methods of appraisal and synthesis  Meta-analysis may be used to combine data  Depend on authors’ inclination (bias)  Author gets to pick any criteria  Search any databases  Methods not usually specified  Vote count or narrative summary  Can’t replicate review
  • 9.
    Advantages of systematicreviews Reduce bias Replicability Resolve controversy between conflicting studies Identify gaps in current research Provide reliable basis for decision making
  • 10.
    Limitations of systematicreviews Results may still be inconclusive There may be no trials/evidence The trials may be of poor quality The intervention may be too complex to be tested by a trial Practice does not change just because you have the evidence of effect/effectiveness
  • 11.
  • 12.
    Types of reviewquestions Intervention review Diagnostic test accuracy review Prognostic review Methodological review Qualitative review
  • 13.
    Questions of interest Effectiveness: Does the intervention work/not work?  Who does it work/not work for? Other important questions:  How does the intervention work?  Is the intervention appropriate?  Is the intervention feasible?  Is the intervention and comparison relevant?
  • 14.
    Answerable questions EFFECTIVENESS A descriptionof the populations P An identified intervention I An explicit comparison C Relevant outcomes O
  • 15.
    A PICO question Time-consumingquestion: What is the best strategy to prevent smoking in young people?
  • 16.
    An answerable question Q.Are mass media (or school-based or community-based) interventions effective in preventing smoking in young people?
  • 17.
    Problem, population Intervention Comparison OutcomeTypes of studies Young people under 25 years of age a) Television b) Radio c) Newspapers d) Bill boards e) Posters f) Leaflets g) Booklets a) School-based interventions b) No intervention a) objective measures of smoking (saliva thiocyanate levels, alveolar CO) b) self-reported smoking behaviour c) Intermediate measures (intentions, attitude, knowledge, skills) d) Media reach a) RCT b) Controlled before and after studies c) Time series designs The PICO(T) chart
  • 19.
  • 20.
    Steps in theprocess
  • 21.
    Writing the reviewprotocol Ensuring transparency Ensuring accountability Avoiding duplication-PROSPERO
  • 22.
    Writing the Backgroundsection of the protocol The Background section of the protocol should put your review in the context of what you already know, and the questions you want to answer.
  • 23.
    The Objectives section Singlesentence Derived from the research question Should relate to the PICO elements In particular the population, intervention and comparison Stay focused on the question
  • 24.
    Planning the reviewmethods Describe planned methods in details but keep it short Use the Cochrane Handbook, and it’s guidance based on the latest methodological research Anticipate finding sufficient studies Keep broad inclusion criteria, and be cognizant of rationale for exclusion
  • 25.
    Considerations for yourprotocol  Study selection  whether two authors will independently assess studies;  process of assessment (e.g. screening abstracts, then full text);  how disagreements will be managed;  any other methods used to select the studies (including the use of software).  Data collection  data categories to be collected;  whether two authors will independently collect data;  piloting and use of instructions for data collection form;  how disagreements will be managed;  what attempts will be made to obtain or clarify data from study authors;  processes for managing missing data.
  • 26.
    Systematic review process 1.Well formulated question 2. Comprehensive data search 3. Unbiased selection and abstraction process 4. Critical appraisal of data 5. Synthesis of data 6. Interpretation of results
  • 27.
    A good search Clear research question  Comprehensive search All domains, no language restriction, unpublished and published literature, up-to-date  Document the search (replicability)
  • 28.
    Components of electronic searching 1.Describe each PICO component 2. Start with primary concept 3. Find synonyms a) Identify MeSH / descriptors / subject headings b) Add textwords 4. Add other components of PICO question to narrow citations (may use study filter) 5. Examine abstracts 6. Use search strategy in other databases (may need adapting)
  • 29.
    So you wantto do a ‘quick & dirty’?  DARE  CENTRAL  PubMed (clinical queries, related records)  CDC  NICE  Organisations who do work in your area  References  GOOGLE!!!!
  • 30.
    Different bibliographic databases Databasesuse different types of controlled vocabulary Same citations indexed differently on different databases Medline and EMBASE use a different indexing system for study type PsycINFO and ERIC do not have specific terms to identify study types Need to develop search strategy for each database
  • 31.
    Study design filters RCTs  See Cochrane Reviewer’s Handbook  Non-RCTs  Not yet developed, research in progress  Qualitative research  Specific subject headings used in CINAHL, ‘qualitative research’ used in Medline  CINAHL Filter: Edward Miner Library http://www.urmc.rochester.edu/hslt/miner/digital_library/tip_sheets/ Cinahl_eb_filters.pdf  Systematic reviews/meta-analyses  CINAHL: as above  Medline http://www.urmc.rochester.edu/hslt/miner/digital_library/tip_sheets/ OVID_eb_filters.pdf  Medline and Embase http://www.sign.ac.uk/methodology/filters.html  PubMed
  • 32.
    1. Unpublished literature Not all known published trials are identifiable in Medline (depending on topic)  Only 25% of all medical journals in Medline  Non-English language articles are under- represented in Medline (and developing countries)  Publication bias – tendency for investigators to submit manuscripts and of editors to accept them, based on strength and direction of results (Olsen 2001)
  • 33.
    2. Unpublished literature Handsearching of key journals and conference proceedings Scanning bibliographies/reference lists of primary studies and reviews Contacting individuals/agencies/ academic institutions Neglecting certain sources may result in reviews being biased
  • 34.
  • 35.
    Managing the references Endnote Zotero,etc Organize your search results, and to identify and remove any duplicate Reasons for exclusion Importing references to analytic software
  • 36.
  • 37.
    Searching for relevantstudies Enlist help of librarian/information specialist Broadly inclusive strategy Cochrane resources- https://training.cochrane.org/interactivelear ning/modules/672/course/en/assets/531c8 17131d01f30b8c9be2e27411d417937dd2 6.pdf
  • 38.
    Selecting studies Keep accuraterecords and track give a summary of the total number of records identified in your search identify the number excluded at each stage of the screening process provide reasons for any articles excluded when assessed in full text present a PRISMA flow diagram. Keeping records complete
  • 39.
  • 40.
    Minimizing bias inselection Pre-specified inclusion criteria Considering study design as inclusion criterion Independent study selection At least two people Kappa statistic
  • 41.
  • 42.
  • 43.
    Assessing risk ofbias in included studies Type of bias Description Relevant domains in the Collaboration’s ‘Risk of bias’ tool Selection bias. Systematic differences between baseline characteristics of the groups that are compared. •Sequence generation. •Allocation concealment. Performance bias. Systematic differences between groups in the care that is provided, or in exposure to factors other than the interventions of interest. •Blinding of participants and personnel. •Other potential threats to validity. Detection bias. Systematic differences between groups in how outcomes are determined. •Blinding of outcome assessment. •Other potential threats to validity. Attrition bias. Systematic differences between groups in withdrawals from a study. •Incomplete outcome data Reporting bias. Systematic differences between reported and unreported findings. •Selective outcome reporting
  • 44.
    Bias due tomissing data Type of missing data Reason for missing data Intention to treat analysis Address with- Sensitivity analysis Leave-one-out analysis Imputed data
  • 45.
    Analyzing the data ‘Doinga meta-analysis is easy, doing one well is hard.’ Three of the most common effect measures for a dichotomous outcome are: risk ratios (also known as relative risk); odds ratios; risk difference (also known as absolute risk reduction).
  • 46.
    Risk ratio To calculatethe risk ratio (RR), take the risk in the intervention group, and divide it by the risk in the control group. Risk is calculated by dividing the number of events by the total number of people in a group.
  • 47.
    Odds ratio The oddsratio (OR) takes the odds of an event in the intervention group, and divides them by the odds in the control group. Odds are calculated by dividing the number of events by the number of non- events.
  • 48.
    Risk difference RD isan absolute measure, giving you the absolute difference between the risks in each group. Assess risk (events/total no. of population) in the intervention group, and subtract the risk in the control group.
  • 49.
    Combining the data Step1: Identify comparisons Pairwise comparisons Step 2: Identify outcomes and effect measures Step 3: Collect data from each relevant study Step 4: Combine the results to obtain the summary of effect Step 5: Choosing a statistical method
  • 50.
    Heterogeneity  Heterogeneity meansvariation or differences across studies.  clinical;  methodological;  statistical.  There are three tools you can use to identify heterogeneity:  a visual inspection of the forest plot;  the Chi-squared (χ2, or Chi2) test, otherwise known as the Q test;  the I2 statistic.
  • 51.
  • 52.
    Subgroup analysis  Sensitivityanalysis vs Subgroup analysis  First, while some sensitivity analyses might analyse a subgroup of studies, they do not attempt to estimate the effect of the intervention in the excluded studies. In subgroup analyses, estimates are produced for each subgroup.  Second, in sensitivity analyses, informal comparisons are made between different ways of estimating the same thing, whereas in subgroup analyses, formal statistical comparisons are made between the subgroups.
  • 53.
    Studies with morethan two groups Focus on relevant interventions Shared control group Combined intervention arms Three separate analyses Network meta-analysis OBTAIN STATISTICAL HELP
  • 54.
    Interpreting confidence intervals Resultsof meta-analyses (and individual studies) are reported with a point estimate and a confidence interval (CI), which is a measure of the uncertainty inherent in any estimate.
  • 55.
  • 56.
    Addressing reporting bias Comprehensivesearch of the literature Funnel plots
  • 57.
    GRADE levels ofcertainty  Risk of bias: the overall risk of bias across studies that contribute data to an outcome.  Inconsistency: widely differing estimates of the treatment effect (i.e. heterogeneity or variability in results) across studies.  Indirectness: studies that do not directly answer or apply to the review question.  Imprecision: few people or events in total across the studies, or wide confidence intervals allowing different conclusions about the direction of effect.  Publication bias: strongly suspected selective publication of studies or outcomes Raising the certainty  Three domains that can raise the certainty of the evidence (usually used only for a body of evidence from non-randomized studies):  Large or very large effects;  Presence of a dose-response gradient;  A result that opposes any plausible residual confounding.
  • 58.
  • 59.
  • 73.