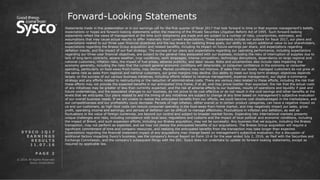
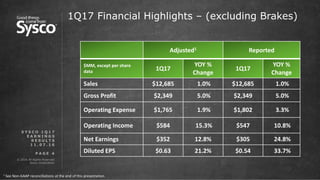
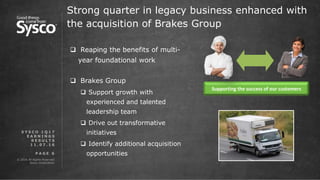
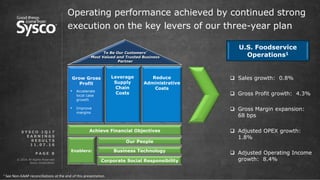
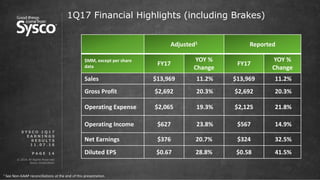
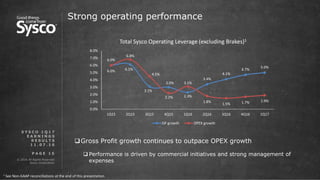
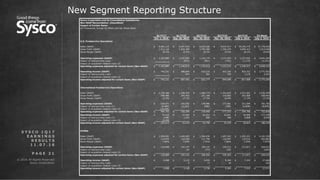
Sysco 1Q17 Earnings Results
November 7, 2016
© 2016 All Rights Reserved.
Sysco Corporation.
P A G E 2
Forward-Looking Statements
Statements made in this presentation or in our earnings call for the first quarter of fiscal 2017 that look forward in time or that express management’s beliefs,
expectations or hopes are forward-looking statements within the meaning of the Private Securities Litigation Reform Act of 1995. Such forward-looking
statements reflect the views of management at the time such statements are made and are subject to a number of risks, uncertainties, estimates, and
assumptions that may cause actual results to differ materially from current expectations. These statements include our outlook for fiscal 2017, our plans and
expectations related to our three-year financial objectives and the key levers for realizing these goals, our ability to return additional value to our shareholders,
expectations regarding the Brakes Group acquisition and related benefits, including its impact on future earnings per share, and expectations regarding
deflation trends, and the impact of our fuel strategy. The success of our plans and expectations regarding our operating performance, including expectations
regarding our three-year financial objectives, are subject to the general risks associated with our business, including the risks of interruption of supplies due to
lack of long-term contracts, severe weather, crop conditions, work stoppages, intense competition, technology disruptions, dependence on large regional and
national customers, inflation risks, the impact of fuel prices, adverse publicity, and labor issues. Risks and uncertainties also include risks impacting the
economy generally, including the risks that the current general economic conditions will deteriorate, or consumer confidence in the economy or consumer
spending, particularly on food-away-from-home, may decline. Market conditions may not improve. If sales from our locally managed customers do not grow at
the same rate as sales from regional and national customers, our gross margins may decline. Our ability to meet our long-term strategic objectives depends
largely on the success of our various business initiatives, including efforts related to revenue management, expense management, our digital e-commerce
strategy and any efforts related to restructuring or the reduction of administrative costs. There are various risks related to these efforts, including the risk that
these efforts may not provide the expected benefits in our anticipated time frame, if at all, and may prove costlier than expected; the risk that the actual costs
of any initiatives may be greater or less than currently expected; and the risk of adverse effects to our business, results of operations and liquidity if past and
future undertakings, and the associated changes to our business, do not prove to be cost effective or do not result in the cost savings and other benefits at the
levels that we anticipate. Our plans related to and the timing of any initiatives are subject to change at any time based on management’s subjective evaluation
of our overall business needs. If we are unable to realize the anticipated benefits from our efforts, we could become cost disadvantaged in the marketplace, and
our competitiveness and our profitability could decrease. Periods of high inflation, either overall or in certain product categories, can have a negative impact on
us and our customers, as high food costs can reduce consumer spending in the food-away-from-home market, and may negatively impact our sales, gross
profit, operating income and earnings, and periods of deflation can be difficult to manage effectively. Fluctuations in inflation and deflation, as well as
fluctuations in the value of foreign currencies, are beyond our control and subject to broader market forces. Expanding into international markets presents
unique challenges and risks, including compliance with local laws, regulations and customs and the impact of local political and economic conditions, including
the impact of Brexit, and such expansion efforts, including our Brakes acquisition, may not be successful. Any business that we acquire, including the Brakes
transaction, may not perform as expected, and we may not realize the anticipated benefits of our acquisitions. The Brakes Group acquisition will require a
significant commitment of time and company resources, and realizing the anticipated benefits from the transaction may take longer than expected.
Expectations regarding the financial statement impact of any acquisitions may change based on management’s subjective evaluation. For a discussion of
additional factors impacting Sysco’s business, see the company’s Annual Report on Form 10-K for the year ended July 2, 2016, as filed with the Securities and
Exchange Commission, and the company’s subsequent filings with the SEC. Sysco does not undertake to update its forward-looking statements, except as
required by applicable law.
S Y S C O 1 Q 1 7
E A R N I N G S
R E S U L T S
1 1 . 0 7 . 1 6
Bill DeLaney
CEO
© 2016 All Rights Reserved.
Sysco Corporation.
P A G E 4
1Q17 Financial Highlights – (excluding Brakes)
Adjusted1 Reported
$MM, except per share
data 1Q17
YOY %
Change
1Q17
YOY %
Change
Sales $12,685 1.0% $12,685 1.0%
Gross Profit $2,349 5.0% $2,349 5.0%
Operating Expense $1,765 1.9% $1,802 3.3%
Operating Income $584 15.3% $547 10.8%
Net Earnings $352 12.8% $305 24.8%
Diluted EPS $0.63 21.2% $0.54 33.7%
1 See Non-GAAP reconciliations at the end of this presentation.
S Y S C O 1 Q 1 7
E A R N I N G S
R E S U L T S
1 1 . 0 7 . 1 6
© 2016 All Rights Reserved.
Sysco Corporation.
P A G E 5
89.0
102.6
103.5
80.0
90.0
100.0
110.0
Sep-14
Oct-14
Nov-14
Dec-14
Jan-15
Feb-15
Mar-15
Apr-15
May-15
Jun-15
Jul-15
Aug-15
Sep-15
Oct-15
Nov-15
Dec-15
Jan-16
Feb-16
Mar-16
Apr-16
May-16
Jun-16
Jul-16
Aug-16
Sep-16
U.S. Consumer Confidence - Two Years
Trend
US Consumer Confidence
Industry & economic trends remain uneven
5.5%
5.3%
5.1%
5.0%
5.0%
5.0%
4.7%
4.9%
4.9% 5.0%
0
100,000
200,000
300,000
400,000
500,000
3.0%
3.5%
4.0%
4.5%
5.0%
5.5%
6.0%
6.5%
7.0%
Mar-15 Jun-15 Sep-15 Dec-15 Mar-16 Jun-16 Sep-16
U.S. Unemployment Rate
Change in U.S. Non-Farm Payroll
Unemployment Rate & Non-Farm Payroll
96.8
Average
S Y S C O 1 Q 1 7
E A R N I N G S
R E S U L T S
1 1 . 0 7 . 1 6
1.5%
2.3%
3.2% 3.3%
3.0%
2.8% 2.7%
2.3%
1.8%
1.6%
1.2%
-1.5%
-1.0%
-0.5%
0.0%
0.5%
1.0%
1.5%
2.0%
2.5%
3.0%
3.5%
4.0%
Spend Traffic
NPD: Total Restaurant Spend/Traffic
% Change vs. Year Ago
101.0
100.6
95
96
97
98
99
100
101
102
103
104
105
Sep-09 Sep-10 Sep-11 Sep-12 Sep-13 Sep-14 Sep-15 Sep-16
NRA Current Situation and Expectation Indices
September 2009 - 2016
Current Situation Index Expectations Index
© 2016 All Rights Reserved.
Sysco Corporation.
P A G E 6
Strong quarter in legacy business enhanced with
the acquisition of Brakes Group
 Reaping the benefits of multi-
year foundational work
 Brakes Group
 Support growth with
experienced and talented
leadership team
 Drive out transformative
initiatives
 Identify additional acquisition
opportunities
S Y S C O 1 Q 1 7
E A R N I N G S
R E S U L T S
1 1 . 0 7 . 1 6
Supporting the success of our customers
Tom Bené
President & COO
© 2016 All Rights Reserved.
Sysco Corporation.
P A G E 8
Operating performance achieved by continued strong
execution on the key levers of our three-year plan
S Y S C O 1 Q 1 7
E A R N I N G S
R E S U L T S
1 1 . 0 7 . 1 6
1 See Non-GAAP reconciliations at the end of this presentation.
 Sales growth: 0.8%
 Gross Profit growth: 4.3%
 Gross Margin expansion:
68 bps
 Adjusted OPEX growth:
1.8%
 Adjusted Operating Income
growth: 8.4%
U.S. Foodservice
Operations1To Be Our Customers’
Most Valued and Trusted Business
Partner
• Accelerate
local case
growth
• Improve
margins
Grow Gross
Profit
Leverage
Supply
Chain
Costs
Reduce
Administrative
Costs
Enablers:
Our People
Business Technology
Corporate Social Responsibility
Achieve Financial Objectives
© 2016 All Rights Reserved.
Sysco Corporation.
P A G E 9
Enhanced industry leading processes and improved brand
performance drove GP growth and margin expansion
S Y S C O 1 Q 1 7
E A R N I N G S
R E S U L T S
1 1 . 0 7 . 1 6
Category Management
Value
Variety
Innovation
Revenue ManagementSysco Brand
Mix
Management
Disciplined
Approach
Tools and
Insights
© 2016 All Rights Reserved.
Sysco Corporation.
P A G E 1 0
Continued focus to implement sales training and
support tools enabling our customers to succeed
S Y S C O 1 Q 1 7
E A R N I N G S
R E S U L T S
1 1 . 0 7 . 1 6
 Investing in our Sales Organization through training
programs: local, chain, leadership
 Reducing non-value added work from our sales teams
 Strategically deploying our resources by leveraging
data to capitalize on the greatest opportunities
 Developing flexible order channels
© 2016 All Rights Reserved.
Sysco Corporation.
P A G E 1 1
Solid expense management led to a $0.04 improvement
in cost per case1
S Y S C O 1 Q 1 7
E A R N I N G S
R E S U L T S
1 1 . 0 7 . 1 6
t
OPCO
Productivity
Standardize best practices in transportation and
warehousing to improve quality, cost and safety
t
Fleet
Excellence
Right size fleet and optimize preventive maintenance and
shop execution
t
Indirect
Sourcing
Strategically source $1B of indirect spend and increase
purchasing compliance
t
Facilities
Optimization
Use best-in-class capacity planning to defer capital.
Standardize maintenance, construction and real estate
1 See Non-GAAP reconciliations at the end of this presentation.
© 2016 All Rights Reserved.
Sysco Corporation.
P A G E 1 2
International Foodservice Operations and SYGMA
performing well
S Y S C O 1 Q 1 7
E A R N I N G S
R E S U L T S
1 1 . 0 7 . 1 6
1 See Non-GAAP reconciliations at the end of this presentation.
SYGMA
International Foodservice
Operations1
 Sales increased $1.3 billion
 Adjusted Operating Income improved $50 million
 Brakes – Positive results in U.K., France and
Sweden
 Canada – Effectively managing deflation and soft
market environment
 Continues to make progress against key business
initiatives
 Confidence in full year growth goals being achieved
Joel Grade
CFO
© 2016 All Rights Reserved.
Sysco Corporation.
P A G E 1 4
1Q17 Financial Highlights (including Brakes)
Adjusted1 Reported
$MM, except per share
data FY17
YOY %
Change
FY17
YOY %
Change
Sales $13,969 11.2% $13,969 11.2%
Gross Profit $2,692 20.3% $2,692 20.3%
Operating Expense $2,065 19.3% $2,125 21.8%
Operating Income $627 23.8% $567 14.9%
Net Earnings $376 20.7% $324 32.5%
Diluted EPS $0.67 28.8% $0.58 41.5%
1 See Non-GAAP reconciliations at the end of this presentation.
S Y S C O 1 Q 1 7
E A R N I N G S
R E S U L T S
1 1 . 0 7 . 1 6
© 2016 All Rights Reserved.
Sysco Corporation.
P A G E 1 5
Strong operating performance
Gross Profit growth continues to outpace OPEX growth
 Performance is driven by commercial initiatives and strong management of
expenses
1 See Non-GAAP reconciliations at the end of this presentation.
S Y S C O 1 Q 1 7
E A R N I N G S
R E S U L T S
1 1 . 0 7 . 1 6
6.0%
6.1%
3.1%
3.0%
2.3%
3.4%
4.1%
4.7%
5.0%
6.0%
6.8%
4.5%
2.2%
3.1%
1.8%
1.5% 1.7% 1.9%
0.0%
1.0%
2.0%
3.0%
4.0%
5.0%
6.0%
7.0%
8.0%
1Q15 2Q15 3Q15 4Q15 1Q16 2Q16 3Q16 4Q16 1Q17
Total Sysco Operating Leverage (excluding Brakes)1
GP growth OPEX growth
© 2016 All Rights Reserved.
Sysco Corporation.
P A G E 1 6
Cash Flow & Balance Sheet
 Cash flow
 Cash from operations was $249 million, up approximately $510 million from last year
 Free Cash Flow: $111 million, up approximately $492 million from last year
 Net CAPEX: $138 million
 Balance sheet
 Net working capital days – improvement by 2.0 days year over year; 2.8 days vs. FY15
 Driven by improvements in all three phases: AP, AR and Inventory
1 See Non-GAAP reconciliations at the end of this presentation.
S Y S C O 1 Q 1 7
E A R N I N G S
R E S U L T S
1 1 . 0 7 . 1 6
$(600)
$(400)
$(200)
$-
$200
$400
$600
$800
$1,000
$1,200
2013 2014 2015 2016 2017 2013 2014 2015 2016 2013 2014 2015 2016 2013 2014 2015 2016
Q1 Q2 Q3 Q4
Quarterly Cash Flow1
Net cash provided by operating activities (GAAP) Free Cash Flow (Non-GAAP)
© 2016 All Rights Reserved.
Sysco Corporation.
P A G E 1 7
Business updates
 Brakes Group
 Accretion to adjusted EPS will be high-single-digits in FY 2017
 Approximately $0.04 accretive for the first quarter1
 Seasonality - Performance of the business is more heavily weighted to the first
half of Sysco’s fiscal year
 Fuel Update
 Favorable benefit will lap in November
 Enhancing our strategy using derivatives to hedge our exposure
 Credit Facility
 Upsizing our facility from $1.5 billion to $2.0 billion
S Y S C O 1 Q 1 7
E A R N I N G S
R E S U L T S
1 1 . 0 7 . 1 6
1 See Non-GAAP reconciliations at the end of this presentation.
© 2016 All Rights Reserved.
Sysco Corporation.
P A G E 1 8
Summary
 Quality quarter reflecting continued momentum from improved
underlying business performance
 Disciplined approach to case growth
 Strong GP growth
 Good cost management
 Committed to serving our customers and delivering a high level
of execution in all areas of our business
S Y S C O 1 Q 1 7
E A R N I N G S
R E S U L T S
1 1 . 0 7 . 1 6
Non-GAAP Reconciliations
© 2016 All Rights Reserved.
Sysco Corporation.
P A G E 2 0
New Segment Reporting Structure
S Y S C O 1 Q 1 7
E A R N I N G S
R E S U L T S
1 1 . 0 7 . 1 6
Sysco Corporation and its Consolidated Subsidiaries
COMPARATIVE SEGMENT DATA RECLASSIFIED FOR NEW SEGMENT REPORTING STRUCTURE (Unaudited)
(In Thousands)
· SYGMA - our chain restaurant distribution subsidiary; and
In connection with the Acquisition, the company has reassessed its reportable segments based on how the chief operating decision maker assesses
performance and allocated resources. Sysco's has aggregated its operating companies into four reportable segments as follows:
Broadline operating companies distribute a full line of food products and a wide variety of non-food products to both traditional and chain restaurant
customers, hospitals, schools, hotels, industrial caterers and other venues where foodservice products are served. SYGMA operating companies distribute a
full line of food products and a wide variety of non-food products to certain chain restaurant customer locations. The following table provides our segment
performance with prior year amounts reclassified to conform to the current year presentation.
· U.S. Foodservice Operations - primarily includes U.S. Broadline, custom-cut meat companies, FreshPoint (our specialty produce companies) and European
Imports (a specialty import company);
· International Foodservice Operations - primarily includes broadline operations in Canada and Europe, including the Brakes Group, Bahamas, Mexico and
Costa Rica as well as a company that distributes to international customers;
· Other - primarily our hotel supply operations and our Sysco Ventures platform, which includes our suite of technology solutions that help support the
business needs of our customers.
© 2016 All Rights Reserved.
Sysco Corporation.
P A G E 2 1
New Segment Reporting Structure
S Y S C O 1 Q 1 7
E A R N I N G S
R E S U L T S
1 1 . 0 7 . 1 6
Sysco Corporation and its Consolidated Subsidiaries
Non-GAAP Reconciliation (Unaudited)
Impact of Certain Items
(In Thousands, Except for Share and Per Share Data)
U.S. Foodservice Operations
Sales (GAAP) $ 9,481,115 $ 9,407,923 $ 9,135,326 $ 9,037,417 $ 10,195,775 $ 37,776,442
Gross Profit (GAAP) 1,913,116 1,834,354 1,759,390 1,765,279 2,054,413 7,413,436
Gross Margin (GAAP) 20.2% 19.5% 19.3% 19.5% 20.1% 19.6%
Operating expenses (GAAP) $ 1,167,884 $ 1,147,685 $ 1,134,174 $ 1,121,953 $ 1,237,692 $ 4,641,504
Impact of restructuring costs - (873) (561) (742) (1,175) (3,351)
Impact of acquisition-related costs (2) - - - - - -
Operating expenses adjusted for certain items (Non-GAAP) $ 1,167,884 $ 1,146,812 $ 1,133,613 $ 1,121,211 $ 1,236,517 $ 4,638,153
Operating income (GAAP) $ 745,231 $ 686,669 $ 625,216 $ 643,326 $ 816,721 $ 2,771,932
Impact of restructuring costs - 873 561 742 1,175 3,351
Impact of acquisition-related costs (2) - - - - - -
Operating income adjusted for certain items (Non-GAAP) $ 745,231 $ 687,542 $ 625,777 $ 644,068 $ 817,896 $ 2,775,283
International Foodservice Operations
Sales (GAAP) $ 2,728,360 $ 1,390,259 $ 1,280,775 $ 1,251,815 $ 1,513,361 $ 5,436,209
Gross Profit (GAAP) 598,406 245,462 221,198 210,682 261,600 938,942
Gross Margin (GAAP) 21.9% 17.7% 17.3% 16.8% 17.3% 17.3%
Operating expenses (GAAP) $ 518,971 $ 193,542 $ 178,986 $ 177,661 $ 211,594 $ 761,783
Impact of restructuring costs (1) (4,680) (1,243) (586) (308) (6,808) (8,945)
Impact of acquisition-related costs (2) (19,498) - - - - -
Operating expenses adjusted for certain items (Non-GAAP) $ 494,793 $ 192,299 $ 178,400 $ 177,353 $ 204,786 $ 752,838
Operating income (GAAP) $ 79,435 $ 51,920 $ 42,212 $ 33,021 $ 50,006 $ 177,159
Impact of restructuring costs (1) 4,680 1,243 586 308 6,808 8,945
Impact of acquisition-related costs (2) 19,498 - - - - -
Operating income adjusted for certain items (Non-GAAP) $ 103,613 $ 53,163 $ 42,798 $ 33,329 $ 56,814 $ 186,104
SYGMA
Sales (GAAP) $ 1,504,692 $ 1,445,905 $ 1,506,836 $ 1,497,365 $ 1,652,222 $ 6,102,328
Gross Profit (GAAP) 114,976 110,320 111,790 114,657 119,214 455,981
Gross Margin (GAAP) 7.64% 7.63% 7.42% 7.66% 7.22% 7.47%
Operating expenses (GAAP) $ 110,068 $ 105,197 $ 106,131 $ 105,313 $ 111,871 $ 428,512
Impact of restructuring costs - (5) (77) (20) - (102)
Impact of acquisition-related costs (2) - - - - - -
Operating expenses adjusted for certain items (Non-GAAP) $ 110,068 $ 105,192 $ 106,054 $ 105,293 $ 111,871 $ 428,410
Operating income (GAAP) $ 4,908 $ 5,123 $ 5,659 $ 9,344 $ 7,343 $ 27,469
Impact of restructuring costs - 5 77 20 - 102
Impact of acquisition-related costs (2) - - - - - -
Operating income adjusted for certain items (Non-GAAP) $ 4,908 $ 5,128 $ 5,736 $ 9,364 $ 7,343 $ 27,571
53-Week
July 2, 2016
Q1 FY16 Q2 FY16 Q3 FY16 Q4 FY16
Sep. 26, 2015 Dec. 26, 2015 Mar. 26, 2016 July 2, 2016
Q1 FY17
Oct. 1, 2016
© 2016 All Rights Reserved.
Sysco Corporation.
P A G E 2 2
New Segment Reporting Structure
S Y S C O 1 Q 1 7
E A R N I N G S
R E S U L T S
1 1 . 0 7 . 1 6
Sysco Corporation and its Consolidated Subsidiaries
Non-GAAP Reconciliation (Unaudited)
Impact of Certain Items
(In Thousands, Except for Share and Per Share Data)
Other
Sales (GAAP) $ 254,486 $ 318,524 $ 230,689 $ 216,194 $ 286,532 $ 1,051,939
Gross Profit (GAAP) 68,283 58,873 56,379 56,242 69,072 240,566
Gross Margin (GAAP) 26.83% 18.48% 24.44% 26.01% 24.11% 22.87%
Operating expenses (GAAP) $ 60,282 $ 48,103 $ 49,999 $ 49,626 $ 60,252 $ 207,980
Impact of restructuring costs - (11) (52) (52) (52) (167)
Operating expenses adjusted for certain items (Non-GAAP) $ 60,282 $ 48,092 $ 49,947 $ 49,574 $ 60,200 $ 207,813
Operating income (GAAP) $ 8,001 $ 10,770 $ 6,380 $ 6,616 $ 8,820 $ 32,586
Impact of restructuring costs - 11 52 52 52 167
Operating income adjusted for certain items (Non-GAAP) $ 8,001 $ 10,781 $ 6,432 $ 6,668 $ 8,872 $ 32,753
Corporate
Gross Profit (GAAP) $ (2,861) $ (11,363) $ 8,472 $ (3,884) $ (1,707) $ (8,482)
Operating expenses (GAAP) $ 267,880 $ 249,993 $ 254,941 $ 310,666 $ 334,584 $ 1,150,184
Impact of restructuring costs (3) (33,604) (1,057) (3,005) (58,320) (48,185) (110,568)
Impact of acquisition-related costs (4) (2,212) (9,816) - (586) (25,212) (35,615)
Operating expenses adjusted for certain items (Non-GAAP) $ 232,064 $ 239,120 $ 251,936 $ 251,759 $ 261,187 $ 1,004,002
Operating income (GAAP) $ (270,742) $ (261,008) $ (246,478) $ (314,550) $ (336,291) $ (1,158,327)
Impact of restructuring costs (3) 33,604 1,057 3,005 58,320 48,185 110,568
Impact of acquisition-related costs (4) 2,212 9,816 - 586 25,212 35,615
Operating income adjusted for certain items (Non-GAAP) $ (234,925) $ (250,135) $ (243,473) $ (255,643) $ (262,894) $ (1,012,145)
Total Sysco
Sales (GAAP) $ 13,968,654 $ 12,562,611 $ 12,153,626 $ 12,002,791 $ 13,647,890 $ 50,366,919
Gross Profit (GAAP) 2,691,919 2,237,646 2,157,229 2,142,976 2,502,592 9,040,443
Gross Margin (GAAP) 19.27% 17.81% 17.75% 17.85% 18.34% 17.95%
Operating expenses (GAAP) $ 2,125,086 $ 1,744,520 $ 1,724,231 $ 1,765,219 $ 1,955,993 $ 7,189,963
Impact of restructuring costs (1) (3) (38,285) (3,189) (4,281) (59,443) (56,220) (123,134)
Impact of acquisition-related costs (2) (4) (21,710) (9,816) - (586) (25,212) (35,615)
Operating expenses adjusted for certain items (Non-GAAP) $ 2,065,091 $ 1,731,515 $ 1,719,950 $ 1,705,189 $ 1,874,561 $ 7,031,215
Operating income (GAAP) $ 566,834 $ 493,474 $ 432,989 $ 377,757 $ 546,599 $ 1,850,819
Impact of restructuring costs (1) (3) 38,285 3,189 4,281 59,443 56,220 123,134
Impact of acquisition-related costs (2) (4) 21,710 9,816 - 586 25,212 35,615
Operating income adjusted for certain items (Non-GAAP) $ 626,828 $ 506,479 $ 437,270 $ 437,787 $ 628,031 $ 2,009,567
53-Week
July 2, 2016
(1)
Fiscal 2017 includes restructuring expenses within our Brakes operations.
(2)
Fiscal 2017 Includes $19 million related to intangible amortization expense from the Brakes acquisition which is included in the results of Brakes.
(4)
Fiscal 2017 Includes $2 million related to transaction costs from the Brakes acquisition. Fiscal 2016 includes US Foods merger termination costs.
(3)
Includes $28 million in accelerated depreciation associated with our revised business technology strategy, professional fees on 3-year financial objectives and
costs to convert to legacy systems in conjunction with our revised business technology strategy.
Q1 FY16 Q2 FY16 Q3 FY16 Q4 FY16
Sep. 26, 2015 Dec. 26, 2015 Mar. 26, 2016 July 2, 2016
Q1 FY17
Oct. 1, 2016
© 2016 All Rights Reserved.
Sysco Corporation.
P A G E 2 3
Impact of Certain Items
Sysco Corporation and its Consolidated Subsidiaries
Non-GAAP Reconciliation (Unaudited)
Impact of Certain Items
Sysco’s results of operations are impacted by restructuring costs consisting of (1) severance charges, (2) professional fees related to
our three-year strategic plan, (3) restructuring expenses within our Brakes Group operations and (4) expenses associated with our
revised business technology strategy announced in fiscal 2016, as a result of which we recorded accelerated depreciation on our
existing system and incurred costs to convert to legacy systems. Our results of operations are also impacted by the following
acquisition-related items: (1) intangible amortization expense (2) transaction costs and (3) integration costs. All acquisition-related
costs in fiscal 2017 that have been excluded relate to the Acquisition. Fiscal 2016 acquisition-related costs, however, include (i)
termination costs in connection with the merger that had been proposed with US Foods, Inc. (US Foods) and (ii) financing costs related
to the senior notes that were issued in fiscal 2015 to fund the proposed US Foods merger. These senior notes were redeemed in the
first quarter of fiscal 2016, triggering a redemption loss of $86.5 million, and we incurred interest on these notes through the
redemption date. The Acquisition also resulted in non-recurring tax expense in fiscal 2017, primarily from non-deductible transaction
costs. These fiscal 2017 and fiscal 2016 items are collectively referred to as "Certain Items.“
Management believes that adjusting its operating expenses, operating income, operating margin as a percentage of sales, interest
expense, net earnings and diluted earnings per share to remove these Certain Items provides an important perspective with respect to
our underlying business trends and results and provides meaningful supplemental information to both management and investors that
(1) is indicative of the performance of the company's underlying operations and facilitates comparisons on a year-over-year basis and
(2) removes those items that are difficult to predict and are often unanticipated, and which as a result, are difficult to include in
analysts' financial models and our investors' expectations with any degree of specificity.
Although Sysco has a history of growth through acquisitions, the Brakes Group is significantly larger than the companies historically
acquired by Sysco, with a proportionately greater impact on Sysco’s consolidated financial statements. Accordingly, Sysco is excluding
from its non-GAAP financial measures for the relevant period solely for those acquisition costs specific to the Acquisition. We believe
this approach significantly enhances the comparability of Sysco’s results for the first quarter of fiscal 2017 to the same period in fiscal
2016. Also, given the significance of the Acquisition, management believes that presenting Sysco’s financial measures, excluding the
Brakes Group operating results, enhances comparability of the period over period financial performance of Sysco’s legacy business and
allows investors to more effectively measure Sysco’s progress against the financial goals under Sysco’s three year strategic plan.
Set forth below is a reconciliation of sales, operating expenses, operating income, interest expense, net earnings and diluted earnings
per share to adjusted results for these measures for the periods presented. Individual components of diluted earnings per share may
not add to the total presented due to rounding. Adjusted diluted earnings per share is calculated using adjusted net earnings divided
by diluted shares outstanding.
S Y S C O 1 Q 1 7
E A R N I N G S
R E S U L T S
1 1 . 0 7 . 1 6
© 2016 All Rights Reserved.
Sysco Corporation.
P A G E 2 4
Impact on Certain Items
S Y S C O 1 Q 1 7
E A R N I N G S
R E S U L T S
1 1 . 0 7 . 1 6
Sysco Corporation and its Consolidated Subsidiaries
Non-GAAP Reconciliation (Unaudited)
Impact of Certain Items and Brakes
(In Thousands, Except for Share and Per Share Data)
13-Week
Period Change
in Dollars
13-Week
Period
% Change
Sales $ 13,968,654 $ 12,562,611 $ 1,406,043 11.2%
Impact of Brakes (1,283,524) - (1,283,524) NM
Sales excluding the impact of Brakes (Non-GAAP) $ 12,685,130 $ 12,562,611 $ 122,519 1.0%
Gross profit $ 2,691,919 $ 2,237,995 $ 453,924 20.3%
Impact of Brakes (343,051) - (343,051) NM
Gross profit excluding the impact of Brakes (Non-GAAP) $ 2,348,868 $ 2,237,995 $ 110,873 5.0%
Gross margin 19.27% 17.81% 1.46% 8.2%
Impact of Brakes 0.75% - 0.75% NM
Gross margin excluding the impact of Brakes (Non-GAAP) 18.52% 17.81% 0.70% 3.9%
Operating expenses (GAAP) $ 2,125,086 $ 1,744,521 $ 380,565 21.8%
Impact of restructuring costs (1) (38,285) (3,189) (35,096) NM
Impact of acquisition-related costs (2) (21,710) (9,816) (11,894) 121.2%
Operating expenses adjusted for certain items (Non-GAAP) $ 2,065,091 $ 1,731,516 $ 333,575 19.3%
Impact of Brakes (322,843) - (322,843) NM
Impact of Brakes restructuring costs (3) 3,074 - 3,074 NM
Impact of Brakes acquisition-related costs (2) 19,498 - 19,498 NM
Operating expenses adjusted for certain items and excluding the
impact of Brakes (Non-GAAP)
$ 1,764,820 $ 1,731,516 $ 33,304 1.9%
Operating income (GAAP) $ 566,833 $ 493,474 $ 73,359 14.9%
Impact of restructuring costs (1) 38,285 3,189 35,096 NM
Impact of acquisition-related costs (2) 21,710 9,816 11,894 121.2%
Operating income adjusted for certain items -GAAP) $ 626,828 $ 506,479 $ 120,349 23.8%
Impact of Brakes (20,208) - (20,208) NM
Impact of Brakes restructuring costs (3) (3,074) - (3,074) NM
Impact of Brakes acquisition-related costs (2) (19,498) - (19,498) NM
Operating income adjusted for certain items and excluding the
impact of Brakes (Non-GAAP)
$ 584,048 $ 506,479 $ 77,569 15.3%
13-Week
Period Ended
Oct. 1, 2016
13-Week
Period Ended
Sep 26, 2015
© 2016 All Rights Reserved.
Sysco Corporation.
P A G E 2 5
Impact on Certain Items
S Y S C O 1 Q 1 7
E A R N I N G S
R E S U L T S
1 1 . 0 7 . 1 6
Sysco Corporation and its Consolidated Subsidiaries
Non-GAAP Reconciliation (Unaudited)
Impact of Certain Items and Brakes
(In Thousands, Except for Share and Per Share Data)
13-Week
Period Change
in Dollars
13-Week
Period
% Change
Operating margin (GAAP) 4.06% 3.93% 0.13% 3.3%
Operating margin excluding Certain Items (Non-GAAP) 4.49% 4.03% 0.46% 11.3%
Operating margin excluding Certain Items and Brakes (Non-GAAP) 4.60% 4.03% 0.57% 14.2%
Interest expense (GAAP) $ 73,623 $ 126,907 $ (53,284) -42.0%
Impact of acquisition financing costs (4) - (94,835) 94,835 -100.0%
Interest expense adjusted for certain items (Non-GAAP) $ 73,623 $ 32,072 $ 41,551 129.6%
Net earnings (GAAP) $ 323,887 $ 244,420 $ 79,467 32.5%
Impact of restructuring cost (1) 38,285 3,189 35,096 NM
Impact of acquisition-related costs (2) 21,710 9,816 11,894 121.2%
Impact of acquisition financing costs (4) - 94,835 (94,835) -100.0%
Tax impact of restructuring cost (5) (3,593) (1,198) (2,395) 199.9%
Tax impact of acquisition-related costs (5) (4,169) (3,688) (481) 13.0%
Tax impact of acquisition financing costs (5) - (35,632) 35,632 -100.0%
Net earnings adjusted for certain items(Non-GAAP) $ 376,120 $ 311,742 $ 64,378 20.7%
Impact of Brakes (18,852) - (18,852) NM
Impact of Brakes restructuring costs (3) (2,446) - (2,446) NM
Impact of Brakes acquisition-related costs (2) (15,514) - (15,514) NM
Impact of interest expense on debt issued for the Brakes acquisition (6) 19,735 - 19,735 NM
Tax impact of interest expense on debt issued for the Brakes acquisition (5) (7,460) - (7,460) NM
Net earnings adjusted for certain items and excluding the impact of
Brakes (Non-GAAP)
$ 351,583 $ 311,742 $ 39,841 12.8%
Diluted earnings per share (GAAP) $ 0.58 $ 0.41 $ 0.17 41.5%
Impact of restructuring costs (1) 0.07 - 0.07 NM
Impact of acquisition-related costs (2) 0.04 0.02 0.02 144.8%
Impact of acquisition financing costs (4) - 0.16 (0.16) -100.0%
Tax impact of restructuring cost (5) (0.01) - (0.01) NM
Tax impact of acquisition-related costs (5) (0.01) (0.01) (0.00) 62.9%
Tax impact of acquisition financing costs (5) - (0.06) 0.06 -100.0%
Diluted EPS adjusted for certain items(Non-GAAP) (7) $ 0.67 $ 0.52 $ 0.15 28.8%
Impact of Brakes (0.03) - (0.03) NM
Impact of Brakes restructuring costs (3) (0.01) - (0.01) NM
Impact of Brakes acquisition-related costs (2) (0.02) - (0.02) NM
Impact of interest expense on debt issued for the Brakes acquisition (6) 0.04 - 0.04 NM
Tax impact of interest expense on debt issued for the Brakes acquisition (5) (0.01) - (0.01) NM
Diluted EPS adjusted for certain items and excluding the impact of
Brakes (Non-GAAP) (7)
$ 0.63 $ 0.52 $ 0.11 20.4%
Diluted shares outstanding 560,954,068 600,789,913
13-Week
Period Ended
Oct. 1, 2016
13-Week
Period Ended
Sep 26, 2015
© 2016 All Rights Reserved.
Sysco Corporation.
P A G E 2 6
Impact on Certain Items
S Y S C O 1 Q 1 7
E A R N I N G S
R E S U L T S
1 1 . 0 7 . 1 6
NM represents that the percentage change is not meaningful
(7)
Individual components of diluted earnings per share may not add to the total presented due to rounding. Total diluted earnings per share is calculated using adjusted net
earnings divided by diluted shares outstanding.
(1)
Includes $28 million in accelerated depreciation associated with our revised business technology strategy and $10 million related to severance charges, professional fees on
3-year financial objectives, restructuring expenses within our Brakes operations and costs to convert to legacy systems in conjunction with our revised business technology
strategy.
(2)
Fiscal 2017 Includes $19 million related to intangible amortization expense from the Brakes acquisition which is included in the results of Brakes and $2 million in transaction
costs. Fiscal 2016 includes US Foods merger termination costs.
(3)
Includes Brakes Acquisition restructuring charges
(4)
Includes US Foods financing costs applicable to fiscal 2016.
(5)
The tax impact of adjustments for Certain Items are calculated by multiplying the pretax impact of each Certain Item by the statutory rates in effect for each jurisdiction
where the Certain Item was incurred. The adjustments also include $7 million in non-deductible transaction costs and $4 million in other one-time costs related to the Brakes
acquisition.
(6)
Includes interest expense arising from debt issued to finance the Brakes acquisition.
© 2016 All Rights Reserved.
Sysco Corporation.
P A G E 2 7
Cost per Case
S Y S C O 1 Q 1 7
E A R N I N G S
R E S U L T S
1 1 . 0 7 . 1 6
Sysco Corporation and its Consolidated Subsidiaries
Cost per Case
13-Week
Period
Change
(Decrease) increase in cost per case $ (0.04)
Impact of Certain Items (1)
-
(Decrease) increase in adjusted cost per case (Non-GAAP basis) $ (0.04)
Impact of fuel prices (0.04)
(Decrease) increase in adjusted cost per case (Non-GAAP basis) $ -
Non-GAAP Reconciliation (Unaudited)
Cost per case is an important metric management uses to measure our expense performance. This metric is calculated by taking
the total operating expense of our U.S. Broadline companies, divided by the number of cases sold. Adjusted cost per case is
calculated similarly; however, the operating expense component excludes charges from severance, which are the Certain Items
applicable to these companies, divided by the number of cases sold. For both the first quarter of fiscal 2017 and 2016, the
adjustment for Certain Items was not significant enough to produce a different value on an adjusted basis. Our corporate
expenses are not included in the cost per cases metrics because the metric is a measure of efficiency in our operations. We seek
to grow our sales and either minimize or reduce our costs on a per case basis. Our U.S. Broadline operations represent
approximately 90% of the U.S. Foodservice Operations segment's sales and nearly 85% of its operating expenses. Our cost per
case is also impacted by lower fuel prices year over year and is significantly lowering our cost per case results. Sysco considers
adjusted cost per case to be a measure that provides useful information to management and investors about Sysco's expense
management. An analysis of any non-GAAP financial measure should be used in conjunction with results presented in accordance
with GAAP. In the table that follows, the change in adjusted cost per case is reconciled to cost per case for the first quarter of
fiscal 2017 as compared to the first quarter of fiscal 2016.
(1)
The impact of Certain Items excludes severance charges that were applicable in both periods.
© 2016 All Rights Reserved.
Sysco Corporation.
P A G E 2 8
Free Cash Flow
S Y S C O 1 Q 1 7
E A R N I N G S
R E S U L T S
1 1 . 0 7 . 1 6
Sysco Corporation and its Consolidated Subsidiaries
Non-GAAP Reconciliation (Unaudited)
Free Cash Flow
(In Thousands)
Net cash provided by operating activities (GAAP) $ 248,674
Additions to plant and equipment (142,255)
Proceeds from sales of plant and equipment 4,261
Free Cash Flow (Non-GAAP) $ 110,680
Net cash provided by operating activities (GAAP) $ (261,482) $ 730,363 $ 520,100 $ 944,161 $ 1,933,142
Additions to plant and equipment (121,243) (126,990) (112,650) (166,463) (527,346)
Proceeds from sales of plant and equipment 1,506 9,321 1,796 10,888 23,511
Free Cash Flow (Non-GAAP) $ (381,219) $ 612,694 $ 409,246 $ 788,586 $ 1,429,307
Net cash provided by operating activities (GAAP) $ 62,618 $ 389,820 $ 408,061 $ 694,985 $ 1,555,484
Additions to plant and equipment (118,821) (179,247) (139,218) (105,544) (542,830)
Proceeds from sales of plant and equipment 1,126 1,004 13,274 9,068 24,472
Free Cash Flow (Non-GAAP) $ (55,077) $ 211,577 $ 282,117 $ 598,509 $ 1,037,126
Net cash provided by operating activities (GAAP) $ 169,229 $ 288,935 $ 389,900 $ 644,751 $ 1,492,815
Additions to plant and equipment (135,749) (134,683) (117,019) (135,755) (523,206)
Proceeds from sales of plant and equipment 10,573 12,907 215 2,095 25,790
Free Cash Flow (Non-GAAP) $ 44,053 $ 167,159 $ 273,096 $ 511,091 $ 995,399
Net cash provided by operating activities (GAAP) $ 213,201 $ 173,584 $ 372,623 $ 752,186 $ 1,511,594
Additions to plant and equipment (155,673) (105,903) (111,472) (138,814) (511,862)
Proceeds from sales of plant and equipment 1,393 1,836 8,886 3,412 15,527
Free Cash Flow (Non-GAAP) $ 58,921 $ 69,517 $ 270,037 $ 616,784 $ 1,015,259
July 2, 2016
Oct. 1, 2016
Q1 FY16 Q2 FY16 Q3 FY16 Q4 FY16 53-Week Period
Sep. 26, 2015 Dec. 26, 2015 Mar. 26, 2016 July 2, 2016
52-Week Period
Sep. 27, 2014 Dec. 27, 2014 Mar. 28, 2015 June 27, 2015 June 27, 2015
Q1 FY15 Q2 FY15 Q3 FY15 Q4 FY15
June 28, 2014 June 28, 2014
Q1 FY14 Q2 FY14 Q3 FY14 Q4 FY14
Q1 FY17
Free cash flow represents net cash provided from operating activities less purchases of plant and equipment and includes proceeds from sales of plant and
equipment. Sysco considers free cash flow to be a liquidity measure that provides useful information to management and investors about the amount of
cash generated by the business after the purchases and sales of buildings, fleet, equipment and technology, which may potentially be used to pay for,
among other things, strategic uses of cash including dividend payments, share repurchases and acquisitions. However, free cash flow may not be available
for discretionary expenditures, as it may be necessary that we use it to make mandatory debt service or other payments. Free cash flow should not be
used as a substitute for the most comparable GAAP measure in assessing the company’s liquidity for the periods presented. An analysis of any non-GAAP
financial measure should be used in conjunction with results presented in accordance with GAAP. In the table that follows, free cash flow for each period
presented is reconciled to net cash provided by operating activities.
52-Week Period
June 29, 2013Sep. 29, 2012 Dec. 29, 2012 Mar. 30, 2013 June 29, 2013
Q1 FY13 Q2 FY13 Q3 FY13 Q4 FY13
52-Week Period
Sep. 28, 2013 Dec. 28, 2013 Mar. 29, 2014

Sysco Q1 2017 Earnings Presenation

  • 1.
    Sysco 1Q17 EarningsResults November 7, 2016
  • 2.
    © 2016 AllRights Reserved. Sysco Corporation. P A G E 2 Forward-Looking Statements Statements made in this presentation or in our earnings call for the first quarter of fiscal 2017 that look forward in time or that express management’s beliefs, expectations or hopes are forward-looking statements within the meaning of the Private Securities Litigation Reform Act of 1995. Such forward-looking statements reflect the views of management at the time such statements are made and are subject to a number of risks, uncertainties, estimates, and assumptions that may cause actual results to differ materially from current expectations. These statements include our outlook for fiscal 2017, our plans and expectations related to our three-year financial objectives and the key levers for realizing these goals, our ability to return additional value to our shareholders, expectations regarding the Brakes Group acquisition and related benefits, including its impact on future earnings per share, and expectations regarding deflation trends, and the impact of our fuel strategy. The success of our plans and expectations regarding our operating performance, including expectations regarding our three-year financial objectives, are subject to the general risks associated with our business, including the risks of interruption of supplies due to lack of long-term contracts, severe weather, crop conditions, work stoppages, intense competition, technology disruptions, dependence on large regional and national customers, inflation risks, the impact of fuel prices, adverse publicity, and labor issues. Risks and uncertainties also include risks impacting the economy generally, including the risks that the current general economic conditions will deteriorate, or consumer confidence in the economy or consumer spending, particularly on food-away-from-home, may decline. Market conditions may not improve. If sales from our locally managed customers do not grow at the same rate as sales from regional and national customers, our gross margins may decline. Our ability to meet our long-term strategic objectives depends largely on the success of our various business initiatives, including efforts related to revenue management, expense management, our digital e-commerce strategy and any efforts related to restructuring or the reduction of administrative costs. There are various risks related to these efforts, including the risk that these efforts may not provide the expected benefits in our anticipated time frame, if at all, and may prove costlier than expected; the risk that the actual costs of any initiatives may be greater or less than currently expected; and the risk of adverse effects to our business, results of operations and liquidity if past and future undertakings, and the associated changes to our business, do not prove to be cost effective or do not result in the cost savings and other benefits at the levels that we anticipate. Our plans related to and the timing of any initiatives are subject to change at any time based on management’s subjective evaluation of our overall business needs. If we are unable to realize the anticipated benefits from our efforts, we could become cost disadvantaged in the marketplace, and our competitiveness and our profitability could decrease. Periods of high inflation, either overall or in certain product categories, can have a negative impact on us and our customers, as high food costs can reduce consumer spending in the food-away-from-home market, and may negatively impact our sales, gross profit, operating income and earnings, and periods of deflation can be difficult to manage effectively. Fluctuations in inflation and deflation, as well as fluctuations in the value of foreign currencies, are beyond our control and subject to broader market forces. Expanding into international markets presents unique challenges and risks, including compliance with local laws, regulations and customs and the impact of local political and economic conditions, including the impact of Brexit, and such expansion efforts, including our Brakes acquisition, may not be successful. Any business that we acquire, including the Brakes transaction, may not perform as expected, and we may not realize the anticipated benefits of our acquisitions. The Brakes Group acquisition will require a significant commitment of time and company resources, and realizing the anticipated benefits from the transaction may take longer than expected. Expectations regarding the financial statement impact of any acquisitions may change based on management’s subjective evaluation. For a discussion of additional factors impacting Sysco’s business, see the company’s Annual Report on Form 10-K for the year ended July 2, 2016, as filed with the Securities and Exchange Commission, and the company’s subsequent filings with the SEC. Sysco does not undertake to update its forward-looking statements, except as required by applicable law. S Y S C O 1 Q 1 7 E A R N I N G S R E S U L T S 1 1 . 0 7 . 1 6
  • 3.
  • 4.
    © 2016 AllRights Reserved. Sysco Corporation. P A G E 4 1Q17 Financial Highlights – (excluding Brakes) Adjusted1 Reported $MM, except per share data 1Q17 YOY % Change 1Q17 YOY % Change Sales $12,685 1.0% $12,685 1.0% Gross Profit $2,349 5.0% $2,349 5.0% Operating Expense $1,765 1.9% $1,802 3.3% Operating Income $584 15.3% $547 10.8% Net Earnings $352 12.8% $305 24.8% Diluted EPS $0.63 21.2% $0.54 33.7% 1 See Non-GAAP reconciliations at the end of this presentation. S Y S C O 1 Q 1 7 E A R N I N G S R E S U L T S 1 1 . 0 7 . 1 6
  • 5.
    © 2016 AllRights Reserved. Sysco Corporation. P A G E 5 89.0 102.6 103.5 80.0 90.0 100.0 110.0 Sep-14 Oct-14 Nov-14 Dec-14 Jan-15 Feb-15 Mar-15 Apr-15 May-15 Jun-15 Jul-15 Aug-15 Sep-15 Oct-15 Nov-15 Dec-15 Jan-16 Feb-16 Mar-16 Apr-16 May-16 Jun-16 Jul-16 Aug-16 Sep-16 U.S. Consumer Confidence - Two Years Trend US Consumer Confidence Industry & economic trends remain uneven 5.5% 5.3% 5.1% 5.0% 5.0% 5.0% 4.7% 4.9% 4.9% 5.0% 0 100,000 200,000 300,000 400,000 500,000 3.0% 3.5% 4.0% 4.5% 5.0% 5.5% 6.0% 6.5% 7.0% Mar-15 Jun-15 Sep-15 Dec-15 Mar-16 Jun-16 Sep-16 U.S. Unemployment Rate Change in U.S. Non-Farm Payroll Unemployment Rate & Non-Farm Payroll 96.8 Average S Y S C O 1 Q 1 7 E A R N I N G S R E S U L T S 1 1 . 0 7 . 1 6 1.5% 2.3% 3.2% 3.3% 3.0% 2.8% 2.7% 2.3% 1.8% 1.6% 1.2% -1.5% -1.0% -0.5% 0.0% 0.5% 1.0% 1.5% 2.0% 2.5% 3.0% 3.5% 4.0% Spend Traffic NPD: Total Restaurant Spend/Traffic % Change vs. Year Ago 101.0 100.6 95 96 97 98 99 100 101 102 103 104 105 Sep-09 Sep-10 Sep-11 Sep-12 Sep-13 Sep-14 Sep-15 Sep-16 NRA Current Situation and Expectation Indices September 2009 - 2016 Current Situation Index Expectations Index
  • 6.
    © 2016 AllRights Reserved. Sysco Corporation. P A G E 6 Strong quarter in legacy business enhanced with the acquisition of Brakes Group  Reaping the benefits of multi- year foundational work  Brakes Group  Support growth with experienced and talented leadership team  Drive out transformative initiatives  Identify additional acquisition opportunities S Y S C O 1 Q 1 7 E A R N I N G S R E S U L T S 1 1 . 0 7 . 1 6 Supporting the success of our customers
  • 7.
  • 8.
    © 2016 AllRights Reserved. Sysco Corporation. P A G E 8 Operating performance achieved by continued strong execution on the key levers of our three-year plan S Y S C O 1 Q 1 7 E A R N I N G S R E S U L T S 1 1 . 0 7 . 1 6 1 See Non-GAAP reconciliations at the end of this presentation.  Sales growth: 0.8%  Gross Profit growth: 4.3%  Gross Margin expansion: 68 bps  Adjusted OPEX growth: 1.8%  Adjusted Operating Income growth: 8.4% U.S. Foodservice Operations1To Be Our Customers’ Most Valued and Trusted Business Partner • Accelerate local case growth • Improve margins Grow Gross Profit Leverage Supply Chain Costs Reduce Administrative Costs Enablers: Our People Business Technology Corporate Social Responsibility Achieve Financial Objectives
  • 9.
    © 2016 AllRights Reserved. Sysco Corporation. P A G E 9 Enhanced industry leading processes and improved brand performance drove GP growth and margin expansion S Y S C O 1 Q 1 7 E A R N I N G S R E S U L T S 1 1 . 0 7 . 1 6 Category Management Value Variety Innovation Revenue ManagementSysco Brand Mix Management Disciplined Approach Tools and Insights
  • 10.
    © 2016 AllRights Reserved. Sysco Corporation. P A G E 1 0 Continued focus to implement sales training and support tools enabling our customers to succeed S Y S C O 1 Q 1 7 E A R N I N G S R E S U L T S 1 1 . 0 7 . 1 6  Investing in our Sales Organization through training programs: local, chain, leadership  Reducing non-value added work from our sales teams  Strategically deploying our resources by leveraging data to capitalize on the greatest opportunities  Developing flexible order channels
  • 11.
    © 2016 AllRights Reserved. Sysco Corporation. P A G E 1 1 Solid expense management led to a $0.04 improvement in cost per case1 S Y S C O 1 Q 1 7 E A R N I N G S R E S U L T S 1 1 . 0 7 . 1 6 t OPCO Productivity Standardize best practices in transportation and warehousing to improve quality, cost and safety t Fleet Excellence Right size fleet and optimize preventive maintenance and shop execution t Indirect Sourcing Strategically source $1B of indirect spend and increase purchasing compliance t Facilities Optimization Use best-in-class capacity planning to defer capital. Standardize maintenance, construction and real estate 1 See Non-GAAP reconciliations at the end of this presentation.
  • 12.
    © 2016 AllRights Reserved. Sysco Corporation. P A G E 1 2 International Foodservice Operations and SYGMA performing well S Y S C O 1 Q 1 7 E A R N I N G S R E S U L T S 1 1 . 0 7 . 1 6 1 See Non-GAAP reconciliations at the end of this presentation. SYGMA International Foodservice Operations1  Sales increased $1.3 billion  Adjusted Operating Income improved $50 million  Brakes – Positive results in U.K., France and Sweden  Canada – Effectively managing deflation and soft market environment  Continues to make progress against key business initiatives  Confidence in full year growth goals being achieved
  • 13.
  • 14.
    © 2016 AllRights Reserved. Sysco Corporation. P A G E 1 4 1Q17 Financial Highlights (including Brakes) Adjusted1 Reported $MM, except per share data FY17 YOY % Change FY17 YOY % Change Sales $13,969 11.2% $13,969 11.2% Gross Profit $2,692 20.3% $2,692 20.3% Operating Expense $2,065 19.3% $2,125 21.8% Operating Income $627 23.8% $567 14.9% Net Earnings $376 20.7% $324 32.5% Diluted EPS $0.67 28.8% $0.58 41.5% 1 See Non-GAAP reconciliations at the end of this presentation. S Y S C O 1 Q 1 7 E A R N I N G S R E S U L T S 1 1 . 0 7 . 1 6
  • 15.
    © 2016 AllRights Reserved. Sysco Corporation. P A G E 1 5 Strong operating performance Gross Profit growth continues to outpace OPEX growth  Performance is driven by commercial initiatives and strong management of expenses 1 See Non-GAAP reconciliations at the end of this presentation. S Y S C O 1 Q 1 7 E A R N I N G S R E S U L T S 1 1 . 0 7 . 1 6 6.0% 6.1% 3.1% 3.0% 2.3% 3.4% 4.1% 4.7% 5.0% 6.0% 6.8% 4.5% 2.2% 3.1% 1.8% 1.5% 1.7% 1.9% 0.0% 1.0% 2.0% 3.0% 4.0% 5.0% 6.0% 7.0% 8.0% 1Q15 2Q15 3Q15 4Q15 1Q16 2Q16 3Q16 4Q16 1Q17 Total Sysco Operating Leverage (excluding Brakes)1 GP growth OPEX growth
  • 16.
    © 2016 AllRights Reserved. Sysco Corporation. P A G E 1 6 Cash Flow & Balance Sheet  Cash flow  Cash from operations was $249 million, up approximately $510 million from last year  Free Cash Flow: $111 million, up approximately $492 million from last year  Net CAPEX: $138 million  Balance sheet  Net working capital days – improvement by 2.0 days year over year; 2.8 days vs. FY15  Driven by improvements in all three phases: AP, AR and Inventory 1 See Non-GAAP reconciliations at the end of this presentation. S Y S C O 1 Q 1 7 E A R N I N G S R E S U L T S 1 1 . 0 7 . 1 6 $(600) $(400) $(200) $- $200 $400 $600 $800 $1,000 $1,200 2013 2014 2015 2016 2017 2013 2014 2015 2016 2013 2014 2015 2016 2013 2014 2015 2016 Q1 Q2 Q3 Q4 Quarterly Cash Flow1 Net cash provided by operating activities (GAAP) Free Cash Flow (Non-GAAP)
  • 17.
    © 2016 AllRights Reserved. Sysco Corporation. P A G E 1 7 Business updates  Brakes Group  Accretion to adjusted EPS will be high-single-digits in FY 2017  Approximately $0.04 accretive for the first quarter1  Seasonality - Performance of the business is more heavily weighted to the first half of Sysco’s fiscal year  Fuel Update  Favorable benefit will lap in November  Enhancing our strategy using derivatives to hedge our exposure  Credit Facility  Upsizing our facility from $1.5 billion to $2.0 billion S Y S C O 1 Q 1 7 E A R N I N G S R E S U L T S 1 1 . 0 7 . 1 6 1 See Non-GAAP reconciliations at the end of this presentation.
  • 18.
    © 2016 AllRights Reserved. Sysco Corporation. P A G E 1 8 Summary  Quality quarter reflecting continued momentum from improved underlying business performance  Disciplined approach to case growth  Strong GP growth  Good cost management  Committed to serving our customers and delivering a high level of execution in all areas of our business S Y S C O 1 Q 1 7 E A R N I N G S R E S U L T S 1 1 . 0 7 . 1 6
  • 19.
  • 20.
    © 2016 AllRights Reserved. Sysco Corporation. P A G E 2 0 New Segment Reporting Structure S Y S C O 1 Q 1 7 E A R N I N G S R E S U L T S 1 1 . 0 7 . 1 6 Sysco Corporation and its Consolidated Subsidiaries COMPARATIVE SEGMENT DATA RECLASSIFIED FOR NEW SEGMENT REPORTING STRUCTURE (Unaudited) (In Thousands) · SYGMA - our chain restaurant distribution subsidiary; and In connection with the Acquisition, the company has reassessed its reportable segments based on how the chief operating decision maker assesses performance and allocated resources. Sysco's has aggregated its operating companies into four reportable segments as follows: Broadline operating companies distribute a full line of food products and a wide variety of non-food products to both traditional and chain restaurant customers, hospitals, schools, hotels, industrial caterers and other venues where foodservice products are served. SYGMA operating companies distribute a full line of food products and a wide variety of non-food products to certain chain restaurant customer locations. The following table provides our segment performance with prior year amounts reclassified to conform to the current year presentation. · U.S. Foodservice Operations - primarily includes U.S. Broadline, custom-cut meat companies, FreshPoint (our specialty produce companies) and European Imports (a specialty import company); · International Foodservice Operations - primarily includes broadline operations in Canada and Europe, including the Brakes Group, Bahamas, Mexico and Costa Rica as well as a company that distributes to international customers; · Other - primarily our hotel supply operations and our Sysco Ventures platform, which includes our suite of technology solutions that help support the business needs of our customers.
  • 21.
    © 2016 AllRights Reserved. Sysco Corporation. P A G E 2 1 New Segment Reporting Structure S Y S C O 1 Q 1 7 E A R N I N G S R E S U L T S 1 1 . 0 7 . 1 6 Sysco Corporation and its Consolidated Subsidiaries Non-GAAP Reconciliation (Unaudited) Impact of Certain Items (In Thousands, Except for Share and Per Share Data) U.S. Foodservice Operations Sales (GAAP) $ 9,481,115 $ 9,407,923 $ 9,135,326 $ 9,037,417 $ 10,195,775 $ 37,776,442 Gross Profit (GAAP) 1,913,116 1,834,354 1,759,390 1,765,279 2,054,413 7,413,436 Gross Margin (GAAP) 20.2% 19.5% 19.3% 19.5% 20.1% 19.6% Operating expenses (GAAP) $ 1,167,884 $ 1,147,685 $ 1,134,174 $ 1,121,953 $ 1,237,692 $ 4,641,504 Impact of restructuring costs - (873) (561) (742) (1,175) (3,351) Impact of acquisition-related costs (2) - - - - - - Operating expenses adjusted for certain items (Non-GAAP) $ 1,167,884 $ 1,146,812 $ 1,133,613 $ 1,121,211 $ 1,236,517 $ 4,638,153 Operating income (GAAP) $ 745,231 $ 686,669 $ 625,216 $ 643,326 $ 816,721 $ 2,771,932 Impact of restructuring costs - 873 561 742 1,175 3,351 Impact of acquisition-related costs (2) - - - - - - Operating income adjusted for certain items (Non-GAAP) $ 745,231 $ 687,542 $ 625,777 $ 644,068 $ 817,896 $ 2,775,283 International Foodservice Operations Sales (GAAP) $ 2,728,360 $ 1,390,259 $ 1,280,775 $ 1,251,815 $ 1,513,361 $ 5,436,209 Gross Profit (GAAP) 598,406 245,462 221,198 210,682 261,600 938,942 Gross Margin (GAAP) 21.9% 17.7% 17.3% 16.8% 17.3% 17.3% Operating expenses (GAAP) $ 518,971 $ 193,542 $ 178,986 $ 177,661 $ 211,594 $ 761,783 Impact of restructuring costs (1) (4,680) (1,243) (586) (308) (6,808) (8,945) Impact of acquisition-related costs (2) (19,498) - - - - - Operating expenses adjusted for certain items (Non-GAAP) $ 494,793 $ 192,299 $ 178,400 $ 177,353 $ 204,786 $ 752,838 Operating income (GAAP) $ 79,435 $ 51,920 $ 42,212 $ 33,021 $ 50,006 $ 177,159 Impact of restructuring costs (1) 4,680 1,243 586 308 6,808 8,945 Impact of acquisition-related costs (2) 19,498 - - - - - Operating income adjusted for certain items (Non-GAAP) $ 103,613 $ 53,163 $ 42,798 $ 33,329 $ 56,814 $ 186,104 SYGMA Sales (GAAP) $ 1,504,692 $ 1,445,905 $ 1,506,836 $ 1,497,365 $ 1,652,222 $ 6,102,328 Gross Profit (GAAP) 114,976 110,320 111,790 114,657 119,214 455,981 Gross Margin (GAAP) 7.64% 7.63% 7.42% 7.66% 7.22% 7.47% Operating expenses (GAAP) $ 110,068 $ 105,197 $ 106,131 $ 105,313 $ 111,871 $ 428,512 Impact of restructuring costs - (5) (77) (20) - (102) Impact of acquisition-related costs (2) - - - - - - Operating expenses adjusted for certain items (Non-GAAP) $ 110,068 $ 105,192 $ 106,054 $ 105,293 $ 111,871 $ 428,410 Operating income (GAAP) $ 4,908 $ 5,123 $ 5,659 $ 9,344 $ 7,343 $ 27,469 Impact of restructuring costs - 5 77 20 - 102 Impact of acquisition-related costs (2) - - - - - - Operating income adjusted for certain items (Non-GAAP) $ 4,908 $ 5,128 $ 5,736 $ 9,364 $ 7,343 $ 27,571 53-Week July 2, 2016 Q1 FY16 Q2 FY16 Q3 FY16 Q4 FY16 Sep. 26, 2015 Dec. 26, 2015 Mar. 26, 2016 July 2, 2016 Q1 FY17 Oct. 1, 2016
  • 22.
    © 2016 AllRights Reserved. Sysco Corporation. P A G E 2 2 New Segment Reporting Structure S Y S C O 1 Q 1 7 E A R N I N G S R E S U L T S 1 1 . 0 7 . 1 6 Sysco Corporation and its Consolidated Subsidiaries Non-GAAP Reconciliation (Unaudited) Impact of Certain Items (In Thousands, Except for Share and Per Share Data) Other Sales (GAAP) $ 254,486 $ 318,524 $ 230,689 $ 216,194 $ 286,532 $ 1,051,939 Gross Profit (GAAP) 68,283 58,873 56,379 56,242 69,072 240,566 Gross Margin (GAAP) 26.83% 18.48% 24.44% 26.01% 24.11% 22.87% Operating expenses (GAAP) $ 60,282 $ 48,103 $ 49,999 $ 49,626 $ 60,252 $ 207,980 Impact of restructuring costs - (11) (52) (52) (52) (167) Operating expenses adjusted for certain items (Non-GAAP) $ 60,282 $ 48,092 $ 49,947 $ 49,574 $ 60,200 $ 207,813 Operating income (GAAP) $ 8,001 $ 10,770 $ 6,380 $ 6,616 $ 8,820 $ 32,586 Impact of restructuring costs - 11 52 52 52 167 Operating income adjusted for certain items (Non-GAAP) $ 8,001 $ 10,781 $ 6,432 $ 6,668 $ 8,872 $ 32,753 Corporate Gross Profit (GAAP) $ (2,861) $ (11,363) $ 8,472 $ (3,884) $ (1,707) $ (8,482) Operating expenses (GAAP) $ 267,880 $ 249,993 $ 254,941 $ 310,666 $ 334,584 $ 1,150,184 Impact of restructuring costs (3) (33,604) (1,057) (3,005) (58,320) (48,185) (110,568) Impact of acquisition-related costs (4) (2,212) (9,816) - (586) (25,212) (35,615) Operating expenses adjusted for certain items (Non-GAAP) $ 232,064 $ 239,120 $ 251,936 $ 251,759 $ 261,187 $ 1,004,002 Operating income (GAAP) $ (270,742) $ (261,008) $ (246,478) $ (314,550) $ (336,291) $ (1,158,327) Impact of restructuring costs (3) 33,604 1,057 3,005 58,320 48,185 110,568 Impact of acquisition-related costs (4) 2,212 9,816 - 586 25,212 35,615 Operating income adjusted for certain items (Non-GAAP) $ (234,925) $ (250,135) $ (243,473) $ (255,643) $ (262,894) $ (1,012,145) Total Sysco Sales (GAAP) $ 13,968,654 $ 12,562,611 $ 12,153,626 $ 12,002,791 $ 13,647,890 $ 50,366,919 Gross Profit (GAAP) 2,691,919 2,237,646 2,157,229 2,142,976 2,502,592 9,040,443 Gross Margin (GAAP) 19.27% 17.81% 17.75% 17.85% 18.34% 17.95% Operating expenses (GAAP) $ 2,125,086 $ 1,744,520 $ 1,724,231 $ 1,765,219 $ 1,955,993 $ 7,189,963 Impact of restructuring costs (1) (3) (38,285) (3,189) (4,281) (59,443) (56,220) (123,134) Impact of acquisition-related costs (2) (4) (21,710) (9,816) - (586) (25,212) (35,615) Operating expenses adjusted for certain items (Non-GAAP) $ 2,065,091 $ 1,731,515 $ 1,719,950 $ 1,705,189 $ 1,874,561 $ 7,031,215 Operating income (GAAP) $ 566,834 $ 493,474 $ 432,989 $ 377,757 $ 546,599 $ 1,850,819 Impact of restructuring costs (1) (3) 38,285 3,189 4,281 59,443 56,220 123,134 Impact of acquisition-related costs (2) (4) 21,710 9,816 - 586 25,212 35,615 Operating income adjusted for certain items (Non-GAAP) $ 626,828 $ 506,479 $ 437,270 $ 437,787 $ 628,031 $ 2,009,567 53-Week July 2, 2016 (1) Fiscal 2017 includes restructuring expenses within our Brakes operations. (2) Fiscal 2017 Includes $19 million related to intangible amortization expense from the Brakes acquisition which is included in the results of Brakes. (4) Fiscal 2017 Includes $2 million related to transaction costs from the Brakes acquisition. Fiscal 2016 includes US Foods merger termination costs. (3) Includes $28 million in accelerated depreciation associated with our revised business technology strategy, professional fees on 3-year financial objectives and costs to convert to legacy systems in conjunction with our revised business technology strategy. Q1 FY16 Q2 FY16 Q3 FY16 Q4 FY16 Sep. 26, 2015 Dec. 26, 2015 Mar. 26, 2016 July 2, 2016 Q1 FY17 Oct. 1, 2016
  • 23.
    © 2016 AllRights Reserved. Sysco Corporation. P A G E 2 3 Impact of Certain Items Sysco Corporation and its Consolidated Subsidiaries Non-GAAP Reconciliation (Unaudited) Impact of Certain Items Sysco’s results of operations are impacted by restructuring costs consisting of (1) severance charges, (2) professional fees related to our three-year strategic plan, (3) restructuring expenses within our Brakes Group operations and (4) expenses associated with our revised business technology strategy announced in fiscal 2016, as a result of which we recorded accelerated depreciation on our existing system and incurred costs to convert to legacy systems. Our results of operations are also impacted by the following acquisition-related items: (1) intangible amortization expense (2) transaction costs and (3) integration costs. All acquisition-related costs in fiscal 2017 that have been excluded relate to the Acquisition. Fiscal 2016 acquisition-related costs, however, include (i) termination costs in connection with the merger that had been proposed with US Foods, Inc. (US Foods) and (ii) financing costs related to the senior notes that were issued in fiscal 2015 to fund the proposed US Foods merger. These senior notes were redeemed in the first quarter of fiscal 2016, triggering a redemption loss of $86.5 million, and we incurred interest on these notes through the redemption date. The Acquisition also resulted in non-recurring tax expense in fiscal 2017, primarily from non-deductible transaction costs. These fiscal 2017 and fiscal 2016 items are collectively referred to as "Certain Items.“ Management believes that adjusting its operating expenses, operating income, operating margin as a percentage of sales, interest expense, net earnings and diluted earnings per share to remove these Certain Items provides an important perspective with respect to our underlying business trends and results and provides meaningful supplemental information to both management and investors that (1) is indicative of the performance of the company's underlying operations and facilitates comparisons on a year-over-year basis and (2) removes those items that are difficult to predict and are often unanticipated, and which as a result, are difficult to include in analysts' financial models and our investors' expectations with any degree of specificity. Although Sysco has a history of growth through acquisitions, the Brakes Group is significantly larger than the companies historically acquired by Sysco, with a proportionately greater impact on Sysco’s consolidated financial statements. Accordingly, Sysco is excluding from its non-GAAP financial measures for the relevant period solely for those acquisition costs specific to the Acquisition. We believe this approach significantly enhances the comparability of Sysco’s results for the first quarter of fiscal 2017 to the same period in fiscal 2016. Also, given the significance of the Acquisition, management believes that presenting Sysco’s financial measures, excluding the Brakes Group operating results, enhances comparability of the period over period financial performance of Sysco’s legacy business and allows investors to more effectively measure Sysco’s progress against the financial goals under Sysco’s three year strategic plan. Set forth below is a reconciliation of sales, operating expenses, operating income, interest expense, net earnings and diluted earnings per share to adjusted results for these measures for the periods presented. Individual components of diluted earnings per share may not add to the total presented due to rounding. Adjusted diluted earnings per share is calculated using adjusted net earnings divided by diluted shares outstanding. S Y S C O 1 Q 1 7 E A R N I N G S R E S U L T S 1 1 . 0 7 . 1 6
  • 24.
    © 2016 AllRights Reserved. Sysco Corporation. P A G E 2 4 Impact on Certain Items S Y S C O 1 Q 1 7 E A R N I N G S R E S U L T S 1 1 . 0 7 . 1 6 Sysco Corporation and its Consolidated Subsidiaries Non-GAAP Reconciliation (Unaudited) Impact of Certain Items and Brakes (In Thousands, Except for Share and Per Share Data) 13-Week Period Change in Dollars 13-Week Period % Change Sales $ 13,968,654 $ 12,562,611 $ 1,406,043 11.2% Impact of Brakes (1,283,524) - (1,283,524) NM Sales excluding the impact of Brakes (Non-GAAP) $ 12,685,130 $ 12,562,611 $ 122,519 1.0% Gross profit $ 2,691,919 $ 2,237,995 $ 453,924 20.3% Impact of Brakes (343,051) - (343,051) NM Gross profit excluding the impact of Brakes (Non-GAAP) $ 2,348,868 $ 2,237,995 $ 110,873 5.0% Gross margin 19.27% 17.81% 1.46% 8.2% Impact of Brakes 0.75% - 0.75% NM Gross margin excluding the impact of Brakes (Non-GAAP) 18.52% 17.81% 0.70% 3.9% Operating expenses (GAAP) $ 2,125,086 $ 1,744,521 $ 380,565 21.8% Impact of restructuring costs (1) (38,285) (3,189) (35,096) NM Impact of acquisition-related costs (2) (21,710) (9,816) (11,894) 121.2% Operating expenses adjusted for certain items (Non-GAAP) $ 2,065,091 $ 1,731,516 $ 333,575 19.3% Impact of Brakes (322,843) - (322,843) NM Impact of Brakes restructuring costs (3) 3,074 - 3,074 NM Impact of Brakes acquisition-related costs (2) 19,498 - 19,498 NM Operating expenses adjusted for certain items and excluding the impact of Brakes (Non-GAAP) $ 1,764,820 $ 1,731,516 $ 33,304 1.9% Operating income (GAAP) $ 566,833 $ 493,474 $ 73,359 14.9% Impact of restructuring costs (1) 38,285 3,189 35,096 NM Impact of acquisition-related costs (2) 21,710 9,816 11,894 121.2% Operating income adjusted for certain items -GAAP) $ 626,828 $ 506,479 $ 120,349 23.8% Impact of Brakes (20,208) - (20,208) NM Impact of Brakes restructuring costs (3) (3,074) - (3,074) NM Impact of Brakes acquisition-related costs (2) (19,498) - (19,498) NM Operating income adjusted for certain items and excluding the impact of Brakes (Non-GAAP) $ 584,048 $ 506,479 $ 77,569 15.3% 13-Week Period Ended Oct. 1, 2016 13-Week Period Ended Sep 26, 2015
  • 25.
    © 2016 AllRights Reserved. Sysco Corporation. P A G E 2 5 Impact on Certain Items S Y S C O 1 Q 1 7 E A R N I N G S R E S U L T S 1 1 . 0 7 . 1 6 Sysco Corporation and its Consolidated Subsidiaries Non-GAAP Reconciliation (Unaudited) Impact of Certain Items and Brakes (In Thousands, Except for Share and Per Share Data) 13-Week Period Change in Dollars 13-Week Period % Change Operating margin (GAAP) 4.06% 3.93% 0.13% 3.3% Operating margin excluding Certain Items (Non-GAAP) 4.49% 4.03% 0.46% 11.3% Operating margin excluding Certain Items and Brakes (Non-GAAP) 4.60% 4.03% 0.57% 14.2% Interest expense (GAAP) $ 73,623 $ 126,907 $ (53,284) -42.0% Impact of acquisition financing costs (4) - (94,835) 94,835 -100.0% Interest expense adjusted for certain items (Non-GAAP) $ 73,623 $ 32,072 $ 41,551 129.6% Net earnings (GAAP) $ 323,887 $ 244,420 $ 79,467 32.5% Impact of restructuring cost (1) 38,285 3,189 35,096 NM Impact of acquisition-related costs (2) 21,710 9,816 11,894 121.2% Impact of acquisition financing costs (4) - 94,835 (94,835) -100.0% Tax impact of restructuring cost (5) (3,593) (1,198) (2,395) 199.9% Tax impact of acquisition-related costs (5) (4,169) (3,688) (481) 13.0% Tax impact of acquisition financing costs (5) - (35,632) 35,632 -100.0% Net earnings adjusted for certain items(Non-GAAP) $ 376,120 $ 311,742 $ 64,378 20.7% Impact of Brakes (18,852) - (18,852) NM Impact of Brakes restructuring costs (3) (2,446) - (2,446) NM Impact of Brakes acquisition-related costs (2) (15,514) - (15,514) NM Impact of interest expense on debt issued for the Brakes acquisition (6) 19,735 - 19,735 NM Tax impact of interest expense on debt issued for the Brakes acquisition (5) (7,460) - (7,460) NM Net earnings adjusted for certain items and excluding the impact of Brakes (Non-GAAP) $ 351,583 $ 311,742 $ 39,841 12.8% Diluted earnings per share (GAAP) $ 0.58 $ 0.41 $ 0.17 41.5% Impact of restructuring costs (1) 0.07 - 0.07 NM Impact of acquisition-related costs (2) 0.04 0.02 0.02 144.8% Impact of acquisition financing costs (4) - 0.16 (0.16) -100.0% Tax impact of restructuring cost (5) (0.01) - (0.01) NM Tax impact of acquisition-related costs (5) (0.01) (0.01) (0.00) 62.9% Tax impact of acquisition financing costs (5) - (0.06) 0.06 -100.0% Diluted EPS adjusted for certain items(Non-GAAP) (7) $ 0.67 $ 0.52 $ 0.15 28.8% Impact of Brakes (0.03) - (0.03) NM Impact of Brakes restructuring costs (3) (0.01) - (0.01) NM Impact of Brakes acquisition-related costs (2) (0.02) - (0.02) NM Impact of interest expense on debt issued for the Brakes acquisition (6) 0.04 - 0.04 NM Tax impact of interest expense on debt issued for the Brakes acquisition (5) (0.01) - (0.01) NM Diluted EPS adjusted for certain items and excluding the impact of Brakes (Non-GAAP) (7) $ 0.63 $ 0.52 $ 0.11 20.4% Diluted shares outstanding 560,954,068 600,789,913 13-Week Period Ended Oct. 1, 2016 13-Week Period Ended Sep 26, 2015
  • 26.
    © 2016 AllRights Reserved. Sysco Corporation. P A G E 2 6 Impact on Certain Items S Y S C O 1 Q 1 7 E A R N I N G S R E S U L T S 1 1 . 0 7 . 1 6 NM represents that the percentage change is not meaningful (7) Individual components of diluted earnings per share may not add to the total presented due to rounding. Total diluted earnings per share is calculated using adjusted net earnings divided by diluted shares outstanding. (1) Includes $28 million in accelerated depreciation associated with our revised business technology strategy and $10 million related to severance charges, professional fees on 3-year financial objectives, restructuring expenses within our Brakes operations and costs to convert to legacy systems in conjunction with our revised business technology strategy. (2) Fiscal 2017 Includes $19 million related to intangible amortization expense from the Brakes acquisition which is included in the results of Brakes and $2 million in transaction costs. Fiscal 2016 includes US Foods merger termination costs. (3) Includes Brakes Acquisition restructuring charges (4) Includes US Foods financing costs applicable to fiscal 2016. (5) The tax impact of adjustments for Certain Items are calculated by multiplying the pretax impact of each Certain Item by the statutory rates in effect for each jurisdiction where the Certain Item was incurred. The adjustments also include $7 million in non-deductible transaction costs and $4 million in other one-time costs related to the Brakes acquisition. (6) Includes interest expense arising from debt issued to finance the Brakes acquisition.
  • 27.
    © 2016 AllRights Reserved. Sysco Corporation. P A G E 2 7 Cost per Case S Y S C O 1 Q 1 7 E A R N I N G S R E S U L T S 1 1 . 0 7 . 1 6 Sysco Corporation and its Consolidated Subsidiaries Cost per Case 13-Week Period Change (Decrease) increase in cost per case $ (0.04) Impact of Certain Items (1) - (Decrease) increase in adjusted cost per case (Non-GAAP basis) $ (0.04) Impact of fuel prices (0.04) (Decrease) increase in adjusted cost per case (Non-GAAP basis) $ - Non-GAAP Reconciliation (Unaudited) Cost per case is an important metric management uses to measure our expense performance. This metric is calculated by taking the total operating expense of our U.S. Broadline companies, divided by the number of cases sold. Adjusted cost per case is calculated similarly; however, the operating expense component excludes charges from severance, which are the Certain Items applicable to these companies, divided by the number of cases sold. For both the first quarter of fiscal 2017 and 2016, the adjustment for Certain Items was not significant enough to produce a different value on an adjusted basis. Our corporate expenses are not included in the cost per cases metrics because the metric is a measure of efficiency in our operations. We seek to grow our sales and either minimize or reduce our costs on a per case basis. Our U.S. Broadline operations represent approximately 90% of the U.S. Foodservice Operations segment's sales and nearly 85% of its operating expenses. Our cost per case is also impacted by lower fuel prices year over year and is significantly lowering our cost per case results. Sysco considers adjusted cost per case to be a measure that provides useful information to management and investors about Sysco's expense management. An analysis of any non-GAAP financial measure should be used in conjunction with results presented in accordance with GAAP. In the table that follows, the change in adjusted cost per case is reconciled to cost per case for the first quarter of fiscal 2017 as compared to the first quarter of fiscal 2016. (1) The impact of Certain Items excludes severance charges that were applicable in both periods.
  • 28.
    © 2016 AllRights Reserved. Sysco Corporation. P A G E 2 8 Free Cash Flow S Y S C O 1 Q 1 7 E A R N I N G S R E S U L T S 1 1 . 0 7 . 1 6 Sysco Corporation and its Consolidated Subsidiaries Non-GAAP Reconciliation (Unaudited) Free Cash Flow (In Thousands) Net cash provided by operating activities (GAAP) $ 248,674 Additions to plant and equipment (142,255) Proceeds from sales of plant and equipment 4,261 Free Cash Flow (Non-GAAP) $ 110,680 Net cash provided by operating activities (GAAP) $ (261,482) $ 730,363 $ 520,100 $ 944,161 $ 1,933,142 Additions to plant and equipment (121,243) (126,990) (112,650) (166,463) (527,346) Proceeds from sales of plant and equipment 1,506 9,321 1,796 10,888 23,511 Free Cash Flow (Non-GAAP) $ (381,219) $ 612,694 $ 409,246 $ 788,586 $ 1,429,307 Net cash provided by operating activities (GAAP) $ 62,618 $ 389,820 $ 408,061 $ 694,985 $ 1,555,484 Additions to plant and equipment (118,821) (179,247) (139,218) (105,544) (542,830) Proceeds from sales of plant and equipment 1,126 1,004 13,274 9,068 24,472 Free Cash Flow (Non-GAAP) $ (55,077) $ 211,577 $ 282,117 $ 598,509 $ 1,037,126 Net cash provided by operating activities (GAAP) $ 169,229 $ 288,935 $ 389,900 $ 644,751 $ 1,492,815 Additions to plant and equipment (135,749) (134,683) (117,019) (135,755) (523,206) Proceeds from sales of plant and equipment 10,573 12,907 215 2,095 25,790 Free Cash Flow (Non-GAAP) $ 44,053 $ 167,159 $ 273,096 $ 511,091 $ 995,399 Net cash provided by operating activities (GAAP) $ 213,201 $ 173,584 $ 372,623 $ 752,186 $ 1,511,594 Additions to plant and equipment (155,673) (105,903) (111,472) (138,814) (511,862) Proceeds from sales of plant and equipment 1,393 1,836 8,886 3,412 15,527 Free Cash Flow (Non-GAAP) $ 58,921 $ 69,517 $ 270,037 $ 616,784 $ 1,015,259 July 2, 2016 Oct. 1, 2016 Q1 FY16 Q2 FY16 Q3 FY16 Q4 FY16 53-Week Period Sep. 26, 2015 Dec. 26, 2015 Mar. 26, 2016 July 2, 2016 52-Week Period Sep. 27, 2014 Dec. 27, 2014 Mar. 28, 2015 June 27, 2015 June 27, 2015 Q1 FY15 Q2 FY15 Q3 FY15 Q4 FY15 June 28, 2014 June 28, 2014 Q1 FY14 Q2 FY14 Q3 FY14 Q4 FY14 Q1 FY17 Free cash flow represents net cash provided from operating activities less purchases of plant and equipment and includes proceeds from sales of plant and equipment. Sysco considers free cash flow to be a liquidity measure that provides useful information to management and investors about the amount of cash generated by the business after the purchases and sales of buildings, fleet, equipment and technology, which may potentially be used to pay for, among other things, strategic uses of cash including dividend payments, share repurchases and acquisitions. However, free cash flow may not be available for discretionary expenditures, as it may be necessary that we use it to make mandatory debt service or other payments. Free cash flow should not be used as a substitute for the most comparable GAAP measure in assessing the company’s liquidity for the periods presented. An analysis of any non-GAAP financial measure should be used in conjunction with results presented in accordance with GAAP. In the table that follows, free cash flow for each period presented is reconciled to net cash provided by operating activities. 52-Week Period June 29, 2013Sep. 29, 2012 Dec. 29, 2012 Mar. 30, 2013 June 29, 2013 Q1 FY13 Q2 FY13 Q3 FY13 Q4 FY13 52-Week Period Sep. 28, 2013 Dec. 28, 2013 Mar. 29, 2014