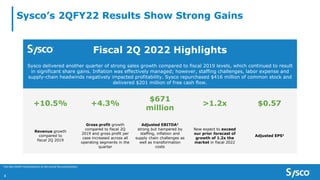
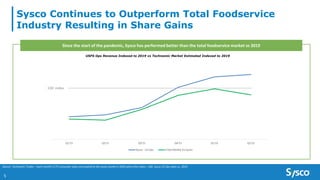
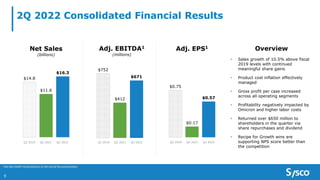
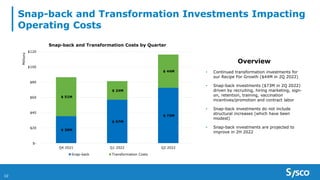
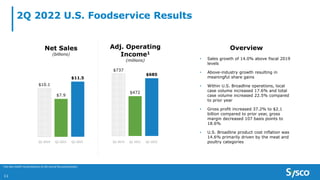
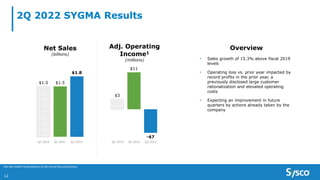
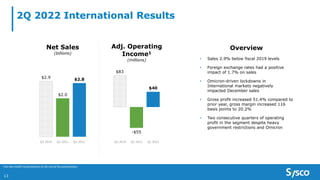
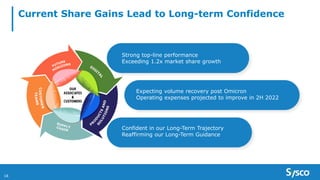
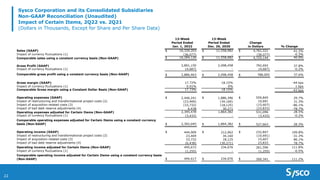
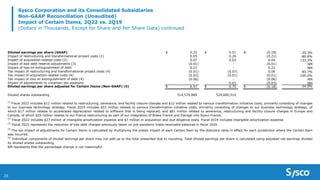
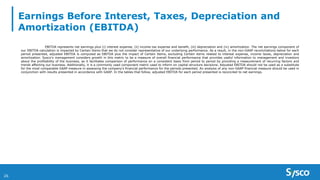
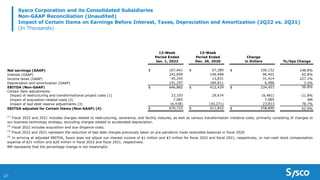
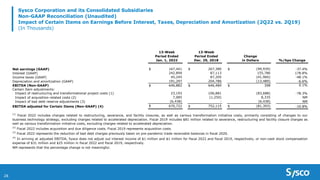
SlideShare a Scribd company logo
1 of 33
Download to read offline
Sysco 2Q FY22 Earnings Results
February 8, 2022
Forward Looking Statements
Statements made in this presentation or in our earnings call for the second quarter of fiscal 2022 that look forward in time or that express management’s beliefs, expectations or hopes are forward-looking statements within the meaning of the
Private Securities Litigation Reform Act of 1995. Such forward-looking statements reflect the views of management at the time such statements are made and are subject to a number of risks, uncertainties, estimates, and assumptions that may
cause actual results to differ materially from current expectations. These statements include statements concerning: the effect, impact, potential duration or other implications of the coronavirus (“COVID-19”) pandemic and any expectations we
may have with respect thereto, including the extent and duration of lockdowns in the U.S. and Europe; our expectations regarding the impact of the Omicron variant on operating results and our expectations regarding our ability to return to our
growth pattern of improved sales and volume performance as the Omicron variant recedes; our expectations regarding the pace and timing of the business recovery in the U.S. and Europe; our expectations that our transformational agenda will
drive long-term growth; our expectations regarding the continuation of an inflationary environment; our belief that incremental expenses within our supply chain, driven by labor costs, will improve over time; our expectations regarding the
impact of our Recipe for Growth strategy and our belief that this strategy will uniquely position Sysco to win in the marketplace for the long-term; our expectations regarding Sysco’s ability to outperform the market in future periods; our
expectations that our strategic priorities will enable us to grow faster than the market; our expectations regarding our efforts to reduce overtime rates and the incremental investments in hiring; our expectations regarding our ability to move our
newer associates up the productivity curve over time; our belief that our approach to ensure we can ship on-time and in full will benefit our relationship with our customers for the long-term and positively impact retention and growth; our
expectations regarding the impact of our growth initiatives and their ability to enable Sysco to consistently outperform the market; our expectations regarding the impact of the Greco and Sons acquisition on our business; our expectations
regarding our ability to grow faster than the total market in fiscal 2022 and to exceed our growth target for fiscal 2022; our expectations regarding the expansion of our Sysco Your Way initiative; our expectations regarding labor costs in the
fiscal third quarter; our ability to deliver against our strategic priorities; economic trends in the United States and abroad; our plans to make continued capital investments over the next three fiscal years in our technology, fleet and buildings; our
expectations regarding our dividend payments in calendar year 2022 and in future periods; our future growth; our expectations regarding profits and sales in fiscal 2022; the pace of implementation of our business transformation initiatives; our
expectations regarding our adjusted earnings per share growth in fiscal 2024; our expectations regarding our earnings per share in fiscal 2022; our expectations regarding our performance in the fiscal third and fourth quarters; our plans to
improve associate retention, training and productivity; our belief that our Recipe for Growth transformation is creating capabilities that will help us profitably grow for the long term; our belief in our ability to grow our share profitably and to
become more efficient; and our expectations regarding the decline of snap-back costs in the fiscal third quarter.
The success of our plans and expectations regarding our operating performance are subject to the general risks associated with our business, including the risks of interruption of supplies due to lack of long-term contracts, severe weather, crop
conditions, work stoppages, intense competition, technology disruptions, dependence on large, long-term regional and national customers, inflation risks, the impact of fuel prices, adverse publicity, labor issues, political or financial instability,
trade restrictions, tariffs, currency exchange rates, transport capacity and costs and other factors relating to foreign trade, any or all of which could delay our receipt of product or increase our input costs. Risks and uncertainties also include the
impact and effects of public health crises, pandemics and epidemics, such as the COVID-19 pandemic, and the adverse impact thereof on our business, financial condition and results of operations, including, but not limited to, our growth, product
costs, supply chain, labor availability, logistical capabilities, customer demand for our products and industry demand generally, consumer spending, our liquidity, the price of our securities and trading markets with respect thereto, our credit
ratings, our ability to maintain compliance with the covenants in our credit agreement, our ability to access capital markets, and the global economy and financial markets generally. Risks and uncertainties also include risks impacting the
economy generally, including the risks that the current general economic conditions will deteriorate, or consumer confidence in the economy or consumer spending, particularly on food-away-from-home, may decline. Market conditions may not
improve. Competition and the impact of GPOs may reduce our margins and make it difficult for us to maintain our market share, growth rate and profitability. We may not be able to fully compensate for increases in fuel costs, and fuel hedging
arrangements intended to contain fuel costs could result in above market fuel costs. Our ability to meet our long-term strategic objectives depends on our ability to grow gross profit, leverage our supply chain costs and reduce administrative
costs. This will depend largely on the success of our various business initiatives, including efforts related to revenue management, expense management, our digital e-commerce strategy and any efforts related to restructuring or the reduction of
administrative costs. There are various risks related to these efforts, including the risk that if sales from our locally managed customers do not grow at the same rate as sales from regional and national customers, or if we are unable to continue
to accelerate local case growth, our gross margins may decline; the risk that we are unlikely to be able to predict inflation over the long term, and lower inflation is likely to produce lower gross profit; the risk that our efforts to mitigate increases
in warehouse costs may be unsuccessful; the risk that we may not be able to accelerate and/or identify additional administrative cost savings in order to compensate for any gross profit or supply chain cost leverage challenges; the risk that these
efforts may not provide the expected benefits in our anticipated time frame, if at all, and may prove costlier than expected; the risk that the actual costs of any initiatives may be greater or less than currently expected; and the risk of adverse
effects to our business, results of operations and liquidity if past and future undertakings, and the associated changes to our business, do not prove to be cost effective or do not result in the cost savings and other benefits at the levels that we
anticipate. Our plans related to and the timing of any initiatives are subject to change at any time based on management’s subjective evaluation of our overall business needs. If we are unable to realize the anticipated benefits from our efforts,
we could become cost disadvantaged in the marketplace, and our competitiveness and our profitability could decrease. Adverse publicity about us or lack of confidence in our products could negatively impact our reputation and reduce earnings.
Capital expenditures may vary based on changes in business plans and other factors, including risks related to the implementation of various initiatives, the timing and successful completion of acquisitions, construction schedules and the
possibility that other cash requirements could result in delays or cancellations of capital spending. Periods of significant or prolonged inflation or deflation, either overall or in certain product categories, can have a negative impact on us and our
customers, as high food costs can reduce consumer spending in the food-away-from-home market, and may negatively impact our sales, gross profit, operating income and earnings, and periods of deflation can be difficult to manage effectively.
Fluctuations in inflation and deflation, as well as fluctuations in the value of foreign currencies, are beyond our control and subject to broader market forces. Expanding into international markets presents unique challenges and risks, including
compliance with local laws, regulations and customs and the impact of local political and economic conditions, including the impact of Brexit and the “yellow vest” protests in France against a fuel tax increase, pension reform and the French
government, and such expansion efforts may not be successful. Any business that we acquire may not perform as expected, and we may not realize the anticipated benefits of our acquisitions. Expectations regarding the financial statement
impact of any acquisitions may change based on management’s subjective evaluation. A divestiture of one or more of our businesses may not provide the anticipated effects on our operations. Meeting our dividend target objectives depends on
our level of earnings, available cash and the success of our various strategic initiatives. Changes in applicable tax laws or regulations and the resolution of tax disputes could negatively affect our financial results. We rely on technology in our
business and any cybersecurity incident, other technology disruption or delay in implementing new technology could negatively affect our business and our relationships with customers. For a discussion of additional factors impacting Sysco’s
business, see our Annual Report on Form 10-K for the year ended July 3, 2021, as filed with the SEC, and our subsequent filings with the SEC. We do not undertake to update our forward-looking statements, except as required by applicable law.
2
KEVIN HOURICAN
President & CEO
Sysco’s 2QFY22 Results Show Strong Gains
Fiscal 2Q 2022 Highlights
Sysco delivered another quarter of strong sales growth compared to fiscal 2019 levels, which continued to result
in significant share gains. Inflation was effectively managed; however, staffing challenges, labor expense and
supply-chain headwinds negatively impacted profitability. Sysco repurchased $416 million of common stock and
delivered $201 million of free cash flow.
+10.5% +4.3%
$671
million
>1.2x $0.57
Revenue growth
compared to
fiscal 2Q 2019
Gross profit growth
compared to fiscal 2Q
2019 and gross profit per
case increased across all
operating segments in the
quarter
Adjusted EBITDA1
strong but hampered by
staffing, inflation and
supply chain challenges as
well as transformation
costs
Now expect to exceed
our prior forecast of
growth of 1.2x the
market in fiscal 2022
Adjusted EPS1
4
1 See Non-GAAP reconciliations at the end of the presentation.
Sysco Continues to Outperform Total Foodservice
Industry Resulting in Share Gains
5
Source: Technomic Tindex – Each month’s $ FS consumer sales correspond to the same month in 2019 where the index = 100. Sysco US Ops sales vs. 2019
USFS Ops Revenue Indexed to 2019 vs Technomic Market Estimated Indexed to 2019
Since the start of the pandemic, Sysco has performed better than the total foodservice market vs 2019
Q1'21 Q2'21 Q3'21 Q4'21 Q1'22 Q2'22
Sysco - US Ops Total Market Ex-Sysco
100 index
No Sysco
Sysco Only
Sysco is Growing the Number of Exclusive Independent
Customers; Number of Customers Not Yet Using Sysco is
Steadily Declining
Source: NPD
6
28.0%
28.5%
29.0%
29.5%
30.0%
30.5%
31.0%
31.5%
32.0%
53.0%
53.5%
54.0%
54.5%
55.0%
55.5%
56.0%
56.5%
57.0%
Feb
2020
Mar
2020
Apr
2020
May
2020
Jun
2020
Jul
2020
Aug
2020
Sep
2020
Oct
2020
Nov
2020
Dec
2020
Jan
2021
Feb
2021
Mar
2021
Apr
2021
May
2021
Jun
2021
Jul
2021
Aug
2021
Sep
2021
Oct
2021
Nov
2021
Dec
2021
No Sysco Sysco Only
Sysco is Well Positioned for Long-Term Growth
Acceleration
7
202
1
• Sales growth of 10.5% above fiscal 2019 levels with continued meaningful
share gains
• Gross profit per case increased across all operating segments in the quarter
• Actively managed cost inflation, staffing and supply chain challenges
• Expect to exceed our prior forecast of growth of 1.2x the industry in fiscal
2022
• Recipe for Growth driving market share gains and industry leading NPS
scores
• Returned over $650 million to shareholders in the quarter via share
repurchases and dividends
AARON ALT
EVP & CFO
2Q 2022 Consolidated Financial Results
9
$14.8
$11.6
$16.3
Net Sales
(billions)
$752
$412
$671
Adj. EBITDA1
(millions)
$0.75
$0.17
$0.57
Adj. EPS1
Q2 2019 Q2 2021 Q2 2022 Q2 2019 Q2 2021 Q2 2022 Q2 2019 Q2 2021 Q2 2022
Overview
• Sales growth of 10.5% above fiscal
2019 levels with continued
meaningful share gains
• Product cost inflation effectively
managed
• Gross profit per case increased
across all operating segments
• Profitability negatively impacted by
Omicron and higher labor costs
• Returned over $650 million to
shareholders in the quarter via
share repurchases and dividend
• Recipe for Growth wins are
supporting NPS score better than
the competition
1 See Non-GAAP reconciliations at the end of the presentation.
Snap-back and Transformation Investments Impacting
Operating Costs
10
$ 36M
$ 57M
$ 73M
$ 51M
$ 24M
$ 44M
$-
$20
$40
$60
$80
$100
$120
Q4 2021 Q1 2022 Q2 2022
Millions
Snap-back and Transformation Costs by Quarter
Snap-back Transformation Costs
Overview
• Continued transformation investments for
our Recipe For Growth ($44M in 2Q 2022)
• Snap-back investments ($73M in 2Q 2022)
driven by recruiting, hiring marketing, sign-
on, retention, training, vaccination
incentives/promotion and contract labor
• Snap-back investments do not include
structural increases (which have been
modest)
• Snap-back investments are projected to
improve in 2H 2022
2Q 2022 U.S. Foodservice Results
11
$10.1
$7.9
$11.5
Net Sales
(billions)
$737
$472
$685
Adj. Operating
Income1
(millions)
Q2 2019 Q2 2021 Q2 2022 Q2 2019 Q2 2021 Q2 2022
Overview
• Sales growth of 14.0% above fiscal 2019
levels
• Above-industry growth resulting in
meaningful share gains
• Within U.S. Broadline operations, local
case volume increased 17.6% and total
case volume increased 22.5% compared
to prior year
• Gross profit increased 37.2% to $2.1
billion compared to prior year, gross
margin decreased 107 basis points to
18.6%
• U.S. Broadline product cost inflation was
14.6% primarily driven by the meat and
poultry categories
1 See Non-GAAP reconciliations at the end of the presentation.
2Q 2022 SYGMA Results
SYGMA
12
$1.5 $1.5
$1.8
Net Sales
(billions)
$3
$11
-$7
Adj. Operating
Income1
(millions)
Q2 2019 Q2 2021 Q2 2022 Q2 2019 Q2 2021 Q2 2022
Overview
• Sales growth of 15.3% above fiscal 2019
levels
• Operating loss vs. prior year impacted by
record profits in the prior year, a
previously disclosed large customer
rationalization and elevated operating
costs
• Expecting an improvement in future
quarters by actions already taken by the
company
1 See Non-GAAP reconciliations at the end of the presentation.
2Q 2022 International Results
13
$2.9
$2.0
$2.8
Net Sales
(billions)
$83
-$55
$40
Adj. Operating
Income1
(millions)
Q2 2019 Q2 2021 Q2 2022 Q2 2019 Q2 2021 Q2 2022
Overview
• Sales 2.9% below fiscal 2019 levels
• Foreign exchange rates had a positive
impact of 1.7% on sales
• Omicron-driven lockdowns in
International markets negatively
impacted December sales
• Gross profit increased 51.4% compared to
prior year, gross margin increased 116
basis points to 20.2%
• Two consecutive quarters of operating
profit in the segment despite heavy
government restrictions and Omicron
1 See Non-GAAP reconciliations at the end of the presentation.
14
1H 2022 Cash Flow
$918 $937
$377
Cash from Operations
(millions)
$701
$788
$201
Free Cash Flow1
(millions)
1H 2019 1H 2021 1H 2022 1H 2019 1H 2021 1H 2022
Overview
• Cash from operations was $377 million for
the first half of the year driven by
investments in working capital as the
company prioritized managing product
availability
• Net capital expenditures totaled $176
million for the first half of the year
• During the second quarter, the Company
repurchased 5.7 million shares of its
common stock for a total of $416 million, or
an average price of $72.30 per share
1 See Non-GAAP reconciliations at the end of the presentation.
Capital Structure and Allocation
15
Investment Priority Progress
Invest for Growth
• Continued capital investments over the next three fiscal years in our technology, fleet and buildings
• Announced acquisition of The Coastal Companies, bolstering our fresh produce offering in the Mid-
Atlantic
• Strong pipeline of tuck-in acquisitions focused on Broadline, Specialty and Cuisine-type opportunities as
well as underpenetrated markets in the U.S., U.K. and Canada
Maintain a Strong
Balance Sheet
• Committed to IG rating
• Over $3.4 billion of deleveraging in FY 2021
• Refinanced $1.25 billion of debt during 2Q 2022 at more attractive rates and longer maturities
Shareholder Return
• Paid dividend of $0.47 per share in October
• 52 consecutive years of dividend increases. We are committed to our dividend aristocrat status
• During 2Q 2022, we repurchased 5.7 million shares of common stock for a total of $416 million, or an
average price of $72.30 per share as part of our $5 billion share repurchase authorization in place
1
2
3
Sysco Consistently Increases Returns to Shareholders
16
$0.7B
$ 3.3B
$ 5.9B
$ 7.6B
$ 9.4B
$ 11.1B
$12.0B
$ 12.9B
FY2015 FY2016 FY2017 FY2018 FY2019 FY2020 FY2021 FY2022
(Q2 YTD)
Cumulative Cash Returned to Shareholders
Dividends Shares Repurchased
Over $12 Billion of Cash Returned to Shareholders Since Fiscal 2015
KEVIN HOURICAN
President & CEO
Current Share Gains Lead to Long-term Confidence
18
Strong top-line performance
Exceeding 1.2x market share growth
Expecting volume recovery post Omicron
Operating expenses projected to improve in 2H 2022
Confident in our Long-Term Trajectory
Reaffirming our Long-Term Guidance
NON-GAAP
RECONCILIATIONS
Impact of Certain Items
Our discussion of our results includes certain non-GAAP financial measures, including EBITDA and adjusted EBITDA, that we believe provide
important perspective with respect to underlying business trends. Other than free cash flow, any non-GAAP financial measures will be denoted as adjusted
measures to remove the impact of restructuring and transformational project costs consisting of: (1) restructuring charges, (2) expenses associated with our
various transformation initiatives and (3) facility closure and severance charges; acquisition-related costs consisting of: (1) intangible amortization expense and (2)
acquisition costs and due diligence costs related to our acquisitions; and the reduction of bad debt expense previously recognized in fiscal 2020 due to the impact of
the COVID-19 pandemic on the collectability of our pre-pandemic trade receivable balances. Our results for fiscal 2022 were also impacted by debt extinguishment
costs and the increase in reserves for uncertain tax positions. Our results for the first 26 weeks of fiscal 2021 were also impacted by a loss on the sale of a
business.
The results of our foreign operations can be impacted due to changes in exchange rates applicable in converting local currencies to U.S. dollars. We
measure our total Sysco and our International Foodservice Operations results on a constant currency basis. Constant currency operating results are calculated by
translating current-period local currency operating results with the currency exchange rates used to translate the financial statements in the comparable prior-year
period to determine what the current-period U.S. dollar operating results would have been if the currency exchange rate had not changed from the comparable
prior-year period.
Management believes that adjusting its operating expenses, operating income, net earnings and diluted earnings per share to remove these Certain
Items and presenting its International Foodservice Operations results on a constant currency basis, provides an important perspective with respect to our
underlying business trends and results and provides meaningful supplemental information to both management and investors that (1) is indicative of the
performance of the company’s underlying operations and (2) facilitates comparisons on a year-over-year basis.
Sysco has a history of growth through acquisitions and excludes from its non-GAAP financial measures the impact of acquisition-related intangible
amortization, acquisition costs and due-diligence costs for those acquisitions. We believe this approach significantly enhances the comparability of Sysco’s results
for fiscal 2022 and fiscal 2021.
Set forth below is a reconciliation of sales, operating expenses, operating income, other (income) expense, net earnings and diluted earnings per
share to adjusted results for these measures for the periods presented. Individual components of diluted earnings per share may not add up to the total presented
due to rounding. Adjusted diluted earnings per share is calculated using adjusted net earnings divided by diluted shares outstanding.
21
Sysco Corporation and its Consolidated Subsidiaries
Non-GAAP Reconciliation (Unaudited)
Impact of Certain Items, 2Q22 vs. 2Q21
(Dollars in Thousands, Except for Share and Per Share Data)
22
13-Week
Period Ended
Jan. 1, 2022
13-Week
Period Ended
Dec. 26, 2020
Change
in Dollars % Change
Sales (GAAP) $ 16,320,203 $ 11,558,982 $ 4,761,221 41.2%
Impact of currency fluctuations (1) (36,077) - (36,077) -0.3%
Comparable sales using a constant currency basis (Non-GAAP) $ 16,284,126 $ 11,558,982 $ 4,725,144 40.9%
Gross Profit (GAAP) 2,891,150 2,098,458 792,692 37.8%
Impact of currency fluctuations (1) (4,687) - (4,687) -0.2%
Comparable gross profit using a constant currency basis (Non-GAAP) $ 2,886,463 $ 2,098,458 $ 788,005 37.6%
Gross margin (GAAP) 17.72% 18.15% -44 bps
Impact of currency fluctuations (1) 0.01% 0% 1 bps
Comparable Gross margin using a Constant Dollar Basis (Non-GAAP) 17.73% 18.15% -43 bps
Operating expenses (GAAP) $ 2,446,241 $ 1,886,396 $ 559,845 29.7%
Impact of restructuring and transformational project costs (2) (23,469) (34,160) 10,691 31.3%
Impact of acquisition-related costs (3) (33,732) (18,125) (15,607) -86.1%
Impact of bad debt reserve adjustments (4) 6,438 30,271 (23,833) -78.7%
Operating expenses adjusted for Certain Items (Non-GAAP) 2,395,478 1,864,382 531,096 28.5%
Impact of currency fluctuations (1) (3,433) - (3,433) -0.2%
Comparable operating expenses adjusted for Certain Items using a constant currency
basis (Non-GAAP) $ 2,392,045 $ 1,864,382 $ 527,663 28.3%
Operating income (GAAP) $ 444,909 $ 212,062 $ 232,847 109.8%
Impact of restructuring and transformational project costs (2) 23,469 34,160 (10,691) -31.3%
Impact of acquisition-related costs (3) 33,732 18,125 15,607 86.1%
Impact of bad debt reserve adjustments (4) (6,438) (30,271) 23,833 78.7%
Operating income adjusted for Certain Items (Non-GAAP) 495,672 234,076 261,596 111.8%
Impact of currency fluctuations (1) (1,255) - (1,255) -0.5%
Comparable operating income adjusted for Certain Items using a constant currency basis
(Non-GAAP) $ 494,417 $ 234,076 $ 260,341 111.2%
23
Sysco Corporation and its Consolidated Subsidiaries
Non-GAAP Reconciliation (Unaudited)
Impact of Certain Items, 2Q22 vs. 2Q21
(Dollars in Thousands, Except for Share and Per Share Data) continued
Interest expense (GAAP) $ 242,899 $ 146,498 $ 96,401 65.8%
Impact of loss on extinguishment of debt (115,603) - (115,603) NM
Interest expense adjusted for certain items (Non-GAAP) $ 127,296 $ 146,498 $ (19,202) -13.1%
Net earnings (GAAP) $ 167,441 $ 67,289 $ 100,152 148.8%
Impact of restructuring and transformational project costs (2) 23,469 34,160 (10,691) -31.3%
Impact of acquisition-related costs (3) 33,732 18,125 15,607 86.1%
Impact of bad debt reserve adjustments (4) (6,438) (30,271) 23,833 78.7%
Impact of loss on extinguishment of debt 115,603 - 115,603 NM
Tax impact of restructuring and transformational project costs (5) (5,897) (10,666) 4,769 44.7%
Tax impact of acquisition-related costs (5) (8,475) (5,850) (2,625) -44.9%
Tax Impact of bad debt reserve adjustments (5) 1,617 13,071 (11,454) -87.6%
Tax impact of loss on extinguishment of debt (5) (29,111) - (29,111) NM
Net earnings adjusted for Certain Items (Non-GAAP) $ 291,941 $ 85,858 $ 206,083 240.0%
Diluted earnings per share (GAAP) $ 0.33 $ 0.13 $ 0.20 153.8%
Impact of restructuring and transformational project costs (2) 0.05 0.07 (0.02) -28.6%
Impact of acquisition-related costs (3) 0.07 0.04 0.03 75.0%
Impact of bad debt reserve adjustments (4) (0.01) (0.06) 0.05 83.3%
Impact of loss on extinguishment of debt 0.22 - 0.22 NM
Tax impact of restructuring and transformational project costs (5) (0.01) (0.02) 0.01 50.0%
Tax impact of acquisition-related costs (5) (0.02) (0.01) (0.01) -100.0%
Tax Impact of bad debt reserve adjustments (5) - 0.03 (0.03) NM
Tax impact of loss on extinguishment of debt (5) (0.06) - (0.06) NM
Diluted earnings per share adjusted for Certain Items (Non-GAAP) (6) $ 0.57 $ 0.17 $ 0.40 235.3%
Diluted shares outstanding 514,574,889 512,742,792
NM represents that the percentage change is not meaningful.
(5)
The tax impact of adjustments for Certain Items is calculated by multiplying the pretax impact of each Certain Item by the statutory rates in effect for each jurisdiction where the Certain Item
was incurred.
(6)
Individual components of diluted earnings per share may not add up to the total presented due to rounding. Total diluted earnings per share is calculated using adjusted net earnings divided
by diluted shares outstanding.
(3)
Fiscal 2022 includes $27 million of intangible amortization expense and $7 million in acquisition and due diligence costs. Fiscal 2021 represents intangible amortization expense.
(2)
Fiscal 2022 includes $12 million related to restructuring, severance, and facility closure charges and $12 million related to various transformation initiative costs, primarily consisting of changes
to our business technology strategy. Fiscal 2021 $22 million is related to restructuring charges and $12 million related to various transformation initiative costs, primarily consisting of changes to
our business technology strategy.
(4)
Fiscal 2022 and 2021 represent the reduction of bad debt charges previously taken on pre-pandemic trade receivable balances in fiscal 2020.
(1)
Represents a constant currency adjustment, which eliminates the impact of foreign currency fluctuations on the current year results.
24
Sysco Corporation and its Consolidated Subsidiaries
Non-GAAP Reconciliation (Unaudited)
Impact of Certain Items, 2Q22 vs. 2Q19
(Dollars in Thousands, Except for Share and Per Share Data)
13-Week
Period Ended
Jan. 1, 2022
13-Week
Period Ended
Dec. 29, 2018
Change
in Dollars % Change
Sales (GAAP) $ 16,320,203 $ 14,765,707 $ 1,554,496 10.5%
Gross Profit (GAAP) 2,891,150 2,771,712 119,438 4.3%
Gross margin (GAAP) 17.72% 18.77% -106 bps
Operating expenses (GAAP) $ 2,446,241 $ 2,319,817 $ 126,424 5.4%
Impact of restructuring and transformational project costs (1) (23,469) (134,436) 110,967 82.5%
Impact of acquisition-related costs (2) (33,732) (17,008) (16,724) -98.3%
Impact of bad debt reserve adjustments (3) 6,438 - 6,438 NM
Operating expenses adjusted for Certain Items (Non-GAAP) $ 2,395,478 $ 2,168,373 $ 227,105 10.5%
Operating income (GAAP) $ 444,909 $ 451,895 $ (6,986) -1.5%
Impact of restructuring and transformational project costs (1) 23,469 134,436 (110,967) -82.5%
Impact of acquisition-related costs (2) 33,732 17,008 16,724 98.3%
Impact of bad debt reserve adjustments (3) (6,438) - (6,438) NM
Operating income adjusted for Certain Items (Non-GAAP) $ 495,672 $ 603,339 $ (107,667) -17.8%
Interest expense (GAAP) $ 242,899 $ 87,113 $ 155,786 178.8%
Impact of loss on extinguishment of debt (115,603) - (115,603) NM
Interest expense adjusted for certain items (Non-GAAP) $ 127,296 $ 87,113 $ 40,183 46.1%
Net earnings (GAAP) $ 167,441 $ 267,380 $ (99,939) -37.4%
Impact of restructuring and transformational project costs (1) 23,469 134,436 (110,967) -82.5%
Impact of acquisition-related costs (2) 33,732 17,008 16,724 98.3%
Impact of bad debt reserve adjustments (3) (6,438) - (6,438) NM
Impact of loss on extinguishment of debt 115,603 - 115,603 NM
Tax impact of restructuring and transformational project costs (4) (5,897) (34,886) 28,989 83.1%
Tax impact of acquisition-related costs (4) (8,475) (5,611) (2,864) -51.0%
Tax Impact of bad debt reserve adjustments (4) 1,617 - 1,617 NM
Tax impact of loss on extinguishment of debt (4) (29,111) - (29,111) NM
Impact of adjustments to uncertain tax positions - 15,154 (15,154) NM
Net earnings adjusted for Certain Items (Non-GAAP) $ 291,941 $ 393,481 $ (101,540) -25.8%
25
Sysco Corporation and its Consolidated Subsidiaries
Non-GAAP Reconciliation (Unaudited)
Impact of Certain Items, 2Q22 vs. 2Q19
(Dollars in Thousands, Except for Share and Per Share Data) continued
Diluted earnings per share (GAAP) $ 0.33 $ 0.51 $ (0.18) -35.3%
Impact of restructuring and transformational project costs (1) 0.05 0.26 (0.21) -80.8%
Impact of acquisition-related costs (2) 0.07 0.03 0.04 133.3%
Impact of bad debt reserve adjustments (3) (0.01) - (0.01) NM
Impact of loss on extinguishment of debt 0.22 - 0.22 NM
Tax impact of restructuring and transformational project costs (4) (0.01) (0.07) 0.06 85.7%
Tax impact of acquisition-related costs (4) (0.02) (0.01) (0.01) -100.0%
Tax impact of loss on extinguishment of debt (4) (0.06) - (0.06) NM
Impact of adjustments to uncertain tax positions - 0.03 (0.03) NM
Diluted earnings per share adjusted for Certain Items (Non-GAAP) (5) $ 0.57 $ 0.75 $ (0.18) -24.0%
Diluted shares outstanding 514,574,889 524,600,510
NM represents that the percentage change is not meaningful.
(1)
Fiscal 2022 includes $12 million related to restructuring, severance, and facility closure charges and $12 million related to various transformation initiative costs, primarily consisting of changes
to our business technology strategy. Fiscal 2019 includes $53 million related to various transformation initiative costs, primarily consisting of changes to our business technology strategy, of
which $17 million relates to accelerated depreciation related to software that is being replaced, and $81 million related to severance, restructuring and facility closure charges in Europe and
Canada, of which $55 million relates to our France restructuring as part of our integration of Brake France and Davigel into Sysco France.
(2)
Fiscal 2022 includes $27 million of intangible amortization expense and $7 million in acquisition and due diligence costs. Fiscal 2019 includes intangible amortization expense.
(3)
Fiscal 2022 represents the reduction of bad debt charges previously taken on pre-pandemic trade receivable balances in fiscal 2020.
(4)
The tax impact of adjustments for Certain Items is calculated by multiplying the pretax impact of each Certain Item by the statutory rates in effect for each jurisdiction where the Certain Item
was incurred.
(5)
Individual components of diluted earnings per share may not add up to the total presented due to rounding. Total diluted earnings per share is calculated using adjusted net earnings divided
by diluted shares outstanding.
Earnings Before Interest, Taxes, Depreciation and
Amortization (EBITDA)
26
EBITDA represents net earnings plus (i) interest expense, (ii) income tax expense and benefit, (iii) depreciation and (iv) amortization. The net earnings component of
our EBITDA calculation is impacted by Certain Items that we do not consider representative of our underlying performance. As a result, in the non-GAAP reconciliations below for each
period presented, adjusted EBITDA is computed as EBITDA plus the impact of Certain Items, excluding Certain items related to interest expense, income taxes, depreciation and
amortization. Sysco's management considers growth in this metric to be a measure of overall financial performance that provides useful information to management and investors
about the profitability of the business, as it facilitates comparison of performance on a consistent basis from period to period by providing a measurement of recurring factors and
trends affecting our business. Additionally, it is a commonly used component metric used to inform on capital structure decisions. Adjusted EBITDA should not be used as a substitute
for the most comparable GAAP measure in assessing the company’s financial performance for the periods presented. An analysis of any non-GAAP financial measure should be used in
conjunction with results presented in accordance with GAAP. In the tables that follow, adjusted EBITDA for each period presented is reconciled to net earnings.
27
Sysco Corporation and its Consolidated Subsidiaries
Non-GAAP Reconciliation (Unaudited)
Impact of Certain Items on Earnings Before Interest, Taxes, Depreciation and Amortization (2Q22 vs. 2Q21)
(In Thousands)
13-Week
Period Ended
Jan. 1, 2022
13-Week
Period Ended
Dec. 26, 2020
Change
in Dollars %/bps Change
Net earnings (GAAP) $ 167,441 $ 67,289 $ 100,152 148.8%
Interest (GAAP) 242,899 146,498 96,401 65.8%
Income taxes (GAAP) 45,245 13,831 31,414 227.1%
Depreciation and amortization (GAAP) 191,297 184,811 6,486 3.5%
EBITDA (Non-GAAP) $ 646,882 $ 412,429 $ 234,453 56.8%
Certain Item adjustments:
Impact of restructuring and transformational project costs (1) 23,193 29,674 (6,481) -21.8%
Impact of acquisition-related costs (2) 7,085 - 7,085 NM
Impact of bad debt reserve adjustments (3) (6,438) (30,271) 23,833 78.7%
EBITDA adjusted for Certain Items (Non-GAAP) (4) $ 670,722 $ 411,832 $ 258,890 62.9%
NM represents that the percentage change is not meaningful.
(1)
Fiscal 2022 and 2021 includes charges related to restructuring, severance, and facility closures, as well as various transformation initiative costs, primarily consisting of changes to
our business technology strategy, excluding charges related to accelerated depreciation.
(3)
Fiscal 2022 and 2021 represent the reduction of bad debt charges previously taken on pre-pandemic trade receivable balances in fiscal 2020.
(2)
Fiscal 2022 includes acquisition and due diligence costs.
(4)
In arriving at adjusted EBITDA, Sysco does not adjust out interest income of $1 million and $3 million for fiscal 2022 and fiscal 2021, respectively, or non-cash stock compensation
expense of $31 million and $20 million in fiscal 2022 and fiscal 2021, respectively.
28
Sysco Corporation and its Consolidated Subsidiaries
Non-GAAP Reconciliation (Unaudited)
Impact of Certain Items on Earnings Before Interest, Taxes, Depreciation and Amortization (2Q22 vs. 2Q19)
(In Thousands)
13-Week
Period Ended
Jan. 1, 2022
13-Week
Period Ended
Dec. 29, 2018
Change
in Dollars %/bps Change
Net earnings (GAAP) $ 167,441 $ 267,380 $ (99,939) -37.4%
Interest (GAAP) 242,899 87,113 155,786 178.8%
Income taxes (GAAP) 45,245 87,205 (41,960) -48.1%
Depreciation and amortization (GAAP) 191,297 204,786 (13,489) -6.6%
EBITDA (Non-GAAP) $ 646,882 $ 646,484 $ 398 0.1%
Certain Item adjustments:
Impact of restructuring and transformational project costs (1) 23,193 106,881 (83,688) -78.3%
Impact of acquisition-related costs (2) 7,085 (1,250) 8,335 NM
Impact of bad debt reserve adjustments (3) (6,438) - (6,438) NM
EBITDA adjusted for Certain Items (Non-GAAP) (4) $ 670,722 $ 752,115 $ (81,393) -10.8%
NM represents that the percentage change is not meaningful.
(1)
Fiscal 2022 includes charges related to restructuring, severance, and facility closures, as well as various transformation initiative costs, primarily consisting of changes to our
business technology strategy, excluding charges related to accelerated depreciation. Fiscal 2019 includes $81 million related to severance, restructuring and facility closure charges as
well as various transformation initiative costs, excluding charges related to accelerated depreciation.
(2)
Fiscal 2022 includes acquisition and due diligence costs. Fiscal 2019 represents acquisition costs.
(3)
Fiscal 2022 represents the reduction of bad debt charges previously taken on pre-pandemic trade receivable balances in fiscal 2020.
(4)
In arriving at adjusted EBITDA, Sysco does not adjust out interest income of $1 million and $1 million for fiscal 2022 and fiscal 2019, respectively, or non-cash stock compensation
expense of $31 million and $25 million in fiscal 2022 and fiscal 2019, respectively.
29
Sysco Corporation and its Consolidated Subsidiaries
Segment Results
Non-GAAP Reconciliation (Unaudited)
Impact of Certain Items on Applicable Segments, 2Q22 vs. 2Q21
(Dollars in Thousands) 13-Week
Period Ended
Jan. 1, 2022
13-Week
Period Ended
Dec. 26, 2020
Change
in Dollars %/bps Change
U.S. FOODSERVICE OPERATIONS
Sales $ 11,498,155 $ 7,924,143 $ 3,574,012 45.1%
Gross Profit 2,139,278 1,559,322 579,956 37.2%
Gross Margin 18.61% 19.68% -107 bps
Operating expenses (GAAP) $ 1,462,456 $ 1,074,071 $ 388,385 36.2%
Impact of restructuring and transformational project costs (16) (1,784) 1,768 99.1%
Impact of acquisition-related costs (1) (13,131) - (13,131) NM
Impact of bad debt reserve adjustments (2) 5,249 15,239 (9,990) -65.6%
Operating expenses adjusted for Certain Items (Non-GAAP) $ 1,454,558 $ 1,087,526 $ 367,032 33.7%
Operating income (GAAP) $ 676,822 $ 485,251 $ 191,571 39.5%
Impact of restructuring and transformational project costs 16 1,784 (1,768) -99.1%
Impact of acquisition-related costs (1) 13,131 - 13,131 NM
Impact of bad debt reserve adjustments (2) (5,249) (15,239) 9,990 65.6%
Operating income adjusted for Certain Items (Non-GAAP) $ 684,720 $ 471,796 $ 212,924 45.1%
INTERNATIONAL FOODSERVICE OPERATIONS
Sales (GAAP) $ 2,806,272 $ 1,967,789 $ 838,483 42.6%
Impact of currency fluctuations (3) (34,061) - (34,061) -1.7%
Comparable sales using a constant currency basis (Non-GAAP) $ 2,772,211 $ 1,967,789 $ 804,422 40.9%
Gross Profit (GAAP) $ 565,931 $ 373,840 $ 192,091 51.4%
Impact of currency fluctuations (3) (4,033) - (4,033) -1.1%
Comparable gross profit using a constant currency basis (Non-GAAP) $ 561,898 $ 373,840 $ 188,058 50.3%
Gross Margin (GAAP) 20.17% 19.00% 116 bps
Impact of currency fluctuations (3) -0.10% - -10 bps
Comparable gross margin using a constant currency basis (Non-GAAP) 20.27% 19.00% 127 bps
Operating expenses (GAAP) $ 555,186 $ 453,789 $ 101,397 22.3%
Impact of restructuring and transformational project costs (4) (11,621) (20,405) 8,784 43.0%
Impact of acquisition-related costs (5) (18,475) (18,125) (350) -1.9%
Impact of bad debt reserve adjustments (2) 1,191 13,797 (12,606) -91.4%
Operating expenses adjusted for Certain Items (Non-GAAP) 526,281 429,056 97,225 22.7%
Impact of currency fluctuations (3) (3,194) - (3,194) -0.7%
Comparable operating expenses adjusted for Certain Items using a constant currency
basis (Non-GAAP) $ 523,087 $ 429,056 $ 94,031 21.9%
Operating income (loss) (GAAP) $ 10,745 $ (79,949) $ 90,694 113.4%
Impact of restructuring and transformational project costs (4) 11,621 20,405 (8,784) -43.0%
Impact of acquisition-related costs (5) 18,475 18,125 350 1.9%
Impact of bad debt reserve adjustments (2) (1,191) (13,797) 12,606 91.4%
Operating income (loss) adjusted for Certain Items (Non-GAAP) 39,650 (55,216) 94,866 171.8%
Impact of currency fluctuations (3) (839) - (839) -1.5%
Comparable operating income (loss) adjusted for Certain Items using a constant
currency basis (Non-GAAP) $ 38,811 $ (55,216) $ 94,027 170.3%
SYGMA
Sales $ 1,771,323 $ 1,520,401 $ 250,922 16.5%
Gross Profit 136,952 129,299 7,653 5.9%
Gross Margin 7.73% 8.50% -77 bps
Operating expenses (GAAP) $ 143,681 $ 117,971 $ 25,710 21.8%
Impact of restructuring and transformational project costs - 6 (6) NM
Operating expenses adjusted for Certain Items (Non-GAAP) $ 143,681 $ 117,977 $ 25,704 21.8%
Operating (loss) income (GAAP) $ (6,729) $ 11,328 $ (18,057) -159.4%
Impact of restructuring and transformational project costs - (6) 6 NM
Operating (loss) income adjusted for Certain Items (Non-GAAP) $ (6,729) $ 11,322 $ (18,051) -159.4%
30
Sysco Corporation and its Consolidated Subsidiaries
Segment Results
Non-GAAP Reconciliation (Unaudited)
Impact of Certain Items on Applicable Segments, 2Q22 vs. 2Q21
(Dollars in Thousands) continued
OTHER
Sales $ 244,453 $ 146,649 $ 97,804 66.7%
Gross Profit 54,809 35,767 19,042 53.2%
Gross Margin 22.42% 24.39% -197 bps
Operating expenses (GAAP) $ 54,626 $ 36,785 $ 17,841 48.5%
Impact of bad debt reserve adjustments (2) (2) 1,235 (1,237) -100.2%
Operating expenses adjusted for certain items (Non-GAAP) $ 54,624 $ 38,020 $ 16,604 43.7%
Operating income (loss) (GAAP) $ 183 $ (1,018) $ 1,201 118.0%
Impact of bad debt reserve adjustments (2) 2 (1,235) 1,237 100.2%
Operating income (loss) adjusted for certain items (Non-GAAP) $ 185 $ (2,253) $ 2,438 108.2%
GLOBAL SUPPORT CENTER
Gross Profit $ (5,820) $ 230 $ (6,050) NM
Operating expenses (GAAP) $ 230,292 $ 203,780 $ 26,512 13.0%
Impact of restructuring and transformational project costs (6) (11,832) (11,977) 145 1.2%
Impact of acquisition related costs (7) (2,126) - (2,126) NM
Operating expenses adjusted for Certain Items (Non-GAAP) $ 216,334 $ 191,803 $ 24,531 12.8%
Operating loss (GAAP) $ (236,112) $ (203,550) $ (32,562) -16.0%
Impact of restructuring and transformational project costs (6) 11,832 11,977 (145) -1.2%
Impact of acquisition related costs (7) 2,126 - 2,126 NM
Operating loss adjusted for Certain Items (Non-GAAP) $ (222,154) $ (191,573) $ (30,581) -16.0%
TOTAL SYSCO
Sales $ 16,320,203 $ 11,558,982 $ 4,761,221 41.2%
Gross Profit 2,891,150 2,098,458 792,692 37.8%
Gross margin 17.72% 18.15% -44 bps
Operating expenses (GAAP) $ 2,446,241 $ 1,886,396 $ 559,845 29.7%
Impact of restructuring and transformational project costs (4) (6) (23,469) (34,160) 10,691 31.3%
Impact of acquisition-related costs (1) (5) (7) (33,732) (18,125) (15,607) -86.1%
Impact of bad debt reserve adjustments (2) 6,438 30,271 (23,833) -78.7%
Operating expenses adjusted for Certain Items (Non-GAAP) $ 2,395,478 $ 1,864,382 $ 531,096 28.5%
Operating income (GAAP) $ 444,909 $ 212,062 $ 232,847 109.8%
Impact of restructuring and transformational project costs (4) (6) 23,469 34,160 (10,691) -31.3%
Impact of acquisition-related costs (1) (5) (7) 33,732 18,125 15,607 86.1%
Impact of bad debt reserve adjustments (2) (6,438) (30,271) 23,833 78.7%
Operating income adjusted for Certain Items (Non-GAAP) $ 495,672 $ 234,076 $ 261,596 111.8%
(4)
Includes restructuring and facility closure costs primarily in Europe.
(5)
Represents intangible amortization expense.
NM represents that the percentage change is not meaningful.
(7)
Represents due diligence costs.
(3)
Represents a constant currency adjustment, which eliminates the impact of foreign currency fluctuations on current year results.
(6)
Includes various transformation initiative costs, primarily consisting of changes to our business technology strategy.
(1)
Fiscal 2022 includes intangible amortization expense and acquisition costs.
(2)
Fiscal 2022 and 2021 represent the reduction of bad debt charges previously taken on pre-pandemic trade receivable balances in fiscal 2020.
31
Sysco Corporation and its Consolidated Subsidiaries
Segment Results
Non-GAAP Reconciliation (Unaudited)
Impact of Certain Items on Applicable Segments, 2Q22 vs. 2Q19
(Dollars in Thousands) 13-Week
Period Ended
Jan. 1, 2022
13-Week
Period Ended
Dec. 29, 2018
Change
in Dollars %/bps Change
U.S. FOODSERVICE OPERATIONS
Sales $ 11,498,155 $ 10,087,105 $ 1,411,050 14.0%
Gross Profit 2,139,278 2,001,819 137,459 6.9%
Gross Margin 18.61% 19.85% -124 bps
Operating expenses (GAAP) $ 1,462,456 $ 1,264,342 $ 198,114 15.7%
Impact of restructuring and transformational project costs (16) - (16) NM
Impact of acquisition-related costs (1) (13,131) - (13,131) NM
Impact of bad debt reserve adjustments (2) 5,249 - 5,249 NM
Operating expenses adjusted for Certain Items (Non-GAAP) $ 1,454,558 $ 1,264,342 $ 190,216 15.0%
Operating income (GAAP) $ 676,822 $ 737,477 $ (60,655) -8.2%
Impact of restructuring and transformational project costs 16 - 16 NM
Impact of acquisition-related costs (1) 13,131 - 13,131 NM
Impact of bad debt reserve adjustments (2) (5,249) - (5,249) NM
Operating income adjusted for Certain Items (Non-GAAP) $ 684,720 $ 737,477 $ (52,757) -7.2%
INTERNATIONAL FOODSERVICE OPERATIONS
Sales (GAAP) $ 2,806,272 $ 2,890,598 $ (84,326) -2.9%
Gross Profit (GAAP) 565,931 589,922 (23,991) -4.1%
Gross Margin (GAAP) 20.17% 20.41% -25 bps
Operating expenses (GAAP) $ 555,186 $ 604,839 $ (49,653) -8.2%
Impact of restructuring and transformational project costs (3) (11,621) (81,020) 69,399 85.7%
Impact of acquisition-related costs (4) (18,475) (16,947) (1,528) -9.0%
Impact of bad debt reserve adjustments (2) 1,191 - 1,191 NM
Operating expenses adjusted for Certain Items (Non-GAAP) $ 526,281 $ 506,872 $ 19,409 3.8%
Operating income (loss) (GAAP) $ 10,745 $ (14,917) $ 25,662 172.0%
Impact of restructuring and transformational project costs (3) 11,621 81,020 (69,399) -85.7%
Impact of acquisition-related costs (4) 18,475 16,947 1,528 9.0%
Impact of bad debt reserve adjustments (2) (1,191) - (1,191) NM
Operating income adjusted for Certain Items (Non-GAAP) $ 39,650 $ 83,050 $ (43,400) -52.3%
SYGMA
Sales $ 1,771,323 $ 1,536,607 $ 234,716 15.3%
Gross Profit 136,952 121,537 15,415 12.7%
Gross Margin 7.73% 7.91% -18 bps
Operating expenses (GAAP) $ 143,681 $ 118,423 $ 25,258 21.3%
Operating (loss) income (GAAP) $ (6,729) $ 3,114 $ (9,843) NM
32
Sysco Corporation and its Consolidated Subsidiaries
Segment Results
Non-GAAP Reconciliation (Unaudited)
Impact of Certain Items on Applicable Segments, 2Q22 vs. 2Q19
(Dollars in Thousands) continued
OTHER
Sales $ 244,453 $ 251,397 $ (6,944) -2.8%
Gross Profit 54,809 63,501 (8,692) -13.7%
Gross Margin 22.42% 25.26% -284 bps
Operating expenses (GAAP) $ 54,626 $ 57,783 $ (3,157) -5.5%
Impact of bad debt reserve adjustments (2) (2) - (2) NM
Operating expenses adjusted for certain items (Non-GAAP) $ 54,624 $ 57,783 $ (3,159) -5.5%
Operating income (GAAP) $ 183 $ 5,718 $ (5,535) -96.8%
Impact of bad debt reserve adjustments (2) 2 - 2 NM
Operating income adjusted for certain items (Non-GAAP) $ 185 $ 5,718 $ (5,533) -96.8%
GLOBAL SUPPORT CENTER
Gross Profit $ (5,820) $ (5,067) $ (753) -14.9%
Operating expenses (GAAP) $ 230,292 $ 274,430 $ (44,138) -16.1%
Impact of restructuring and transformational project costs (5) (11,832) (53,416) 41,584 77.8%
Impact of acquisition related costs (6) (2,126) (61) (2,065) NM
Operating expenses adjusted for Certain Items (Non-GAAP) $ 216,334 $ 220,953 $ (4,619) -2.1%
Operating loss (GAAP) $ (236,112) $ (279,497) $ 43,385 15.5%
Impact of restructuring and transformational project costs (5) 11,832 53,416 (41,584) -77.8%
Impact of acquisition related costs (6) 2,126 61 2,065 NM
Operating loss adjusted for Certain Items (Non-GAAP) $ (222,154) $ (226,020) $ 3,866 1.7%
TOTAL SYSCO
Sales $ 16,320,203 $ 14,765,707 $ 1,554,496 10.5%
Gross Profit 2,891,150 2,771,712 119,438 4.3%
Gross margin 17.72% 18.77% -106 bps
Operating expenses (GAAP) $ 2,446,241 $ 2,319,817 $ 126,424 5.4%
Impact of restructuring and transformational project costs (3) (5) (23,469) (134,436) 110,967 82.5%
Impact of acquisition-related costs (1) (4) (6) (33,732) (17,008) (16,724) -98.3%
Impact of bad debt reserve adjustments (2) 6,438 - 6,438 NM
Operating expenses adjusted for Certain Items (Non-GAAP) $ 2,395,478 $ 2,168,373 $ 227,105 10.5%
Operating income (GAAP) $ 444,909 $ 451,895 $ (6,986) -1.5%
Impact of restructuring and transformational project costs (3) (5) 23,469 134,436 (110,967) -82.5%
Impact of acquisition-related costs (1) (4) (6) 33,732 17,008 16,724 98.3%
Impact of bad debt reserve adjustments (2) (6,438) - (6,438) NM
Operating income adjusted for Certain Items (Non-GAAP) $ 495,672 $ 603,339 $ (107,667) -17.8%
(6)
Represents due diligence costs from the Greco and Sons acquisition.
NM represents that the percentage change is not meaningful.
(3)
Includes restructuring and facility closure costs primarily in Europe.
(1)
Fiscal 2022 includes intangible amortization expense and acquisition costs.
(2)
Fiscal 2022 represent the reduction of bad debt charges previously taken on pre-pandemic trade receivable balances in fiscal 2020.
(4)
Represents intangible amortization expense.
(5)
Includes various transformation initiative costs, primarily consisting of changes to our business technology strategy.
33
Sysco Corporation and its Consolidated Subsidiaries
Non-GAAP Reconciliation (Unaudited)
Free Cash Flow, YTD22 vs. YTD21 and YTD22 vs.YTD19
(In Thousands)
Net cash provided by operating activities (GAAP) $ 377,048 $ 936,678 $ (559,630) $ 377,048 $ 917,790 $ (540,742)
Additions to plant and equipment (181,374) (163,944) (17,430) (181,374) (223,825) 42,451
Proceeds from sales of plant and equipment 5,450 15,510 (10,060) 5,450 6,901 (1,451)
Free Cash Flow (Non-GAAP) $ 201,124 $ 788,244 $ (587,120) $ 201,124 $ 700,866 $ (499,742)
Change
in Dollars
26-Week
Period Ended
Jan. 1, 2022
26-Week
Period Ended
Dec. 26, 2020
Change
in Dollars
26-Week
Period Ended
Jan. 1, 2022
26-Week
Period Ended
Dec. 26, 2018
Free cash flow represents net cash provided from operating activities less purchases of plant and equipment and includes proceeds from sales of plant and equipment. Sysco considers free cash flow to be a
liquidity measure that provides useful information to management and investors about the amount of cash generated by the business after the purchases and sales of buildings, fleet, equipment and
technology, which may potentially be used to pay for, among other things, strategic uses of cash including dividend payments, share repurchases and acquisitions. However, free cash flow may not be
available for discretionary expenditures, as it may be necessary that we use it to make mandatory debt service or other payments. Free cash flow should not be used as a substitute for the most
comparable GAAP measure in assessing the company’s liquidity for the periods presented. An analysis of any non-GAAP financial measure should be used in conjunction with results presented in accordance
with GAAP. In the table that follows, free cash flow for each period presented is reconciled to net cash provided by operating activities.

More Related Content

What's hot

4Q20_Earnings_Call_Presentation
4Q20_Earnings_Call_Presentation4Q20_Earnings_Call_Presentation
4Q20_Earnings_Call_PresentationSysco_Investors
 
Jefferies 2019 Consumer Conference
Jefferies 2019 Consumer ConferenceJefferies 2019 Consumer Conference
Jefferies 2019 Consumer ConferenceSysco_Investors
 
Sysco's Merger with US Foods
Sysco's Merger with US FoodsSysco's Merger with US Foods
Sysco's Merger with US FoodsSysco_Investors
 
CAGNY 2022
CAGNY 2022CAGNY 2022
CAGNY 2022SYYIR
 
CAGNY 2021
CAGNY 2021CAGNY 2021
CAGNY 2021SYYIR
 
20150915 investor day presentation v_f_webcast version
20150915 investor day presentation v_f_webcast version20150915 investor day presentation v_f_webcast version
20150915 investor day presentation v_f_webcast versionSysco_Investors
 
Sysco Investor Day 2021
Sysco Investor Day 2021Sysco Investor Day 2021
Sysco Investor Day 2021SYYIR
 
Sysco 4Q and FY20 Earnings Results
Sysco 4Q and FY20 Earnings ResultsSysco 4Q and FY20 Earnings Results
Sysco 4Q and FY20 Earnings ResultsSYYIR
 
Barclays Eat Sleep Play Conference 2020
Barclays Eat Sleep Play Conference 2020Barclays Eat Sleep Play Conference 2020
Barclays Eat Sleep Play Conference 2020SYYIR
 
Paas investor presentation february 2022
Paas investor presentation february 2022Paas investor presentation february 2022
Paas investor presentation february 2022csandovalduran
 
Bernstein Strategic Decisions 2020
Bernstein Strategic Decisions 2020Bernstein Strategic Decisions 2020
Bernstein Strategic Decisions 2020SYYIR
 
Constellation Brands Investor Overview Presentation
Constellation Brands Investor Overview PresentationConstellation Brands Investor Overview Presentation
Constellation Brands Investor Overview Presentationconstellationbrands
 
Barclays Global Consumer Staples Conference 2020
Barclays Global Consumer Staples Conference 2020Barclays Global Consumer Staples Conference 2020
Barclays Global Consumer Staples Conference 2020SYYIR
 

What's hot (20)

Q4 2021 Presentation
Q4 2021 PresentationQ4 2021 Presentation
Q4 2021 Presentation
 
Q2 2021-presentation
Q2 2021-presentationQ2 2021-presentation
Q2 2021-presentation
 
4Q20_Earnings_Call_Presentation
4Q20_Earnings_Call_Presentation4Q20_Earnings_Call_Presentation
4Q20_Earnings_Call_Presentation
 
Q3 2021 Presentation
Q3 2021 PresentationQ3 2021 Presentation
Q3 2021 Presentation
 
Q1 2021 Earning
Q1 2021 EarningQ1 2021 Earning
Q1 2021 Earning
 
Jefferies 2019 Consumer Conference
Jefferies 2019 Consumer ConferenceJefferies 2019 Consumer Conference
Jefferies 2019 Consumer Conference
 
Sysco's Merger with US Foods
Sysco's Merger with US FoodsSysco's Merger with US Foods
Sysco's Merger with US Foods
 
CAGNY 2022
CAGNY 2022CAGNY 2022
CAGNY 2022
 
CAGNY 2021
CAGNY 2021CAGNY 2021
CAGNY 2021
 
Webinar Slides: Problem Areas of Forms 990 and 990-T
Webinar Slides: Problem Areas of Forms 990 and 990-TWebinar Slides: Problem Areas of Forms 990 and 990-T
Webinar Slides: Problem Areas of Forms 990 and 990-T
 
20150915 investor day presentation v_f_webcast version
20150915 investor day presentation v_f_webcast version20150915 investor day presentation v_f_webcast version
20150915 investor day presentation v_f_webcast version
 
Sysco Investor Day 2021
Sysco Investor Day 2021Sysco Investor Day 2021
Sysco Investor Day 2021
 
Cagny 2020
Cagny 2020Cagny 2020
Cagny 2020
 
Sysco 4Q and FY20 Earnings Results
Sysco 4Q and FY20 Earnings ResultsSysco 4Q and FY20 Earnings Results
Sysco 4Q and FY20 Earnings Results
 
Barclays Eat Sleep Play Conference 2020
Barclays Eat Sleep Play Conference 2020Barclays Eat Sleep Play Conference 2020
Barclays Eat Sleep Play Conference 2020
 
Paas investor presentation february 2022
Paas investor presentation february 2022Paas investor presentation february 2022
Paas investor presentation february 2022
 
Bernstein Strategic Decisions 2020
Bernstein Strategic Decisions 2020Bernstein Strategic Decisions 2020
Bernstein Strategic Decisions 2020
 
Sysco 2q 2018
Sysco 2q 2018Sysco 2q 2018
Sysco 2q 2018
 
Constellation Brands Investor Overview Presentation
Constellation Brands Investor Overview PresentationConstellation Brands Investor Overview Presentation
Constellation Brands Investor Overview Presentation
 
Barclays Global Consumer Staples Conference 2020
Barclays Global Consumer Staples Conference 2020Barclays Global Consumer Staples Conference 2020
Barclays Global Consumer Staples Conference 2020
 

Similar to Sysco 2Q FY22 Earnings Results Highlights

3q22-syy-earnings-slides.pdf
3q22-syy-earnings-slides.pdf3q22-syy-earnings-slides.pdf
3q22-syy-earnings-slides.pdfSysco_Investors
 
Sysco 3Q FY21 Earnings Results
Sysco 3Q FY21 Earnings ResultsSysco 3Q FY21 Earnings Results
Sysco 3Q FY21 Earnings ResultsSYYIR
 
Sysco Earnings Results 2Q20
Sysco Earnings Results 2Q20Sysco Earnings Results 2Q20
Sysco Earnings Results 2Q20Sysco_Investors
 
Sysco Earnings Results 4Q19
Sysco Earnings Results 4Q19Sysco Earnings Results 4Q19
Sysco Earnings Results 4Q19Sysco_Investors
 
2019 syy bernstein slides v final
2019 syy  bernstein slides v final2019 syy  bernstein slides v final
2019 syy bernstein slides v finalSYYIR
 
2019 cagny presentation v final2
2019 cagny presentation v final22019 cagny presentation v final2
2019 cagny presentation v final2SYYIR
 
Sysco Earnings Results 3Q19
Sysco Earnings Results 3Q19Sysco Earnings Results 3Q19
Sysco Earnings Results 3Q19Sysco_Investors
 
2019 cagny-presentation-vfinal
2019 cagny-presentation-vfinal2019 cagny-presentation-vfinal
2019 cagny-presentation-vfinalSysco_Investors
 
Consumer Analyst Group of New York (CAGNY) Conference 2019
Consumer Analyst Group of New York (CAGNY) Conference 2019 Consumer Analyst Group of New York (CAGNY) Conference 2019
Consumer Analyst Group of New York (CAGNY) Conference 2019 Sysco_Investors
 
Sysco Investor Presentation CAGNY 2015
Sysco Investor Presentation  CAGNY 2015Sysco Investor Presentation  CAGNY 2015
Sysco Investor Presentation CAGNY 2015Sysco_Investors
 
Sysco 2Q15 Earnings Results
Sysco 2Q15 Earnings ResultsSysco 2Q15 Earnings Results
Sysco 2Q15 Earnings ResultsSysco_Investors
 
4 q15 slides _final.pptx
4 q15 slides _final.pptx4 q15 slides _final.pptx
4 q15 slides _final.pptxSysco_Investors
 
Jefferies Consumer Summit
Jefferies Consumer SummitJefferies Consumer Summit
Jefferies Consumer SummitSysco_Investors
 
Sysco Q3 2017 Earnings Results
Sysco Q3 2017 Earnings ResultsSysco Q3 2017 Earnings Results
Sysco Q3 2017 Earnings ResultsSysco_Investors
 
Sysco 3Q16 Earnings Results
Sysco 3Q16 Earnings ResultsSysco 3Q16 Earnings Results
Sysco 3Q16 Earnings ResultsSysco_Investors
 

Similar to Sysco 2Q FY22 Earnings Results Highlights (20)

3q22-syy-earnings-slides.pdf
3q22-syy-earnings-slides.pdf3q22-syy-earnings-slides.pdf
3q22-syy-earnings-slides.pdf
 
Sysco 3Q FY21 Earnings Results
Sysco 3Q FY21 Earnings ResultsSysco 3Q FY21 Earnings Results
Sysco 3Q FY21 Earnings Results
 
Sysco Earnings Results 2Q20
Sysco Earnings Results 2Q20Sysco Earnings Results 2Q20
Sysco Earnings Results 2Q20
 
Sysco Earnings Results 4Q19
Sysco Earnings Results 4Q19Sysco Earnings Results 4Q19
Sysco Earnings Results 4Q19
 
2019 syy bernstein slides v final
2019 syy  bernstein slides v final2019 syy  bernstein slides v final
2019 syy bernstein slides v final
 
2019 cagny presentation v final2
2019 cagny presentation v final22019 cagny presentation v final2
2019 cagny presentation v final2
 
Sysco Earnings Results 3Q19
Sysco Earnings Results 3Q19Sysco Earnings Results 3Q19
Sysco Earnings Results 3Q19
 
Earnings slides-4q18
Earnings slides-4q18Earnings slides-4q18
Earnings slides-4q18
 
2019 cagny-presentation-vfinal
2019 cagny-presentation-vfinal2019 cagny-presentation-vfinal
2019 cagny-presentation-vfinal
 
Consumer Analyst Group of New York (CAGNY) Conference 2019
Consumer Analyst Group of New York (CAGNY) Conference 2019 Consumer Analyst Group of New York (CAGNY) Conference 2019
Consumer Analyst Group of New York (CAGNY) Conference 2019
 
2018 cagny presentation
2018 cagny presentation2018 cagny presentation
2018 cagny presentation
 
Sysco Investor Presentation CAGNY 2015
Sysco Investor Presentation  CAGNY 2015Sysco Investor Presentation  CAGNY 2015
Sysco Investor Presentation CAGNY 2015
 
Sysco 2Q15 Earnings Results
Sysco 2Q15 Earnings ResultsSysco 2Q15 Earnings Results
Sysco 2Q15 Earnings Results
 
4 q15 slides _final.pptx
4 q15 slides _final.pptx4 q15 slides _final.pptx
4 q15 slides _final.pptx
 
Slides 3 q15_final
Slides 3 q15_finalSlides 3 q15_final
Slides 3 q15_final
 
Jefferies Consumer Summit
Jefferies Consumer SummitJefferies Consumer Summit
Jefferies Consumer Summit
 
3 q14 earnings vfinal2
3 q14 earnings vfinal23 q14 earnings vfinal2
3 q14 earnings vfinal2
 
Q1 2015 Slides
Q1 2015 SlidesQ1 2015 Slides
Q1 2015 Slides
 
Sysco Q3 2017 Earnings Results
Sysco Q3 2017 Earnings ResultsSysco Q3 2017 Earnings Results
Sysco Q3 2017 Earnings Results
 
Sysco 3Q16 Earnings Results
Sysco 3Q16 Earnings ResultsSysco 3Q16 Earnings Results
Sysco 3Q16 Earnings Results
 

More from Sysco_Investors

Q3 FY24 Earnings Conference Call Presentation
Q3 FY24 Earnings Conference Call PresentationQ3 FY24 Earnings Conference Call Presentation
Q3 FY24 Earnings Conference Call PresentationSysco_Investors
 
4q23-syy-earnings-slides-v1.pdf
4q23-syy-earnings-slides-v1.pdf4q23-syy-earnings-slides-v1.pdf
4q23-syy-earnings-slides-v1.pdfSysco_Investors
 
4Q23 Earnings Call Presentation
4Q23 Earnings Call Presentation4Q23 Earnings Call Presentation
4Q23 Earnings Call PresentationSysco_Investors
 
3q23-syy-earnings-slides-v19.pdf
3q23-syy-earnings-slides-v19.pdf3q23-syy-earnings-slides-v19.pdf
3q23-syy-earnings-slides-v19.pdfSysco_Investors
 
Consumer Analyst Group of New York (CAGNY) Conference 2023
Consumer Analyst Group of New York (CAGNY) Conference 2023Consumer Analyst Group of New York (CAGNY) Conference 2023
Consumer Analyst Group of New York (CAGNY) Conference 2023Sysco_Investors
 
2q23-syy-earnings-slides.pdf
2q23-syy-earnings-slides.pdf2q23-syy-earnings-slides.pdf
2q23-syy-earnings-slides.pdfSysco_Investors
 
1q23-syy-earnings-slides.pdf
1q23-syy-earnings-slides.pdf1q23-syy-earnings-slides.pdf
1q23-syy-earnings-slides.pdfSysco_Investors
 
4q22-syy-earnings-slides.pdf
4q22-syy-earnings-slides.pdf4q22-syy-earnings-slides.pdf
4q22-syy-earnings-slides.pdfSysco_Investors
 

More from Sysco_Investors (9)

Q3 FY24 Earnings Conference Call Presentation
Q3 FY24 Earnings Conference Call PresentationQ3 FY24 Earnings Conference Call Presentation
Q3 FY24 Earnings Conference Call Presentation
 
4q23-syy-earnings-slides-v1.pdf
4q23-syy-earnings-slides-v1.pdf4q23-syy-earnings-slides-v1.pdf
4q23-syy-earnings-slides-v1.pdf
 
4Q23 Earnings Call Presentation
4Q23 Earnings Call Presentation4Q23 Earnings Call Presentation
4Q23 Earnings Call Presentation
 
3q23-syy-earnings-slides-v19.pdf
3q23-syy-earnings-slides-v19.pdf3q23-syy-earnings-slides-v19.pdf
3q23-syy-earnings-slides-v19.pdf
 
Consumer Analyst Group of New York (CAGNY) Conference 2023
Consumer Analyst Group of New York (CAGNY) Conference 2023Consumer Analyst Group of New York (CAGNY) Conference 2023
Consumer Analyst Group of New York (CAGNY) Conference 2023
 
2q23-syy-earnings-slides.pdf
2q23-syy-earnings-slides.pdf2q23-syy-earnings-slides.pdf
2q23-syy-earnings-slides.pdf
 
1q23-syy-earnings-slides.pdf
1q23-syy-earnings-slides.pdf1q23-syy-earnings-slides.pdf
1q23-syy-earnings-slides.pdf
 
4q22-syy-earnings-slides.pdf
4q22-syy-earnings-slides.pdf4q22-syy-earnings-slides.pdf
4q22-syy-earnings-slides.pdf
 
SYY Investor Day, NYC
SYY Investor Day, NYC SYY Investor Day, NYC
SYY Investor Day, NYC
 

Recently uploaded

VIP 7001035870 Find & Meet Hyderabad Call Girls Shamshabad high-profile Call ...
VIP 7001035870 Find & Meet Hyderabad Call Girls Shamshabad high-profile Call ...VIP 7001035870 Find & Meet Hyderabad Call Girls Shamshabad high-profile Call ...
VIP 7001035870 Find & Meet Hyderabad Call Girls Shamshabad high-profile Call ...aditipandeya
 
Collective Mining | Corporate Presentation - April 2024
Collective Mining | Corporate Presentation - April 2024Collective Mining | Corporate Presentation - April 2024
Collective Mining | Corporate Presentation - April 2024CollectiveMining1
 
如何办理密苏里大学堪萨斯分校毕业证(文凭)UMKC学位证书
如何办理密苏里大学堪萨斯分校毕业证(文凭)UMKC学位证书如何办理密苏里大学堪萨斯分校毕业证(文凭)UMKC学位证书
如何办理密苏里大学堪萨斯分校毕业证(文凭)UMKC学位证书Fir La
 
VIP 7001035870 Find & Meet Hyderabad Call Girls Miyapur high-profile Call Girl
VIP 7001035870 Find & Meet Hyderabad Call Girls Miyapur high-profile Call GirlVIP 7001035870 Find & Meet Hyderabad Call Girls Miyapur high-profile Call Girl
VIP 7001035870 Find & Meet Hyderabad Call Girls Miyapur high-profile Call Girladitipandeya
 
Collective Mining | Corporate Presentation - April 2024
Collective Mining | Corporate Presentation - April 2024Collective Mining | Corporate Presentation - April 2024
Collective Mining | Corporate Presentation - April 2024CollectiveMining1
 
如何办理(UTS毕业证书)悉尼科技大学毕业证学位证书
如何办理(UTS毕业证书)悉尼科技大学毕业证学位证书如何办理(UTS毕业证书)悉尼科技大学毕业证学位证书
如何办理(UTS毕业证书)悉尼科技大学毕业证学位证书Fis s
 
VIP Amritsar Call Girl 7001035870 Enjoy Call Girls With Our Escorts
VIP Amritsar Call Girl 7001035870 Enjoy Call Girls With Our EscortsVIP Amritsar Call Girl 7001035870 Enjoy Call Girls With Our Escorts
VIP Amritsar Call Girl 7001035870 Enjoy Call Girls With Our Escortssonatiwari757
 
Cyberagent_For New Investors_EN_240424.pdf
Cyberagent_For New Investors_EN_240424.pdfCyberagent_For New Investors_EN_240424.pdf
Cyberagent_For New Investors_EN_240424.pdfCyberAgent, Inc.
 
VIP Kolkata Call Girls Bidhannagar 8250192130 Available With Room
VIP Kolkata Call Girls Bidhannagar 8250192130 Available With RoomVIP Kolkata Call Girls Bidhannagar 8250192130 Available With Room
VIP Kolkata Call Girls Bidhannagar 8250192130 Available With Roomrran7532
 
Nicola Mining Inc. Corporate Presentation April 2024
Nicola Mining Inc. Corporate Presentation April 2024Nicola Mining Inc. Corporate Presentation April 2024
Nicola Mining Inc. Corporate Presentation April 2024nicola_mining
 

Recently uploaded (20)

VIP 7001035870 Find & Meet Hyderabad Call Girls Shamshabad high-profile Call ...
VIP 7001035870 Find & Meet Hyderabad Call Girls Shamshabad high-profile Call ...VIP 7001035870 Find & Meet Hyderabad Call Girls Shamshabad high-profile Call ...
VIP 7001035870 Find & Meet Hyderabad Call Girls Shamshabad high-profile Call ...
 
Call Girls 🫤 Hauz Khas ➡️ 9999965857 ➡️ Delhi 🫦 Russian Escorts FULL ENJOY
Call Girls 🫤 Hauz Khas ➡️ 9999965857  ➡️ Delhi 🫦  Russian Escorts FULL ENJOYCall Girls 🫤 Hauz Khas ➡️ 9999965857  ➡️ Delhi 🫦  Russian Escorts FULL ENJOY
Call Girls 🫤 Hauz Khas ➡️ 9999965857 ➡️ Delhi 🫦 Russian Escorts FULL ENJOY
 
Collective Mining | Corporate Presentation - April 2024
Collective Mining | Corporate Presentation - April 2024Collective Mining | Corporate Presentation - April 2024
Collective Mining | Corporate Presentation - April 2024
 
@9999965857 🫦 Sexy Desi Call Girls Vaishali 💓 High Profile Escorts Delhi 🫶
@9999965857 🫦 Sexy Desi Call Girls Vaishali 💓 High Profile Escorts Delhi 🫶@9999965857 🫦 Sexy Desi Call Girls Vaishali 💓 High Profile Escorts Delhi 🫶
@9999965857 🫦 Sexy Desi Call Girls Vaishali 💓 High Profile Escorts Delhi 🫶
 
如何办理密苏里大学堪萨斯分校毕业证(文凭)UMKC学位证书
如何办理密苏里大学堪萨斯分校毕业证(文凭)UMKC学位证书如何办理密苏里大学堪萨斯分校毕业证(文凭)UMKC学位证书
如何办理密苏里大学堪萨斯分校毕业证(文凭)UMKC学位证书
 
Call Girls 🫤 Mukherjee Nagar ➡️ 9999965857 ➡️ Delhi 🫦 Russian Escorts FULL ...
Call Girls 🫤 Mukherjee Nagar ➡️ 9999965857  ➡️ Delhi 🫦  Russian Escorts FULL ...Call Girls 🫤 Mukherjee Nagar ➡️ 9999965857  ➡️ Delhi 🫦  Russian Escorts FULL ...
Call Girls 🫤 Mukherjee Nagar ➡️ 9999965857 ➡️ Delhi 🫦 Russian Escorts FULL ...
 
Russian Call Girls Rohini Sector 22 💓 Delhi 9999965857 @Sabina Modi VVIP MODE...
Russian Call Girls Rohini Sector 22 💓 Delhi 9999965857 @Sabina Modi VVIP MODE...Russian Call Girls Rohini Sector 22 💓 Delhi 9999965857 @Sabina Modi VVIP MODE...
Russian Call Girls Rohini Sector 22 💓 Delhi 9999965857 @Sabina Modi VVIP MODE...
 
VIP 7001035870 Find & Meet Hyderabad Call Girls Miyapur high-profile Call Girl
VIP 7001035870 Find & Meet Hyderabad Call Girls Miyapur high-profile Call GirlVIP 7001035870 Find & Meet Hyderabad Call Girls Miyapur high-profile Call Girl
VIP 7001035870 Find & Meet Hyderabad Call Girls Miyapur high-profile Call Girl
 
Collective Mining | Corporate Presentation - April 2024
Collective Mining | Corporate Presentation - April 2024Collective Mining | Corporate Presentation - April 2024
Collective Mining | Corporate Presentation - April 2024
 
如何办理(UTS毕业证书)悉尼科技大学毕业证学位证书
如何办理(UTS毕业证书)悉尼科技大学毕业证学位证书如何办理(UTS毕业证书)悉尼科技大学毕业证学位证书
如何办理(UTS毕业证书)悉尼科技大学毕业证学位证书
 
VIP Amritsar Call Girl 7001035870 Enjoy Call Girls With Our Escorts
VIP Amritsar Call Girl 7001035870 Enjoy Call Girls With Our EscortsVIP Amritsar Call Girl 7001035870 Enjoy Call Girls With Our Escorts
VIP Amritsar Call Girl 7001035870 Enjoy Call Girls With Our Escorts
 
Model Call Girl in Udyog Vihar Delhi reach out to us at 🔝9953056974🔝
Model Call Girl in Udyog Vihar Delhi reach out to us at 🔝9953056974🔝Model Call Girl in Udyog Vihar Delhi reach out to us at 🔝9953056974🔝
Model Call Girl in Udyog Vihar Delhi reach out to us at 🔝9953056974🔝
 
(👉゚9999965857 ゚)👉 VIP Call Girls Greater Noida 👉 Delhi 👈 : 9999 Cash Payment...
(👉゚9999965857 ゚)👉 VIP Call Girls Greater Noida  👉 Delhi 👈 : 9999 Cash Payment...(👉゚9999965857 ゚)👉 VIP Call Girls Greater Noida  👉 Delhi 👈 : 9999 Cash Payment...
(👉゚9999965857 ゚)👉 VIP Call Girls Greater Noida 👉 Delhi 👈 : 9999 Cash Payment...
 
Call Girls 🫤 Mahipalpur ➡️ 9999965857 ➡️ Delhi 🫦 Russian Escorts FULL ENJOY
Call Girls 🫤 Mahipalpur ➡️ 9999965857  ➡️ Delhi 🫦  Russian Escorts FULL ENJOYCall Girls 🫤 Mahipalpur ➡️ 9999965857  ➡️ Delhi 🫦  Russian Escorts FULL ENJOY
Call Girls 🫤 Mahipalpur ➡️ 9999965857 ➡️ Delhi 🫦 Russian Escorts FULL ENJOY
 
Cyberagent_For New Investors_EN_240424.pdf
Cyberagent_For New Investors_EN_240424.pdfCyberagent_For New Investors_EN_240424.pdf
Cyberagent_For New Investors_EN_240424.pdf
 
VIP Kolkata Call Girls Bidhannagar 8250192130 Available With Room
VIP Kolkata Call Girls Bidhannagar 8250192130 Available With RoomVIP Kolkata Call Girls Bidhannagar 8250192130 Available With Room
VIP Kolkata Call Girls Bidhannagar 8250192130 Available With Room
 
Call Girls 🫤 Nehru Place ➡️ 9999965857 ➡️ Delhi 🫦 Russian Escorts FULL ENJOY
Call Girls 🫤 Nehru Place ➡️ 9999965857  ➡️ Delhi 🫦  Russian Escorts FULL ENJOYCall Girls 🫤 Nehru Place ➡️ 9999965857  ➡️ Delhi 🫦  Russian Escorts FULL ENJOY
Call Girls 🫤 Nehru Place ➡️ 9999965857 ➡️ Delhi 🫦 Russian Escorts FULL ENJOY
 
Nicola Mining Inc. Corporate Presentation April 2024
Nicola Mining Inc. Corporate Presentation April 2024Nicola Mining Inc. Corporate Presentation April 2024
Nicola Mining Inc. Corporate Presentation April 2024
 
@9999965857 🫦 Sexy Desi Call Girls Karol Bagh 💓 High Profile Escorts Delhi 🫶
@9999965857 🫦 Sexy Desi Call Girls Karol Bagh 💓 High Profile Escorts Delhi 🫶@9999965857 🫦 Sexy Desi Call Girls Karol Bagh 💓 High Profile Escorts Delhi 🫶
@9999965857 🫦 Sexy Desi Call Girls Karol Bagh 💓 High Profile Escorts Delhi 🫶
 
Call Girls In South Delhi 📱 9999965857 🤩 Delhi 🫦 HOT AND SEXY VVIP 🍎 SERVICE
Call Girls In South Delhi 📱  9999965857  🤩 Delhi 🫦 HOT AND SEXY VVIP 🍎 SERVICECall Girls In South Delhi 📱  9999965857  🤩 Delhi 🫦 HOT AND SEXY VVIP 🍎 SERVICE
Call Girls In South Delhi 📱 9999965857 🤩 Delhi 🫦 HOT AND SEXY VVIP 🍎 SERVICE
 

Sysco 2Q FY22 Earnings Results Highlights

  • 1. Sysco 2Q FY22 Earnings Results February 8, 2022
  • 2. Forward Looking Statements Statements made in this presentation or in our earnings call for the second quarter of fiscal 2022 that look forward in time or that express management’s beliefs, expectations or hopes are forward-looking statements within the meaning of the Private Securities Litigation Reform Act of 1995. Such forward-looking statements reflect the views of management at the time such statements are made and are subject to a number of risks, uncertainties, estimates, and assumptions that may cause actual results to differ materially from current expectations. These statements include statements concerning: the effect, impact, potential duration or other implications of the coronavirus (“COVID-19”) pandemic and any expectations we may have with respect thereto, including the extent and duration of lockdowns in the U.S. and Europe; our expectations regarding the impact of the Omicron variant on operating results and our expectations regarding our ability to return to our growth pattern of improved sales and volume performance as the Omicron variant recedes; our expectations regarding the pace and timing of the business recovery in the U.S. and Europe; our expectations that our transformational agenda will drive long-term growth; our expectations regarding the continuation of an inflationary environment; our belief that incremental expenses within our supply chain, driven by labor costs, will improve over time; our expectations regarding the impact of our Recipe for Growth strategy and our belief that this strategy will uniquely position Sysco to win in the marketplace for the long-term; our expectations regarding Sysco’s ability to outperform the market in future periods; our expectations that our strategic priorities will enable us to grow faster than the market; our expectations regarding our efforts to reduce overtime rates and the incremental investments in hiring; our expectations regarding our ability to move our newer associates up the productivity curve over time; our belief that our approach to ensure we can ship on-time and in full will benefit our relationship with our customers for the long-term and positively impact retention and growth; our expectations regarding the impact of our growth initiatives and their ability to enable Sysco to consistently outperform the market; our expectations regarding the impact of the Greco and Sons acquisition on our business; our expectations regarding our ability to grow faster than the total market in fiscal 2022 and to exceed our growth target for fiscal 2022; our expectations regarding the expansion of our Sysco Your Way initiative; our expectations regarding labor costs in the fiscal third quarter; our ability to deliver against our strategic priorities; economic trends in the United States and abroad; our plans to make continued capital investments over the next three fiscal years in our technology, fleet and buildings; our expectations regarding our dividend payments in calendar year 2022 and in future periods; our future growth; our expectations regarding profits and sales in fiscal 2022; the pace of implementation of our business transformation initiatives; our expectations regarding our adjusted earnings per share growth in fiscal 2024; our expectations regarding our earnings per share in fiscal 2022; our expectations regarding our performance in the fiscal third and fourth quarters; our plans to improve associate retention, training and productivity; our belief that our Recipe for Growth transformation is creating capabilities that will help us profitably grow for the long term; our belief in our ability to grow our share profitably and to become more efficient; and our expectations regarding the decline of snap-back costs in the fiscal third quarter. The success of our plans and expectations regarding our operating performance are subject to the general risks associated with our business, including the risks of interruption of supplies due to lack of long-term contracts, severe weather, crop conditions, work stoppages, intense competition, technology disruptions, dependence on large, long-term regional and national customers, inflation risks, the impact of fuel prices, adverse publicity, labor issues, political or financial instability, trade restrictions, tariffs, currency exchange rates, transport capacity and costs and other factors relating to foreign trade, any or all of which could delay our receipt of product or increase our input costs. Risks and uncertainties also include the impact and effects of public health crises, pandemics and epidemics, such as the COVID-19 pandemic, and the adverse impact thereof on our business, financial condition and results of operations, including, but not limited to, our growth, product costs, supply chain, labor availability, logistical capabilities, customer demand for our products and industry demand generally, consumer spending, our liquidity, the price of our securities and trading markets with respect thereto, our credit ratings, our ability to maintain compliance with the covenants in our credit agreement, our ability to access capital markets, and the global economy and financial markets generally. Risks and uncertainties also include risks impacting the economy generally, including the risks that the current general economic conditions will deteriorate, or consumer confidence in the economy or consumer spending, particularly on food-away-from-home, may decline. Market conditions may not improve. Competition and the impact of GPOs may reduce our margins and make it difficult for us to maintain our market share, growth rate and profitability. We may not be able to fully compensate for increases in fuel costs, and fuel hedging arrangements intended to contain fuel costs could result in above market fuel costs. Our ability to meet our long-term strategic objectives depends on our ability to grow gross profit, leverage our supply chain costs and reduce administrative costs. This will depend largely on the success of our various business initiatives, including efforts related to revenue management, expense management, our digital e-commerce strategy and any efforts related to restructuring or the reduction of administrative costs. There are various risks related to these efforts, including the risk that if sales from our locally managed customers do not grow at the same rate as sales from regional and national customers, or if we are unable to continue to accelerate local case growth, our gross margins may decline; the risk that we are unlikely to be able to predict inflation over the long term, and lower inflation is likely to produce lower gross profit; the risk that our efforts to mitigate increases in warehouse costs may be unsuccessful; the risk that we may not be able to accelerate and/or identify additional administrative cost savings in order to compensate for any gross profit or supply chain cost leverage challenges; the risk that these efforts may not provide the expected benefits in our anticipated time frame, if at all, and may prove costlier than expected; the risk that the actual costs of any initiatives may be greater or less than currently expected; and the risk of adverse effects to our business, results of operations and liquidity if past and future undertakings, and the associated changes to our business, do not prove to be cost effective or do not result in the cost savings and other benefits at the levels that we anticipate. Our plans related to and the timing of any initiatives are subject to change at any time based on management’s subjective evaluation of our overall business needs. If we are unable to realize the anticipated benefits from our efforts, we could become cost disadvantaged in the marketplace, and our competitiveness and our profitability could decrease. Adverse publicity about us or lack of confidence in our products could negatively impact our reputation and reduce earnings. Capital expenditures may vary based on changes in business plans and other factors, including risks related to the implementation of various initiatives, the timing and successful completion of acquisitions, construction schedules and the possibility that other cash requirements could result in delays or cancellations of capital spending. Periods of significant or prolonged inflation or deflation, either overall or in certain product categories, can have a negative impact on us and our customers, as high food costs can reduce consumer spending in the food-away-from-home market, and may negatively impact our sales, gross profit, operating income and earnings, and periods of deflation can be difficult to manage effectively. Fluctuations in inflation and deflation, as well as fluctuations in the value of foreign currencies, are beyond our control and subject to broader market forces. Expanding into international markets presents unique challenges and risks, including compliance with local laws, regulations and customs and the impact of local political and economic conditions, including the impact of Brexit and the “yellow vest” protests in France against a fuel tax increase, pension reform and the French government, and such expansion efforts may not be successful. Any business that we acquire may not perform as expected, and we may not realize the anticipated benefits of our acquisitions. Expectations regarding the financial statement impact of any acquisitions may change based on management’s subjective evaluation. A divestiture of one or more of our businesses may not provide the anticipated effects on our operations. Meeting our dividend target objectives depends on our level of earnings, available cash and the success of our various strategic initiatives. Changes in applicable tax laws or regulations and the resolution of tax disputes could negatively affect our financial results. We rely on technology in our business and any cybersecurity incident, other technology disruption or delay in implementing new technology could negatively affect our business and our relationships with customers. For a discussion of additional factors impacting Sysco’s business, see our Annual Report on Form 10-K for the year ended July 3, 2021, as filed with the SEC, and our subsequent filings with the SEC. We do not undertake to update our forward-looking statements, except as required by applicable law. 2
  • 4. Sysco’s 2QFY22 Results Show Strong Gains Fiscal 2Q 2022 Highlights Sysco delivered another quarter of strong sales growth compared to fiscal 2019 levels, which continued to result in significant share gains. Inflation was effectively managed; however, staffing challenges, labor expense and supply-chain headwinds negatively impacted profitability. Sysco repurchased $416 million of common stock and delivered $201 million of free cash flow. +10.5% +4.3% $671 million >1.2x $0.57 Revenue growth compared to fiscal 2Q 2019 Gross profit growth compared to fiscal 2Q 2019 and gross profit per case increased across all operating segments in the quarter Adjusted EBITDA1 strong but hampered by staffing, inflation and supply chain challenges as well as transformation costs Now expect to exceed our prior forecast of growth of 1.2x the market in fiscal 2022 Adjusted EPS1 4 1 See Non-GAAP reconciliations at the end of the presentation.
  • 5. Sysco Continues to Outperform Total Foodservice Industry Resulting in Share Gains 5 Source: Technomic Tindex – Each month’s $ FS consumer sales correspond to the same month in 2019 where the index = 100. Sysco US Ops sales vs. 2019 USFS Ops Revenue Indexed to 2019 vs Technomic Market Estimated Indexed to 2019 Since the start of the pandemic, Sysco has performed better than the total foodservice market vs 2019 Q1'21 Q2'21 Q3'21 Q4'21 Q1'22 Q2'22 Sysco - US Ops Total Market Ex-Sysco 100 index
  • 6. No Sysco Sysco Only Sysco is Growing the Number of Exclusive Independent Customers; Number of Customers Not Yet Using Sysco is Steadily Declining Source: NPD 6 28.0% 28.5% 29.0% 29.5% 30.0% 30.5% 31.0% 31.5% 32.0% 53.0% 53.5% 54.0% 54.5% 55.0% 55.5% 56.0% 56.5% 57.0% Feb 2020 Mar 2020 Apr 2020 May 2020 Jun 2020 Jul 2020 Aug 2020 Sep 2020 Oct 2020 Nov 2020 Dec 2020 Jan 2021 Feb 2021 Mar 2021 Apr 2021 May 2021 Jun 2021 Jul 2021 Aug 2021 Sep 2021 Oct 2021 Nov 2021 Dec 2021 No Sysco Sysco Only
  • 7. Sysco is Well Positioned for Long-Term Growth Acceleration 7 202 1 • Sales growth of 10.5% above fiscal 2019 levels with continued meaningful share gains • Gross profit per case increased across all operating segments in the quarter • Actively managed cost inflation, staffing and supply chain challenges • Expect to exceed our prior forecast of growth of 1.2x the industry in fiscal 2022 • Recipe for Growth driving market share gains and industry leading NPS scores • Returned over $650 million to shareholders in the quarter via share repurchases and dividends
  • 9. 2Q 2022 Consolidated Financial Results 9 $14.8 $11.6 $16.3 Net Sales (billions) $752 $412 $671 Adj. EBITDA1 (millions) $0.75 $0.17 $0.57 Adj. EPS1 Q2 2019 Q2 2021 Q2 2022 Q2 2019 Q2 2021 Q2 2022 Q2 2019 Q2 2021 Q2 2022 Overview • Sales growth of 10.5% above fiscal 2019 levels with continued meaningful share gains • Product cost inflation effectively managed • Gross profit per case increased across all operating segments • Profitability negatively impacted by Omicron and higher labor costs • Returned over $650 million to shareholders in the quarter via share repurchases and dividend • Recipe for Growth wins are supporting NPS score better than the competition 1 See Non-GAAP reconciliations at the end of the presentation.
  • 10. Snap-back and Transformation Investments Impacting Operating Costs 10 $ 36M $ 57M $ 73M $ 51M $ 24M $ 44M $- $20 $40 $60 $80 $100 $120 Q4 2021 Q1 2022 Q2 2022 Millions Snap-back and Transformation Costs by Quarter Snap-back Transformation Costs Overview • Continued transformation investments for our Recipe For Growth ($44M in 2Q 2022) • Snap-back investments ($73M in 2Q 2022) driven by recruiting, hiring marketing, sign- on, retention, training, vaccination incentives/promotion and contract labor • Snap-back investments do not include structural increases (which have been modest) • Snap-back investments are projected to improve in 2H 2022
  • 11. 2Q 2022 U.S. Foodservice Results 11 $10.1 $7.9 $11.5 Net Sales (billions) $737 $472 $685 Adj. Operating Income1 (millions) Q2 2019 Q2 2021 Q2 2022 Q2 2019 Q2 2021 Q2 2022 Overview • Sales growth of 14.0% above fiscal 2019 levels • Above-industry growth resulting in meaningful share gains • Within U.S. Broadline operations, local case volume increased 17.6% and total case volume increased 22.5% compared to prior year • Gross profit increased 37.2% to $2.1 billion compared to prior year, gross margin decreased 107 basis points to 18.6% • U.S. Broadline product cost inflation was 14.6% primarily driven by the meat and poultry categories 1 See Non-GAAP reconciliations at the end of the presentation.
  • 12. 2Q 2022 SYGMA Results SYGMA 12 $1.5 $1.5 $1.8 Net Sales (billions) $3 $11 -$7 Adj. Operating Income1 (millions) Q2 2019 Q2 2021 Q2 2022 Q2 2019 Q2 2021 Q2 2022 Overview • Sales growth of 15.3% above fiscal 2019 levels • Operating loss vs. prior year impacted by record profits in the prior year, a previously disclosed large customer rationalization and elevated operating costs • Expecting an improvement in future quarters by actions already taken by the company 1 See Non-GAAP reconciliations at the end of the presentation.
  • 13. 2Q 2022 International Results 13 $2.9 $2.0 $2.8 Net Sales (billions) $83 -$55 $40 Adj. Operating Income1 (millions) Q2 2019 Q2 2021 Q2 2022 Q2 2019 Q2 2021 Q2 2022 Overview • Sales 2.9% below fiscal 2019 levels • Foreign exchange rates had a positive impact of 1.7% on sales • Omicron-driven lockdowns in International markets negatively impacted December sales • Gross profit increased 51.4% compared to prior year, gross margin increased 116 basis points to 20.2% • Two consecutive quarters of operating profit in the segment despite heavy government restrictions and Omicron 1 See Non-GAAP reconciliations at the end of the presentation.
  • 14. 14 1H 2022 Cash Flow $918 $937 $377 Cash from Operations (millions) $701 $788 $201 Free Cash Flow1 (millions) 1H 2019 1H 2021 1H 2022 1H 2019 1H 2021 1H 2022 Overview • Cash from operations was $377 million for the first half of the year driven by investments in working capital as the company prioritized managing product availability • Net capital expenditures totaled $176 million for the first half of the year • During the second quarter, the Company repurchased 5.7 million shares of its common stock for a total of $416 million, or an average price of $72.30 per share 1 See Non-GAAP reconciliations at the end of the presentation.
  • 15. Capital Structure and Allocation 15 Investment Priority Progress Invest for Growth • Continued capital investments over the next three fiscal years in our technology, fleet and buildings • Announced acquisition of The Coastal Companies, bolstering our fresh produce offering in the Mid- Atlantic • Strong pipeline of tuck-in acquisitions focused on Broadline, Specialty and Cuisine-type opportunities as well as underpenetrated markets in the U.S., U.K. and Canada Maintain a Strong Balance Sheet • Committed to IG rating • Over $3.4 billion of deleveraging in FY 2021 • Refinanced $1.25 billion of debt during 2Q 2022 at more attractive rates and longer maturities Shareholder Return • Paid dividend of $0.47 per share in October • 52 consecutive years of dividend increases. We are committed to our dividend aristocrat status • During 2Q 2022, we repurchased 5.7 million shares of common stock for a total of $416 million, or an average price of $72.30 per share as part of our $5 billion share repurchase authorization in place 1 2 3
  • 16. Sysco Consistently Increases Returns to Shareholders 16 $0.7B $ 3.3B $ 5.9B $ 7.6B $ 9.4B $ 11.1B $12.0B $ 12.9B FY2015 FY2016 FY2017 FY2018 FY2019 FY2020 FY2021 FY2022 (Q2 YTD) Cumulative Cash Returned to Shareholders Dividends Shares Repurchased Over $12 Billion of Cash Returned to Shareholders Since Fiscal 2015
  • 18. Current Share Gains Lead to Long-term Confidence 18 Strong top-line performance Exceeding 1.2x market share growth Expecting volume recovery post Omicron Operating expenses projected to improve in 2H 2022 Confident in our Long-Term Trajectory Reaffirming our Long-Term Guidance
  • 19.
  • 21. Impact of Certain Items Our discussion of our results includes certain non-GAAP financial measures, including EBITDA and adjusted EBITDA, that we believe provide important perspective with respect to underlying business trends. Other than free cash flow, any non-GAAP financial measures will be denoted as adjusted measures to remove the impact of restructuring and transformational project costs consisting of: (1) restructuring charges, (2) expenses associated with our various transformation initiatives and (3) facility closure and severance charges; acquisition-related costs consisting of: (1) intangible amortization expense and (2) acquisition costs and due diligence costs related to our acquisitions; and the reduction of bad debt expense previously recognized in fiscal 2020 due to the impact of the COVID-19 pandemic on the collectability of our pre-pandemic trade receivable balances. Our results for fiscal 2022 were also impacted by debt extinguishment costs and the increase in reserves for uncertain tax positions. Our results for the first 26 weeks of fiscal 2021 were also impacted by a loss on the sale of a business. The results of our foreign operations can be impacted due to changes in exchange rates applicable in converting local currencies to U.S. dollars. We measure our total Sysco and our International Foodservice Operations results on a constant currency basis. Constant currency operating results are calculated by translating current-period local currency operating results with the currency exchange rates used to translate the financial statements in the comparable prior-year period to determine what the current-period U.S. dollar operating results would have been if the currency exchange rate had not changed from the comparable prior-year period. Management believes that adjusting its operating expenses, operating income, net earnings and diluted earnings per share to remove these Certain Items and presenting its International Foodservice Operations results on a constant currency basis, provides an important perspective with respect to our underlying business trends and results and provides meaningful supplemental information to both management and investors that (1) is indicative of the performance of the company’s underlying operations and (2) facilitates comparisons on a year-over-year basis. Sysco has a history of growth through acquisitions and excludes from its non-GAAP financial measures the impact of acquisition-related intangible amortization, acquisition costs and due-diligence costs for those acquisitions. We believe this approach significantly enhances the comparability of Sysco’s results for fiscal 2022 and fiscal 2021. Set forth below is a reconciliation of sales, operating expenses, operating income, other (income) expense, net earnings and diluted earnings per share to adjusted results for these measures for the periods presented. Individual components of diluted earnings per share may not add up to the total presented due to rounding. Adjusted diluted earnings per share is calculated using adjusted net earnings divided by diluted shares outstanding. 21
  • 22. Sysco Corporation and its Consolidated Subsidiaries Non-GAAP Reconciliation (Unaudited) Impact of Certain Items, 2Q22 vs. 2Q21 (Dollars in Thousands, Except for Share and Per Share Data) 22 13-Week Period Ended Jan. 1, 2022 13-Week Period Ended Dec. 26, 2020 Change in Dollars % Change Sales (GAAP) $ 16,320,203 $ 11,558,982 $ 4,761,221 41.2% Impact of currency fluctuations (1) (36,077) - (36,077) -0.3% Comparable sales using a constant currency basis (Non-GAAP) $ 16,284,126 $ 11,558,982 $ 4,725,144 40.9% Gross Profit (GAAP) 2,891,150 2,098,458 792,692 37.8% Impact of currency fluctuations (1) (4,687) - (4,687) -0.2% Comparable gross profit using a constant currency basis (Non-GAAP) $ 2,886,463 $ 2,098,458 $ 788,005 37.6% Gross margin (GAAP) 17.72% 18.15% -44 bps Impact of currency fluctuations (1) 0.01% 0% 1 bps Comparable Gross margin using a Constant Dollar Basis (Non-GAAP) 17.73% 18.15% -43 bps Operating expenses (GAAP) $ 2,446,241 $ 1,886,396 $ 559,845 29.7% Impact of restructuring and transformational project costs (2) (23,469) (34,160) 10,691 31.3% Impact of acquisition-related costs (3) (33,732) (18,125) (15,607) -86.1% Impact of bad debt reserve adjustments (4) 6,438 30,271 (23,833) -78.7% Operating expenses adjusted for Certain Items (Non-GAAP) 2,395,478 1,864,382 531,096 28.5% Impact of currency fluctuations (1) (3,433) - (3,433) -0.2% Comparable operating expenses adjusted for Certain Items using a constant currency basis (Non-GAAP) $ 2,392,045 $ 1,864,382 $ 527,663 28.3% Operating income (GAAP) $ 444,909 $ 212,062 $ 232,847 109.8% Impact of restructuring and transformational project costs (2) 23,469 34,160 (10,691) -31.3% Impact of acquisition-related costs (3) 33,732 18,125 15,607 86.1% Impact of bad debt reserve adjustments (4) (6,438) (30,271) 23,833 78.7% Operating income adjusted for Certain Items (Non-GAAP) 495,672 234,076 261,596 111.8% Impact of currency fluctuations (1) (1,255) - (1,255) -0.5% Comparable operating income adjusted for Certain Items using a constant currency basis (Non-GAAP) $ 494,417 $ 234,076 $ 260,341 111.2%
  • 23. 23 Sysco Corporation and its Consolidated Subsidiaries Non-GAAP Reconciliation (Unaudited) Impact of Certain Items, 2Q22 vs. 2Q21 (Dollars in Thousands, Except for Share and Per Share Data) continued Interest expense (GAAP) $ 242,899 $ 146,498 $ 96,401 65.8% Impact of loss on extinguishment of debt (115,603) - (115,603) NM Interest expense adjusted for certain items (Non-GAAP) $ 127,296 $ 146,498 $ (19,202) -13.1% Net earnings (GAAP) $ 167,441 $ 67,289 $ 100,152 148.8% Impact of restructuring and transformational project costs (2) 23,469 34,160 (10,691) -31.3% Impact of acquisition-related costs (3) 33,732 18,125 15,607 86.1% Impact of bad debt reserve adjustments (4) (6,438) (30,271) 23,833 78.7% Impact of loss on extinguishment of debt 115,603 - 115,603 NM Tax impact of restructuring and transformational project costs (5) (5,897) (10,666) 4,769 44.7% Tax impact of acquisition-related costs (5) (8,475) (5,850) (2,625) -44.9% Tax Impact of bad debt reserve adjustments (5) 1,617 13,071 (11,454) -87.6% Tax impact of loss on extinguishment of debt (5) (29,111) - (29,111) NM Net earnings adjusted for Certain Items (Non-GAAP) $ 291,941 $ 85,858 $ 206,083 240.0% Diluted earnings per share (GAAP) $ 0.33 $ 0.13 $ 0.20 153.8% Impact of restructuring and transformational project costs (2) 0.05 0.07 (0.02) -28.6% Impact of acquisition-related costs (3) 0.07 0.04 0.03 75.0% Impact of bad debt reserve adjustments (4) (0.01) (0.06) 0.05 83.3% Impact of loss on extinguishment of debt 0.22 - 0.22 NM Tax impact of restructuring and transformational project costs (5) (0.01) (0.02) 0.01 50.0% Tax impact of acquisition-related costs (5) (0.02) (0.01) (0.01) -100.0% Tax Impact of bad debt reserve adjustments (5) - 0.03 (0.03) NM Tax impact of loss on extinguishment of debt (5) (0.06) - (0.06) NM Diluted earnings per share adjusted for Certain Items (Non-GAAP) (6) $ 0.57 $ 0.17 $ 0.40 235.3% Diluted shares outstanding 514,574,889 512,742,792 NM represents that the percentage change is not meaningful. (5) The tax impact of adjustments for Certain Items is calculated by multiplying the pretax impact of each Certain Item by the statutory rates in effect for each jurisdiction where the Certain Item was incurred. (6) Individual components of diluted earnings per share may not add up to the total presented due to rounding. Total diluted earnings per share is calculated using adjusted net earnings divided by diluted shares outstanding. (3) Fiscal 2022 includes $27 million of intangible amortization expense and $7 million in acquisition and due diligence costs. Fiscal 2021 represents intangible amortization expense. (2) Fiscal 2022 includes $12 million related to restructuring, severance, and facility closure charges and $12 million related to various transformation initiative costs, primarily consisting of changes to our business technology strategy. Fiscal 2021 $22 million is related to restructuring charges and $12 million related to various transformation initiative costs, primarily consisting of changes to our business technology strategy. (4) Fiscal 2022 and 2021 represent the reduction of bad debt charges previously taken on pre-pandemic trade receivable balances in fiscal 2020. (1) Represents a constant currency adjustment, which eliminates the impact of foreign currency fluctuations on the current year results.
  • 24. 24 Sysco Corporation and its Consolidated Subsidiaries Non-GAAP Reconciliation (Unaudited) Impact of Certain Items, 2Q22 vs. 2Q19 (Dollars in Thousands, Except for Share and Per Share Data) 13-Week Period Ended Jan. 1, 2022 13-Week Period Ended Dec. 29, 2018 Change in Dollars % Change Sales (GAAP) $ 16,320,203 $ 14,765,707 $ 1,554,496 10.5% Gross Profit (GAAP) 2,891,150 2,771,712 119,438 4.3% Gross margin (GAAP) 17.72% 18.77% -106 bps Operating expenses (GAAP) $ 2,446,241 $ 2,319,817 $ 126,424 5.4% Impact of restructuring and transformational project costs (1) (23,469) (134,436) 110,967 82.5% Impact of acquisition-related costs (2) (33,732) (17,008) (16,724) -98.3% Impact of bad debt reserve adjustments (3) 6,438 - 6,438 NM Operating expenses adjusted for Certain Items (Non-GAAP) $ 2,395,478 $ 2,168,373 $ 227,105 10.5% Operating income (GAAP) $ 444,909 $ 451,895 $ (6,986) -1.5% Impact of restructuring and transformational project costs (1) 23,469 134,436 (110,967) -82.5% Impact of acquisition-related costs (2) 33,732 17,008 16,724 98.3% Impact of bad debt reserve adjustments (3) (6,438) - (6,438) NM Operating income adjusted for Certain Items (Non-GAAP) $ 495,672 $ 603,339 $ (107,667) -17.8% Interest expense (GAAP) $ 242,899 $ 87,113 $ 155,786 178.8% Impact of loss on extinguishment of debt (115,603) - (115,603) NM Interest expense adjusted for certain items (Non-GAAP) $ 127,296 $ 87,113 $ 40,183 46.1% Net earnings (GAAP) $ 167,441 $ 267,380 $ (99,939) -37.4% Impact of restructuring and transformational project costs (1) 23,469 134,436 (110,967) -82.5% Impact of acquisition-related costs (2) 33,732 17,008 16,724 98.3% Impact of bad debt reserve adjustments (3) (6,438) - (6,438) NM Impact of loss on extinguishment of debt 115,603 - 115,603 NM Tax impact of restructuring and transformational project costs (4) (5,897) (34,886) 28,989 83.1% Tax impact of acquisition-related costs (4) (8,475) (5,611) (2,864) -51.0% Tax Impact of bad debt reserve adjustments (4) 1,617 - 1,617 NM Tax impact of loss on extinguishment of debt (4) (29,111) - (29,111) NM Impact of adjustments to uncertain tax positions - 15,154 (15,154) NM Net earnings adjusted for Certain Items (Non-GAAP) $ 291,941 $ 393,481 $ (101,540) -25.8%
  • 25. 25 Sysco Corporation and its Consolidated Subsidiaries Non-GAAP Reconciliation (Unaudited) Impact of Certain Items, 2Q22 vs. 2Q19 (Dollars in Thousands, Except for Share and Per Share Data) continued Diluted earnings per share (GAAP) $ 0.33 $ 0.51 $ (0.18) -35.3% Impact of restructuring and transformational project costs (1) 0.05 0.26 (0.21) -80.8% Impact of acquisition-related costs (2) 0.07 0.03 0.04 133.3% Impact of bad debt reserve adjustments (3) (0.01) - (0.01) NM Impact of loss on extinguishment of debt 0.22 - 0.22 NM Tax impact of restructuring and transformational project costs (4) (0.01) (0.07) 0.06 85.7% Tax impact of acquisition-related costs (4) (0.02) (0.01) (0.01) -100.0% Tax impact of loss on extinguishment of debt (4) (0.06) - (0.06) NM Impact of adjustments to uncertain tax positions - 0.03 (0.03) NM Diluted earnings per share adjusted for Certain Items (Non-GAAP) (5) $ 0.57 $ 0.75 $ (0.18) -24.0% Diluted shares outstanding 514,574,889 524,600,510 NM represents that the percentage change is not meaningful. (1) Fiscal 2022 includes $12 million related to restructuring, severance, and facility closure charges and $12 million related to various transformation initiative costs, primarily consisting of changes to our business technology strategy. Fiscal 2019 includes $53 million related to various transformation initiative costs, primarily consisting of changes to our business technology strategy, of which $17 million relates to accelerated depreciation related to software that is being replaced, and $81 million related to severance, restructuring and facility closure charges in Europe and Canada, of which $55 million relates to our France restructuring as part of our integration of Brake France and Davigel into Sysco France. (2) Fiscal 2022 includes $27 million of intangible amortization expense and $7 million in acquisition and due diligence costs. Fiscal 2019 includes intangible amortization expense. (3) Fiscal 2022 represents the reduction of bad debt charges previously taken on pre-pandemic trade receivable balances in fiscal 2020. (4) The tax impact of adjustments for Certain Items is calculated by multiplying the pretax impact of each Certain Item by the statutory rates in effect for each jurisdiction where the Certain Item was incurred. (5) Individual components of diluted earnings per share may not add up to the total presented due to rounding. Total diluted earnings per share is calculated using adjusted net earnings divided by diluted shares outstanding.
  • 26. Earnings Before Interest, Taxes, Depreciation and Amortization (EBITDA) 26 EBITDA represents net earnings plus (i) interest expense, (ii) income tax expense and benefit, (iii) depreciation and (iv) amortization. The net earnings component of our EBITDA calculation is impacted by Certain Items that we do not consider representative of our underlying performance. As a result, in the non-GAAP reconciliations below for each period presented, adjusted EBITDA is computed as EBITDA plus the impact of Certain Items, excluding Certain items related to interest expense, income taxes, depreciation and amortization. Sysco's management considers growth in this metric to be a measure of overall financial performance that provides useful information to management and investors about the profitability of the business, as it facilitates comparison of performance on a consistent basis from period to period by providing a measurement of recurring factors and trends affecting our business. Additionally, it is a commonly used component metric used to inform on capital structure decisions. Adjusted EBITDA should not be used as a substitute for the most comparable GAAP measure in assessing the company’s financial performance for the periods presented. An analysis of any non-GAAP financial measure should be used in conjunction with results presented in accordance with GAAP. In the tables that follow, adjusted EBITDA for each period presented is reconciled to net earnings.
  • 27. 27 Sysco Corporation and its Consolidated Subsidiaries Non-GAAP Reconciliation (Unaudited) Impact of Certain Items on Earnings Before Interest, Taxes, Depreciation and Amortization (2Q22 vs. 2Q21) (In Thousands) 13-Week Period Ended Jan. 1, 2022 13-Week Period Ended Dec. 26, 2020 Change in Dollars %/bps Change Net earnings (GAAP) $ 167,441 $ 67,289 $ 100,152 148.8% Interest (GAAP) 242,899 146,498 96,401 65.8% Income taxes (GAAP) 45,245 13,831 31,414 227.1% Depreciation and amortization (GAAP) 191,297 184,811 6,486 3.5% EBITDA (Non-GAAP) $ 646,882 $ 412,429 $ 234,453 56.8% Certain Item adjustments: Impact of restructuring and transformational project costs (1) 23,193 29,674 (6,481) -21.8% Impact of acquisition-related costs (2) 7,085 - 7,085 NM Impact of bad debt reserve adjustments (3) (6,438) (30,271) 23,833 78.7% EBITDA adjusted for Certain Items (Non-GAAP) (4) $ 670,722 $ 411,832 $ 258,890 62.9% NM represents that the percentage change is not meaningful. (1) Fiscal 2022 and 2021 includes charges related to restructuring, severance, and facility closures, as well as various transformation initiative costs, primarily consisting of changes to our business technology strategy, excluding charges related to accelerated depreciation. (3) Fiscal 2022 and 2021 represent the reduction of bad debt charges previously taken on pre-pandemic trade receivable balances in fiscal 2020. (2) Fiscal 2022 includes acquisition and due diligence costs. (4) In arriving at adjusted EBITDA, Sysco does not adjust out interest income of $1 million and $3 million for fiscal 2022 and fiscal 2021, respectively, or non-cash stock compensation expense of $31 million and $20 million in fiscal 2022 and fiscal 2021, respectively.
  • 28. 28 Sysco Corporation and its Consolidated Subsidiaries Non-GAAP Reconciliation (Unaudited) Impact of Certain Items on Earnings Before Interest, Taxes, Depreciation and Amortization (2Q22 vs. 2Q19) (In Thousands) 13-Week Period Ended Jan. 1, 2022 13-Week Period Ended Dec. 29, 2018 Change in Dollars %/bps Change Net earnings (GAAP) $ 167,441 $ 267,380 $ (99,939) -37.4% Interest (GAAP) 242,899 87,113 155,786 178.8% Income taxes (GAAP) 45,245 87,205 (41,960) -48.1% Depreciation and amortization (GAAP) 191,297 204,786 (13,489) -6.6% EBITDA (Non-GAAP) $ 646,882 $ 646,484 $ 398 0.1% Certain Item adjustments: Impact of restructuring and transformational project costs (1) 23,193 106,881 (83,688) -78.3% Impact of acquisition-related costs (2) 7,085 (1,250) 8,335 NM Impact of bad debt reserve adjustments (3) (6,438) - (6,438) NM EBITDA adjusted for Certain Items (Non-GAAP) (4) $ 670,722 $ 752,115 $ (81,393) -10.8% NM represents that the percentage change is not meaningful. (1) Fiscal 2022 includes charges related to restructuring, severance, and facility closures, as well as various transformation initiative costs, primarily consisting of changes to our business technology strategy, excluding charges related to accelerated depreciation. Fiscal 2019 includes $81 million related to severance, restructuring and facility closure charges as well as various transformation initiative costs, excluding charges related to accelerated depreciation. (2) Fiscal 2022 includes acquisition and due diligence costs. Fiscal 2019 represents acquisition costs. (3) Fiscal 2022 represents the reduction of bad debt charges previously taken on pre-pandemic trade receivable balances in fiscal 2020. (4) In arriving at adjusted EBITDA, Sysco does not adjust out interest income of $1 million and $1 million for fiscal 2022 and fiscal 2019, respectively, or non-cash stock compensation expense of $31 million and $25 million in fiscal 2022 and fiscal 2019, respectively.
  • 29. 29 Sysco Corporation and its Consolidated Subsidiaries Segment Results Non-GAAP Reconciliation (Unaudited) Impact of Certain Items on Applicable Segments, 2Q22 vs. 2Q21 (Dollars in Thousands) 13-Week Period Ended Jan. 1, 2022 13-Week Period Ended Dec. 26, 2020 Change in Dollars %/bps Change U.S. FOODSERVICE OPERATIONS Sales $ 11,498,155 $ 7,924,143 $ 3,574,012 45.1% Gross Profit 2,139,278 1,559,322 579,956 37.2% Gross Margin 18.61% 19.68% -107 bps Operating expenses (GAAP) $ 1,462,456 $ 1,074,071 $ 388,385 36.2% Impact of restructuring and transformational project costs (16) (1,784) 1,768 99.1% Impact of acquisition-related costs (1) (13,131) - (13,131) NM Impact of bad debt reserve adjustments (2) 5,249 15,239 (9,990) -65.6% Operating expenses adjusted for Certain Items (Non-GAAP) $ 1,454,558 $ 1,087,526 $ 367,032 33.7% Operating income (GAAP) $ 676,822 $ 485,251 $ 191,571 39.5% Impact of restructuring and transformational project costs 16 1,784 (1,768) -99.1% Impact of acquisition-related costs (1) 13,131 - 13,131 NM Impact of bad debt reserve adjustments (2) (5,249) (15,239) 9,990 65.6% Operating income adjusted for Certain Items (Non-GAAP) $ 684,720 $ 471,796 $ 212,924 45.1% INTERNATIONAL FOODSERVICE OPERATIONS Sales (GAAP) $ 2,806,272 $ 1,967,789 $ 838,483 42.6% Impact of currency fluctuations (3) (34,061) - (34,061) -1.7% Comparable sales using a constant currency basis (Non-GAAP) $ 2,772,211 $ 1,967,789 $ 804,422 40.9% Gross Profit (GAAP) $ 565,931 $ 373,840 $ 192,091 51.4% Impact of currency fluctuations (3) (4,033) - (4,033) -1.1% Comparable gross profit using a constant currency basis (Non-GAAP) $ 561,898 $ 373,840 $ 188,058 50.3% Gross Margin (GAAP) 20.17% 19.00% 116 bps Impact of currency fluctuations (3) -0.10% - -10 bps Comparable gross margin using a constant currency basis (Non-GAAP) 20.27% 19.00% 127 bps Operating expenses (GAAP) $ 555,186 $ 453,789 $ 101,397 22.3% Impact of restructuring and transformational project costs (4) (11,621) (20,405) 8,784 43.0% Impact of acquisition-related costs (5) (18,475) (18,125) (350) -1.9% Impact of bad debt reserve adjustments (2) 1,191 13,797 (12,606) -91.4% Operating expenses adjusted for Certain Items (Non-GAAP) 526,281 429,056 97,225 22.7% Impact of currency fluctuations (3) (3,194) - (3,194) -0.7% Comparable operating expenses adjusted for Certain Items using a constant currency basis (Non-GAAP) $ 523,087 $ 429,056 $ 94,031 21.9% Operating income (loss) (GAAP) $ 10,745 $ (79,949) $ 90,694 113.4% Impact of restructuring and transformational project costs (4) 11,621 20,405 (8,784) -43.0% Impact of acquisition-related costs (5) 18,475 18,125 350 1.9% Impact of bad debt reserve adjustments (2) (1,191) (13,797) 12,606 91.4% Operating income (loss) adjusted for Certain Items (Non-GAAP) 39,650 (55,216) 94,866 171.8% Impact of currency fluctuations (3) (839) - (839) -1.5% Comparable operating income (loss) adjusted for Certain Items using a constant currency basis (Non-GAAP) $ 38,811 $ (55,216) $ 94,027 170.3% SYGMA Sales $ 1,771,323 $ 1,520,401 $ 250,922 16.5% Gross Profit 136,952 129,299 7,653 5.9% Gross Margin 7.73% 8.50% -77 bps Operating expenses (GAAP) $ 143,681 $ 117,971 $ 25,710 21.8% Impact of restructuring and transformational project costs - 6 (6) NM Operating expenses adjusted for Certain Items (Non-GAAP) $ 143,681 $ 117,977 $ 25,704 21.8% Operating (loss) income (GAAP) $ (6,729) $ 11,328 $ (18,057) -159.4% Impact of restructuring and transformational project costs - (6) 6 NM Operating (loss) income adjusted for Certain Items (Non-GAAP) $ (6,729) $ 11,322 $ (18,051) -159.4%
  • 30. 30 Sysco Corporation and its Consolidated Subsidiaries Segment Results Non-GAAP Reconciliation (Unaudited) Impact of Certain Items on Applicable Segments, 2Q22 vs. 2Q21 (Dollars in Thousands) continued OTHER Sales $ 244,453 $ 146,649 $ 97,804 66.7% Gross Profit 54,809 35,767 19,042 53.2% Gross Margin 22.42% 24.39% -197 bps Operating expenses (GAAP) $ 54,626 $ 36,785 $ 17,841 48.5% Impact of bad debt reserve adjustments (2) (2) 1,235 (1,237) -100.2% Operating expenses adjusted for certain items (Non-GAAP) $ 54,624 $ 38,020 $ 16,604 43.7% Operating income (loss) (GAAP) $ 183 $ (1,018) $ 1,201 118.0% Impact of bad debt reserve adjustments (2) 2 (1,235) 1,237 100.2% Operating income (loss) adjusted for certain items (Non-GAAP) $ 185 $ (2,253) $ 2,438 108.2% GLOBAL SUPPORT CENTER Gross Profit $ (5,820) $ 230 $ (6,050) NM Operating expenses (GAAP) $ 230,292 $ 203,780 $ 26,512 13.0% Impact of restructuring and transformational project costs (6) (11,832) (11,977) 145 1.2% Impact of acquisition related costs (7) (2,126) - (2,126) NM Operating expenses adjusted for Certain Items (Non-GAAP) $ 216,334 $ 191,803 $ 24,531 12.8% Operating loss (GAAP) $ (236,112) $ (203,550) $ (32,562) -16.0% Impact of restructuring and transformational project costs (6) 11,832 11,977 (145) -1.2% Impact of acquisition related costs (7) 2,126 - 2,126 NM Operating loss adjusted for Certain Items (Non-GAAP) $ (222,154) $ (191,573) $ (30,581) -16.0% TOTAL SYSCO Sales $ 16,320,203 $ 11,558,982 $ 4,761,221 41.2% Gross Profit 2,891,150 2,098,458 792,692 37.8% Gross margin 17.72% 18.15% -44 bps Operating expenses (GAAP) $ 2,446,241 $ 1,886,396 $ 559,845 29.7% Impact of restructuring and transformational project costs (4) (6) (23,469) (34,160) 10,691 31.3% Impact of acquisition-related costs (1) (5) (7) (33,732) (18,125) (15,607) -86.1% Impact of bad debt reserve adjustments (2) 6,438 30,271 (23,833) -78.7% Operating expenses adjusted for Certain Items (Non-GAAP) $ 2,395,478 $ 1,864,382 $ 531,096 28.5% Operating income (GAAP) $ 444,909 $ 212,062 $ 232,847 109.8% Impact of restructuring and transformational project costs (4) (6) 23,469 34,160 (10,691) -31.3% Impact of acquisition-related costs (1) (5) (7) 33,732 18,125 15,607 86.1% Impact of bad debt reserve adjustments (2) (6,438) (30,271) 23,833 78.7% Operating income adjusted for Certain Items (Non-GAAP) $ 495,672 $ 234,076 $ 261,596 111.8% (4) Includes restructuring and facility closure costs primarily in Europe. (5) Represents intangible amortization expense. NM represents that the percentage change is not meaningful. (7) Represents due diligence costs. (3) Represents a constant currency adjustment, which eliminates the impact of foreign currency fluctuations on current year results. (6) Includes various transformation initiative costs, primarily consisting of changes to our business technology strategy. (1) Fiscal 2022 includes intangible amortization expense and acquisition costs. (2) Fiscal 2022 and 2021 represent the reduction of bad debt charges previously taken on pre-pandemic trade receivable balances in fiscal 2020.
  • 31. 31 Sysco Corporation and its Consolidated Subsidiaries Segment Results Non-GAAP Reconciliation (Unaudited) Impact of Certain Items on Applicable Segments, 2Q22 vs. 2Q19 (Dollars in Thousands) 13-Week Period Ended Jan. 1, 2022 13-Week Period Ended Dec. 29, 2018 Change in Dollars %/bps Change U.S. FOODSERVICE OPERATIONS Sales $ 11,498,155 $ 10,087,105 $ 1,411,050 14.0% Gross Profit 2,139,278 2,001,819 137,459 6.9% Gross Margin 18.61% 19.85% -124 bps Operating expenses (GAAP) $ 1,462,456 $ 1,264,342 $ 198,114 15.7% Impact of restructuring and transformational project costs (16) - (16) NM Impact of acquisition-related costs (1) (13,131) - (13,131) NM Impact of bad debt reserve adjustments (2) 5,249 - 5,249 NM Operating expenses adjusted for Certain Items (Non-GAAP) $ 1,454,558 $ 1,264,342 $ 190,216 15.0% Operating income (GAAP) $ 676,822 $ 737,477 $ (60,655) -8.2% Impact of restructuring and transformational project costs 16 - 16 NM Impact of acquisition-related costs (1) 13,131 - 13,131 NM Impact of bad debt reserve adjustments (2) (5,249) - (5,249) NM Operating income adjusted for Certain Items (Non-GAAP) $ 684,720 $ 737,477 $ (52,757) -7.2% INTERNATIONAL FOODSERVICE OPERATIONS Sales (GAAP) $ 2,806,272 $ 2,890,598 $ (84,326) -2.9% Gross Profit (GAAP) 565,931 589,922 (23,991) -4.1% Gross Margin (GAAP) 20.17% 20.41% -25 bps Operating expenses (GAAP) $ 555,186 $ 604,839 $ (49,653) -8.2% Impact of restructuring and transformational project costs (3) (11,621) (81,020) 69,399 85.7% Impact of acquisition-related costs (4) (18,475) (16,947) (1,528) -9.0% Impact of bad debt reserve adjustments (2) 1,191 - 1,191 NM Operating expenses adjusted for Certain Items (Non-GAAP) $ 526,281 $ 506,872 $ 19,409 3.8% Operating income (loss) (GAAP) $ 10,745 $ (14,917) $ 25,662 172.0% Impact of restructuring and transformational project costs (3) 11,621 81,020 (69,399) -85.7% Impact of acquisition-related costs (4) 18,475 16,947 1,528 9.0% Impact of bad debt reserve adjustments (2) (1,191) - (1,191) NM Operating income adjusted for Certain Items (Non-GAAP) $ 39,650 $ 83,050 $ (43,400) -52.3% SYGMA Sales $ 1,771,323 $ 1,536,607 $ 234,716 15.3% Gross Profit 136,952 121,537 15,415 12.7% Gross Margin 7.73% 7.91% -18 bps Operating expenses (GAAP) $ 143,681 $ 118,423 $ 25,258 21.3% Operating (loss) income (GAAP) $ (6,729) $ 3,114 $ (9,843) NM
  • 32. 32 Sysco Corporation and its Consolidated Subsidiaries Segment Results Non-GAAP Reconciliation (Unaudited) Impact of Certain Items on Applicable Segments, 2Q22 vs. 2Q19 (Dollars in Thousands) continued OTHER Sales $ 244,453 $ 251,397 $ (6,944) -2.8% Gross Profit 54,809 63,501 (8,692) -13.7% Gross Margin 22.42% 25.26% -284 bps Operating expenses (GAAP) $ 54,626 $ 57,783 $ (3,157) -5.5% Impact of bad debt reserve adjustments (2) (2) - (2) NM Operating expenses adjusted for certain items (Non-GAAP) $ 54,624 $ 57,783 $ (3,159) -5.5% Operating income (GAAP) $ 183 $ 5,718 $ (5,535) -96.8% Impact of bad debt reserve adjustments (2) 2 - 2 NM Operating income adjusted for certain items (Non-GAAP) $ 185 $ 5,718 $ (5,533) -96.8% GLOBAL SUPPORT CENTER Gross Profit $ (5,820) $ (5,067) $ (753) -14.9% Operating expenses (GAAP) $ 230,292 $ 274,430 $ (44,138) -16.1% Impact of restructuring and transformational project costs (5) (11,832) (53,416) 41,584 77.8% Impact of acquisition related costs (6) (2,126) (61) (2,065) NM Operating expenses adjusted for Certain Items (Non-GAAP) $ 216,334 $ 220,953 $ (4,619) -2.1% Operating loss (GAAP) $ (236,112) $ (279,497) $ 43,385 15.5% Impact of restructuring and transformational project costs (5) 11,832 53,416 (41,584) -77.8% Impact of acquisition related costs (6) 2,126 61 2,065 NM Operating loss adjusted for Certain Items (Non-GAAP) $ (222,154) $ (226,020) $ 3,866 1.7% TOTAL SYSCO Sales $ 16,320,203 $ 14,765,707 $ 1,554,496 10.5% Gross Profit 2,891,150 2,771,712 119,438 4.3% Gross margin 17.72% 18.77% -106 bps Operating expenses (GAAP) $ 2,446,241 $ 2,319,817 $ 126,424 5.4% Impact of restructuring and transformational project costs (3) (5) (23,469) (134,436) 110,967 82.5% Impact of acquisition-related costs (1) (4) (6) (33,732) (17,008) (16,724) -98.3% Impact of bad debt reserve adjustments (2) 6,438 - 6,438 NM Operating expenses adjusted for Certain Items (Non-GAAP) $ 2,395,478 $ 2,168,373 $ 227,105 10.5% Operating income (GAAP) $ 444,909 $ 451,895 $ (6,986) -1.5% Impact of restructuring and transformational project costs (3) (5) 23,469 134,436 (110,967) -82.5% Impact of acquisition-related costs (1) (4) (6) 33,732 17,008 16,724 98.3% Impact of bad debt reserve adjustments (2) (6,438) - (6,438) NM Operating income adjusted for Certain Items (Non-GAAP) $ 495,672 $ 603,339 $ (107,667) -17.8% (6) Represents due diligence costs from the Greco and Sons acquisition. NM represents that the percentage change is not meaningful. (3) Includes restructuring and facility closure costs primarily in Europe. (1) Fiscal 2022 includes intangible amortization expense and acquisition costs. (2) Fiscal 2022 represent the reduction of bad debt charges previously taken on pre-pandemic trade receivable balances in fiscal 2020. (4) Represents intangible amortization expense. (5) Includes various transformation initiative costs, primarily consisting of changes to our business technology strategy.
  • 33. 33 Sysco Corporation and its Consolidated Subsidiaries Non-GAAP Reconciliation (Unaudited) Free Cash Flow, YTD22 vs. YTD21 and YTD22 vs.YTD19 (In Thousands) Net cash provided by operating activities (GAAP) $ 377,048 $ 936,678 $ (559,630) $ 377,048 $ 917,790 $ (540,742) Additions to plant and equipment (181,374) (163,944) (17,430) (181,374) (223,825) 42,451 Proceeds from sales of plant and equipment 5,450 15,510 (10,060) 5,450 6,901 (1,451) Free Cash Flow (Non-GAAP) $ 201,124 $ 788,244 $ (587,120) $ 201,124 $ 700,866 $ (499,742) Change in Dollars 26-Week Period Ended Jan. 1, 2022 26-Week Period Ended Dec. 26, 2020 Change in Dollars 26-Week Period Ended Jan. 1, 2022 26-Week Period Ended Dec. 26, 2018 Free cash flow represents net cash provided from operating activities less purchases of plant and equipment and includes proceeds from sales of plant and equipment. Sysco considers free cash flow to be a liquidity measure that provides useful information to management and investors about the amount of cash generated by the business after the purchases and sales of buildings, fleet, equipment and technology, which may potentially be used to pay for, among other things, strategic uses of cash including dividend payments, share repurchases and acquisitions. However, free cash flow may not be available for discretionary expenditures, as it may be necessary that we use it to make mandatory debt service or other payments. Free cash flow should not be used as a substitute for the most comparable GAAP measure in assessing the company’s liquidity for the periods presented. An analysis of any non-GAAP financial measure should be used in conjunction with results presented in accordance with GAAP. In the table that follows, free cash flow for each period presented is reconciled to net cash provided by operating activities.